This
Use the following menu options to navigate the SL1 user interface:
- To view a pop-out list of menu options, click the menu icon (
).
- To view a page containing all the menu options, click the Advanced menu icon (
).
This
What is a Presentation Object?
Presentation Objects define how SL1 should present data for Dynamic Applications with an archetype of Performance or Journal. For performance Dynamic Applications, a presentation object defines how SL1 uses the collected values for the collection objects to generate graphs.
For example, a Dynamic Application that is designed to collect information about file system usage on a device might define:
- Two collection objects, one that collects the total size of each file system and one that collects the amount of space used on each file system.
- A presentation object that defines a graph. This graph displays the percentage of space used for each file system. The presentation object would include a formula that uses both collection objects.
Viewing the Presentation Objects in a Dynamic Application
To view the presentation objects in a Dynamic Application:
- Go to the Dynamic Applications Manager page (System > Manage > Dynamic Applications).
- Find the Dynamic Application you want to view the presentation objects for. Click its wrench icon (
 ). The Dynamic Applications Properties Editor page is displayed.
 - Click the tab. The Dynamic Applications Presentation Objects page is displayed. The Presentation Object Registry pane at the bottom of the page displays a list of defined reports.
- For each report in a Dynamic Application of type Performance, the Presentation Object Registry displays the following:
- Report Name. The name of the presentation object.
- State. The state of the presentation object. Possible values are:
- Enabled. SL1 will generate graphs for this presentation object.
- Disabled. SL1 will not generate graphs for this presentation object.
- Abbreviation Suffix. Abbreviation for the unit of measure to display in the report.
- Label Group. Name of the Collection Group aligned with the presentation object. For more information on Collection Labels, see the section on Collection Labels.
- Label. Name of the Collection Label aligned with the presentation object. The Vitals group is available as a Collection Label and preserves the previous behavior of Vitals Link.For more information on Collection Labels, see the section on Collection Labels.
- Precedence. Weight assigned to this presentation object. For more information on Collection Labels and Precedence, see the section on Precedence.
- Show as Percent. Specifies whether the resulting graph displays percent values. If so, the y-axis of the graph will range from 0 - 100 percent.
- Enabled. The graph displays percent values.
- Disabled. The graph does not display percent values.
- ID. The unique ID assigned to the report. SL1 automatically generates and assigns this identifier.
- Date Edit. Date and time the report definition was last edited.

Creating a Presentation Object
To add a presentation object to a performance Dynamic Application, perform the following steps:
- Go to the Dynamic Applications Manager page (System > Manage > Dynamic Applications).
- Find the performance Dynamic Application you want to add a presentation object to. Click its wrench icon (
 ). The Dynamic Applications Properties Editor page is displayed.
 - Click the tab. The Dynamic Applications Presentation Objects page is displayed.
- In the Dynamic Applications Presentation Objects page, click the button to clear values from the fields in the top pane, the Formula Editor pane, and the Guide Text pane.
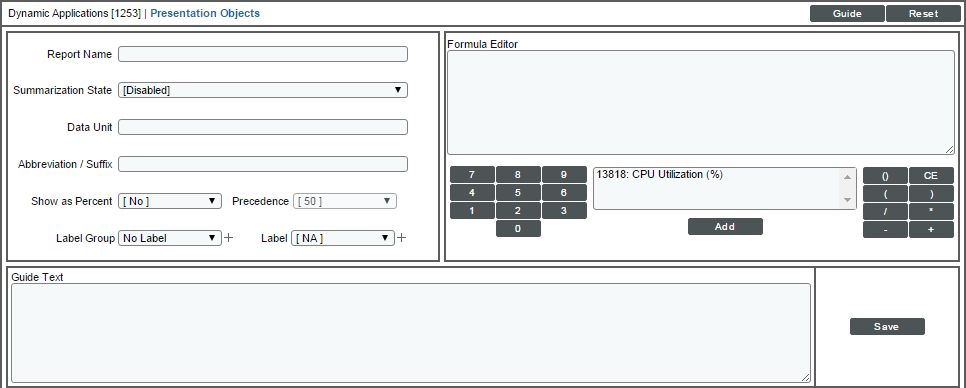
- Supply values in the following fields:
- Report Name. Name of the report. Can be any combination of alpha-numeric characters. This name will appear as the name of the report.
- Summarization State. Specifies whether SL1 should include hourly and daily summary statistics for the presentation object in the graph. Choices are:
- Enabled. SL1 will include summary statistics for the presentation object in the graph.
- Disabled. SL1 will not include summary statistics for the presentation object in the graph.
- Data Unit. Units used in the graph. Can be any combination of alphanumeric characters, up to 25 characters in length.
- Abbreviation/Suffix. Abbreviation for units used in the graph. Can be any combination of alphanumeric characters, up to 16 characters in length.
- Show as Percent. Specifies whether the resulting graph displays percent values. If so, the y-axis of the graph will range from 0 – 100 percent.
- Enabled. The graph displays percent values.
- Disabled. The graph does not display percent values.
- Precedence. Weight to assign to this presentation object. For more information on Collection Labels and Precedence, see the section on Precedence.
- Label Group. Name of the Collection Group to align with the presentation object. The Vitals group is available as a Collection Label and preserves the previous behavior of Vitals Link. You can click the plus-sign (+) to create a new Collection Group. For more information on Collection Labels, see the section on Collection Labels.
- Label. Name of the Collection Label to align with the presentation object. You can click the plus-sign (+) to create a new Collection Label.
- Formula Editor. The formula SL1 will use to generate graphs for the presentation object. For a full description of this field, see the Presentation Object Formulas section.
- Guide Text. Enter optional guide text for the presentation object.
- Click the button to save the presentation object.
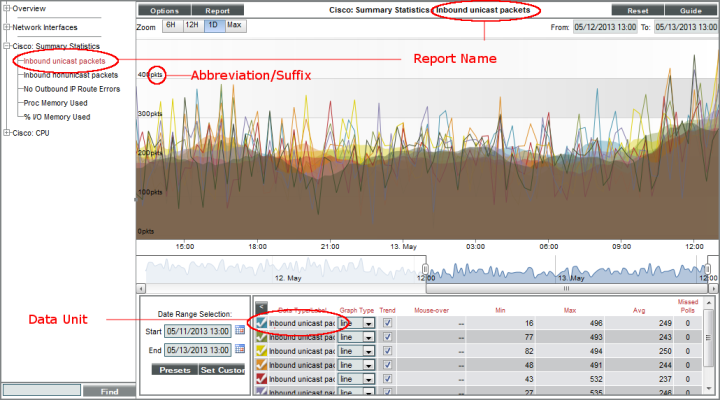
The following picture shows where the Report Name, Data Unit, and Abbreviation/Suffix values are displayed for a presentation object:
Presentation Object Formulas
The Formula Editor allows users to define which object value(s) that will be used to generate the graph for this presentation object and the mathematical manipulations that must be performed on those object values. The result of a defined formula must be a single numeric value.
A presentation object formula can include:
- The ID for one or more collection objects in the same Dynamic Application. All collection object IDs start with "o_" (lowercase "oh", underscore).
- The four main arithmetic operators (+, -, *, /).
- Parentheses, which set precedence for arithmetic operators.
- Braces ({ and }), which can be used to specify that an object is optional, and the formula should still be evaluated even if a value for the optional object has not been collected.
- Any PHP math function that evaluates to a numeric value. For information about PHP math functions, see http://www.php.net/math.
The operators and PHP math functions may be used in any combination and with any number of collection object IDs, provided that the result of the expression always equates to a single numeric value.
The following examples are all valid presentation formulas:
o_123
abs(o_123)
o_123 / o_124 * 100
(o_123 + o_124) * o_125
o_123 + {o_124}
The scrolling list below the Formula Editor contains a list of all objects in the Dynamic Application. To insert the ID for a collection object in to the formula, select the collection object from the list, and then select the button.
The Guide Text pane allows users to include descriptive text with each graph. When a user views the graph in the Device Performance page, the button will display the text from this pane.
Vitals Linking
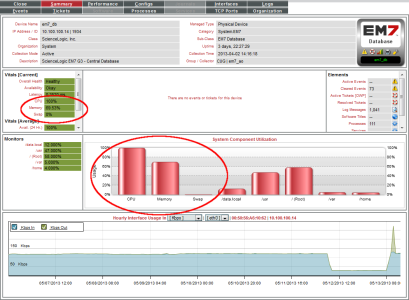
When Vitals Linking is enabled for a presentation object in a Dynamic Application, SL1 will use the presentation object to calculate and display CPU, Memory, or Swap utilization values for devices that subscribe to the Dynamic Application.
For example, suppose that a device subscribes to the default "Net-SNMP: CPU" Dynamic Application, which collects CPU data from Net-SNMP agents. The "Overall CPU" presentation object in this Dynamic Application has CPU selected in the Vitals Link field. When a user selects the tab in the Device Summary window for this device:
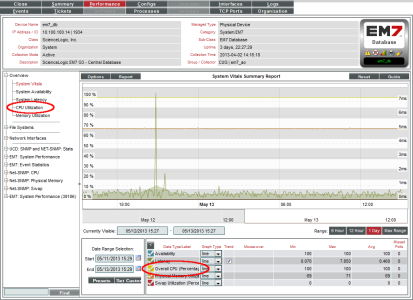
- The System Vitals Summary Report (Overview > System Vitals) will include the graph generated by the "Overall CPU" presentation object.
- The Overall CPU Utilization Report (Overview > CPU Utilization) will show the graph generated by the "Overall CPU" presentation object.
Additionally, SL1 will calculate hourly CPU usage for that device using the "Overall CPU" presentation formula. The presentation formula uses collected values from the device, specified in the collection objects. The hourly CPU data is stored separately from the other Dynamic Application data. The hourly data for CPU, Memory, and Swap Utilization is used:
Editing a Presentation Object
To edit a presentation object in a Dynamic Application, perform the following steps:
- Go to the Dynamic Applications Manager page (System > Manage > Dynamic Applications).
- Find the Dynamic Application you want to edit. Click its wrench icon (
 ). The Dynamic Applications Properties Editor page is displayed.
 - Click the tab. The Dynamic Applications Presentation Objects page is displayed.
- In the Presentation Object Registry pane at the bottom of the page, locate the presentation object you want to edit. Click the wrench icon (
 ) for the presentation object you want to edit.
 - The fields in the top pane will be populated with the saved values for the selected presentation object. Edit the values in one or more fields. For a description of each field, see the Creating a Presentation Object section.
- Click the button to save your changes to the presentation object. Click the button to save the changes as a new presentation object.
Deleting a Presentation Object
To delete a presentation object from a Dynamic Application, perform the following steps:
- Go to the Dynamic Applications Manager page (System > Manage > Dynamic Applications).
- Find the Dynamic Application you want to edit. Click its wrench icon (
 ). The Dynamic Applications Properties Editor page is displayed.
- Click the tab. The Dynamic Applications Presentation Objects page is displayed.
- In the Presentation Object Registry pane at the bottom of the page, locate the presentation object you want to delete. Click its bomb icon (
 ). The presentation object is deleted from SL1. Any collected data that the presentation object used will remain in SL1. However, you will no longer be able to view any graphs generated using the presentation object.


