![]()
This
PowerFlow and Synchronization PowerPacks content not created by ScienceLogic is not supported by ScienceLogic. This includes custom steps, PowerFlow applications, and Synchronization PowerPacks.
This
Initial Troubleshooting Steps
PowerFlow acts as a middle server between data platforms. For this reason, the first steps should always be to ensure that there are no issues with the data platforms with which PowerFlow is talking. There might be additional configurations or actions enabled on ServiceNow or SL1 that result in unexpected behavior. For detailed information about how to perform the steps below, see Resources for Troubleshooting.
SL1 PowerFlow
- Run docker service ls on the PowerFlow server.
- Note the Docker container version, and verify that the Docker services are running.
- If a certain service is failing, make a note the service name and version.
- If a certain service is failing, run docker service ps <service_name> to see the historical state of the service and make a note of this information. For example: docker service ps iservices_contentapi.
- Make a note of any logs impacting the service by running docker service logs <service_name>. For example: docker service logs iservices_couchbase.
ServiceNow
- Make a note of the ServiceNow version and Synchronization PowerPack version, if applicable.
- Make a note of the Synchronization PowerPack application that is failing on PowerFlow.
- Make a note of what step is failing in the application, try running the application in debug mode, and capture any traceback or error messages that occur in the step log.
Resources for Troubleshooting
This section contains port information for PowerFlow and troubleshooting commands for Docker, Couchbase, and the PowerFlow API.
Useful PowerFlow Ports
- https://<IP of PowerFlow>:8091. Provides access to Couchbase, a NoSQL database for storage and data retrieval.
- https://<IP of PowerFlow>:15672. Provides access to the RabbitMQ Dashboard, which you can use to monitor the service that distributes tasks to be executed by PowerFlow workers. Use guest/guest for the login.
- https://<IP of PowerFlow>/flower/dashboard. Provides access to Flower, a tool for monitoring and administrating Celery clusters.
For version 2.0.0 and later of PowerFlow, port 5556 must be open for both PowerFlow and the client.
powerflowcontrol healthcheck and autoheal actions
SL1 PowerFlow includes a command-line utility called powerflowcontrol (pfctl) that performs multiple administrator-level actions in a clustered PowerFlow environment. The powerflowcontrol utility contains automatic cluster healthcheck and autoheal actions that you can use to prevent issues with your PowerFlow environment.
For more information, see Using the powerflowcontrol (pfctl) Command-line Utility.
Helpful Docker Commands
PowerFlow is a set of services that are containerized using Docker. For more information about Docker, see the Docker tutorial.
Use the following Docker commands for troubleshooting and diagnosing issues with PowerFlow:
Viewing Container Versions and Status
To view the PowerFlow version, SSH to your PowerFlow instance and run the following command:
docker service ls
In the results, you can see the container ID, name, mode, status (see the replicas column), and version (see the image column) for all the services that make up PowerFlow:

Restarting a Service
Run the following command to restart a single service:
docker service update --force <service_name>
Stopping all PowerFlow Services
Run the following command to stop all PowerFlow services:
docker stack rm iservices
Restarting Docker
Run the following command to restart Docker:
systemctl restart docker
Restarting Docker does not clear the queue.
Viewing Logs for a Specific Service
You can use the Docker command line to view the logs of any current running service in the PowerFlow cluster. To view the logs of any service, run the following command:
docker service logs -f iservices_<service_name>
Some common examples include the following:
docker service logs –f iservices_couchbase
docker service logs –f iservices_steprunner
docker service logs –f iservices_contentapi
Application logs are stored on the central database as well as on all of the Docker hosts in a clustered environment. These logs are stored at /var/log/iservices for both single-node or clustered environments. However, the logs on each Docker host only relate to the services running on that host. For this reason, using the Docker service logs is the best way to get logs from all hosts at once.
Clearing RabbitMQ Volume
RabbitMQ is a service that distributes tasks to be executed by PowerFlow workers. This section covers how to handle potential issues with RabbitMQ.
The following error message might appear if you try to run a PowerFlow application via the API:
Internal error occurred: Traceback (most recent call last):\n File \"./content_api.py\", line 199, in kickoff_application\n task_status = ... line 623, in _on_close\n (class_id, method_id), ConnectionError)\nInternalError: Connection.open: (541) INTERNAL_ERROR - access to vhost '/' refused for user 'guest': vhost '/' is down
First, verify that your services are up. If there is an issue with your RabbitMQ volume, you can clear the volume with the following commands:
docker service rm iservices_rabbitmq
docker volume rm iservices_rabbitdb
If you get a message stating that the volume is in use, run the following command:
docker rm <id of container using volume>
Re-deploy PowerFlow by running the following command:
docker stack deploy -c /opt/iservices/scripts/docker-compose.yml iservices
Restarting Docker does not clear the queue, because the queue is persistent. However, clearing the queue with the commands above might result in data loss due to the tasks being removed from the queue.
Viewing the Process Status of All Services
Run the following command:
docker ps
Deploying Services from a Defined Docker Compose File
Run the following command:
docker stack deploy -c <compose-file> iservices
Dynamically Scaling for More Workers
Run the following command:
docker service scale iservices_steprunner=10
Completely Removing Services from Running
Run the following command:
docker stack rm iservices
Helpful Couchbase Commands
Checking the Couchbase Cache to Ensure an SL1 Device ID is Linked to a ServiceNow Sys ID
You can determine how an SL1 device links to a ServiceNow CI record by using the respective device and sys IDs. You can retrieve these IDs from the PowerFlow Couchbase service.
First, locate the correlation ID with the following Couchbase query:
select meta().id from logs where meta().id like "lookup%"
This query returns results similar to the following:
[
{
"id": "lookup-ScienceLogicRegion+DEV+16"
},
{
"id": "lookup-ScienceLogicRegion+DEV+17"
}
]
After you locate the correlation ID, run the following query:
select cache_data from logs where meta().id = "lookup-ScienceLogicRegion+DEV+16"
This query returns the following results:
[
{
"cache_data": {
"company": "d6406d3bdbc72300c40bdec0cf9619c2",
"domain": null,
"snow_ci": "u_cmdb_ci_aws_service",
"sys_id": "0c018f14dbd36300f3ac70adbf9619f7"
}
}
]
Accessing Couchbase with the Command-line Interface
If you don't have access to port 8091 on your PowerFlow instance, you can connect to the Couchbase container by using the command-line interface (CLI).
To access Couchbase by using the CLI, run the following commands:
docker exec -it <container_id> /bin/bash
cbq -u <username> -p <password> -e "https://<localhost>:8091"
Useful API Commands
Getting PowerFlow Applications from the PowerFlow API
You can use the API or cURL to retrieve the application code, which is useful when you are troubleshooting potential code-related issues. You cannot access these API endpoints with a browser, but you can request these API endpoints by using an application such as Postman:
https://<PowerFlow>/api/v1/applications/<application_name>
If you do not have access to Postman, you can use cURL to get the same information.
curl -iku <username>:<password> -H "Accept: application/json" -H "Content-Type: application/json" -X GET https://<PowerFlow>/api/v1/applications/<application_name>
Creating and Retrieving Schedules with the PowerFlow API
You can define and retrieve schedules using the PowerFlow API. You can define all of these schedules in the PowerFlow user interface as well.
To create a schedule via the API, POST the following payload to the API endpoint: https://<PowerFlow>/api/v1/schedule
{
"application_id": "APP_ID",
"entry_id": "SCHEDULE_NAME",
"params": {"a":"B"},
"schedule": {
"schedule_info": {
"day_of_month": "*",
"day_of_week": "*",
"hour": "*",
"minute": "*",
"month_of_year": "*"
},
"schedule_type": "crontab"
},
"total_runs": 0
}
You can also specify the schedule to run on a frequency in seconds by replacing the schedule portion with the following:
"schedule": {
"schedule_info": {
"run_every": FREQUENCY_IN_SECONDS
},
"schedule_type": "frequency"
}
Diagnosis Tools
Multiple diagnosis tools exist to assist in troubleshooting issues with the PowerFlow platform:
-
Docker PowerPack. This PowerPack monitors your Linux-based PowerFlow server with SSH (the PowerFlow ISO is built on top of an Oracle Linux Operating System). This PowerPack provides key performance indicators about how your PowerFlow server is performing. For more information on the Docker PowerPack and other PowerPacks that you can use to monitor PowerFlow, see the
-
Flower. This web interface tool can be found at the /flower endpoint. It provides a dashboard displaying the number of tasks in various states as well as an overview of the state of each worker. This tool shows the current number of active, processed, failed, succeeded, and retried tasks on the PowerFlow platform. This tool also shows detailed information about each of the tasks that have been executed on the platform. This data includes the UUID, the state, the arguments that were passed to it, as well as the worker and the time of execution. Flower also provides a performance chart that shows the number of tasks running on each individual worker.
-
Debug Mode. All applications can be run in "debug" mode via the PowerFlow API. Running applications in debug mode may slow down the platform, but they will result in much more detailed logging information that is helpful for troubleshooting issues. For more information on running applications in Debug Mode, see Retrieving Additional Debug Information.
-
Application Logs. All applications generate a log file specific to that application. These log files can be found at /var/log/iservices and each log file will match the ID of the application. These log files combine all the log messages of all previous runs of an application up to a certain point. These log files roll over and will get auto-cleared after a certain point.
-
Step Logs. Step logs display the log output for a specific step in the application. These step logs can be accessed via the PowerFlow user interface by clicking on a step in an application and bringing up the Step Log tab. These step logs display just the log output for the latest run of that step.
-
Service Logs. Each Docker service has its own log. These can be accessed via SSH by running the following command:
docker service logs -f <service_name>
Identifying Why a Service or Container Failed
This section outlines the troubleshooting steps necessary to determine the underlying root cause of why a service or container was restarted. For this section, we use the iservices_redis service as an example.
Step 1: Obtain the ID of the failed container for the service
Run the following command for the service that failed previously:
docker service ps --no-trunc <servicename>
For example:
docker service ps --no-trunc iservices_redis

From the command result above, we see that one container with the id 3s7s86n45skf had failed previously while running on node is-scale-03, with the error "non-zero exit", and another container was restarted in its place.
At this point, we can ask the following questions:
- When you run docker service ps --no-trunc, is the error something obvious? Does the error say that it cannot mount a volume, or that the image is not found? If so, that's most likely the root cause of the issue and what needs to be addressed
- Did the node on which that container was running go down? Or is that node still up?
- Are the other services running on that node running fine? Was only this single service affected?
- If other services are running fine on that same node, it is probably a problem with the service itself. If all services on that node are not functional, it could mean a node failure.
At this point, we should be confident that the cause of the issue is not a deploy configuration issue, it is not an entire node failure, and the problem exists within the service itself. Continue to Step 2 if this is the case.
Step 2: Check for any error messages or logs indicating an error
Using the id obtained from step 1 we can collect the logs from the failed container with the following commands:
docker service logs <failed-id>
For example:
docker service logs 3s7s86n45skf
Search the service logs for any explicit errors or warning messages that might indicate why the failure occurred.
Usually, you can find the error message in those logs, but if the container ran out of memory, it may not be seen here. Continue to Step 3 if the logs provide nothing fruitful.
Step 3: Check for out of memory events
If there were no errors in the logs, or anywhere else that can be seen, a possible cause for a container restart could be that the system ran out of memory.
Perform the following steps to identify if this is the case:
-
Log in to the node where the container failed in our example. As seen in step 1, the container failed on is-scale-03.
-
From the node where the container failed, run the following command:
journalctl -k | grep -i -e memory -e oom
-
Check the result for any out of memory events that caused the container to stop. Such an event typically looks like the following:
is-scale-03 kernel: Out of memory: Kill process 5946 (redis-server) score 575 or sacrifice child
Troubleshooting a Cloud Deployment of PowerFlow
After completing the AWS setup instructions, if none of the services start and you see the following error during troubleshooting, you will need to restart Docker after installing the RPM installation.
sudo docker service ps iservices_couchbase --no-trunc
"error creating external connectivity network: Failed to Setup IP tables: Unable to enable SKIP DNAT rule: (iptables failed: iptables --wait -t nat -I DOCKER -i docker_gwbridge -j RETURN: iptables: No chain/target/match by that name."
Identifying Why a PowerFlow Application Failed
The following topics describe how to determine where a PowerFlow application failed, and how to retrieve more log information related to that failure from the logs.
Determining Where an Application Failed
If a PowerFlow application fails, a red failure icon appears under that application on the Application detail page.
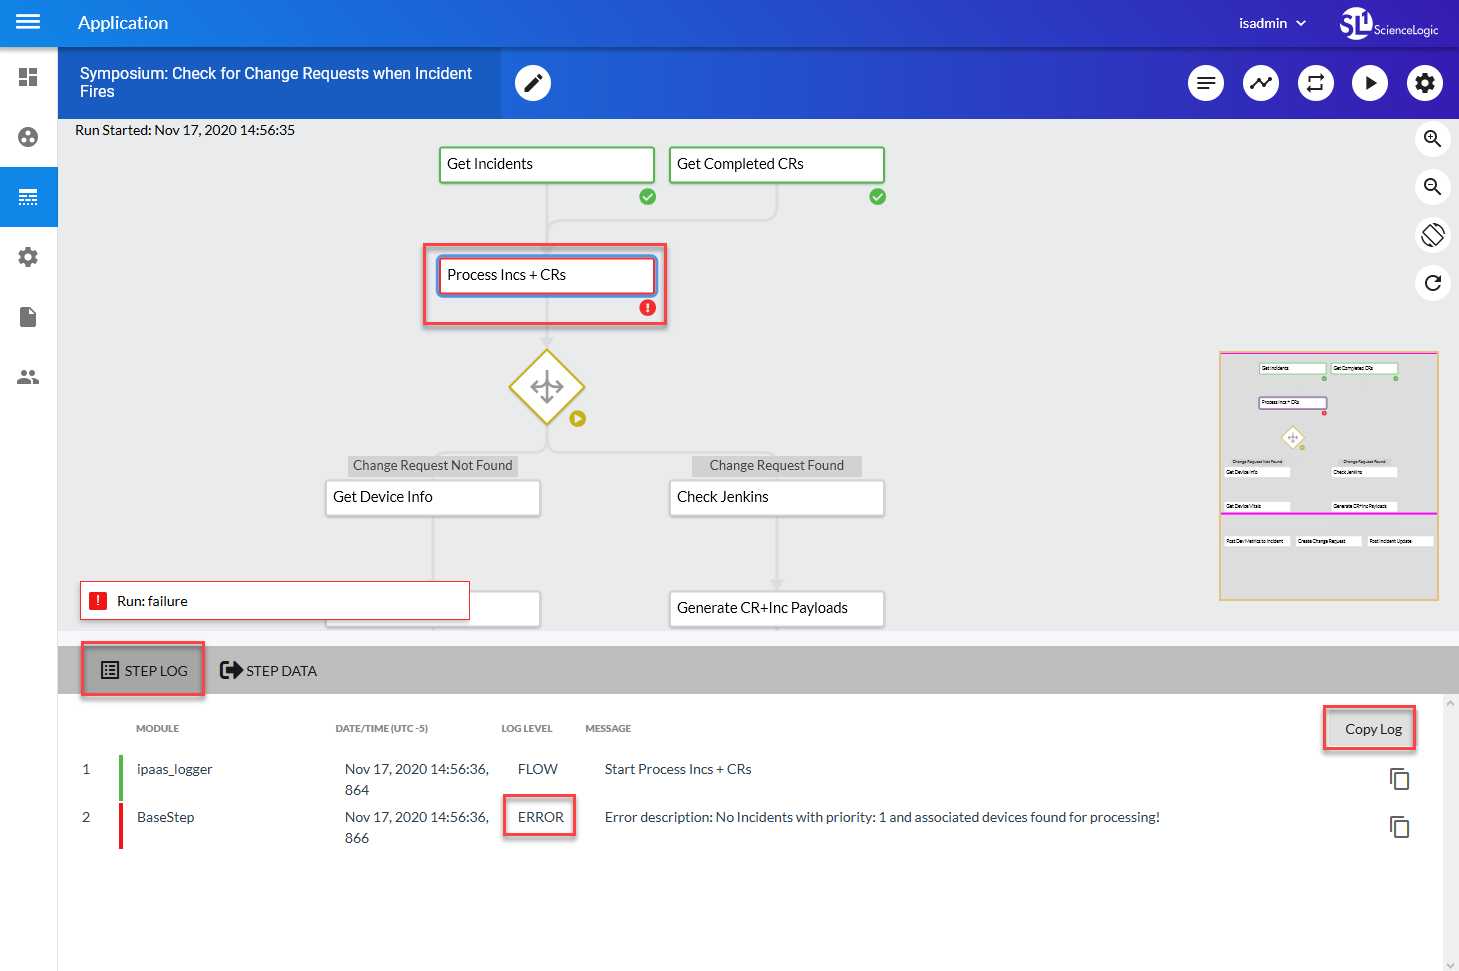
To determine where the application is failing:
- Open the application and locate which step is failing. A failed step is highlighted in red in the image above.
- Select the step and click the Step Log tab to view the logs for that step.
- Review the error message to determine the next steps.
Retrieving Additional Debug Information (Debug Mode)
The logs in PowerFlow use the following loglevel settings, from most verbose to least verbose:
- 10. Debug Mode.
- 20. Informational.
- 30. Warning. This is the default settings if you do not specify a loglevel.
- 40. Error.
If you run applications with "loglevel": 10, those applications will take longer to run because of increased I/O requirements. Enabling debug logging using the following process is the only recommended method. ScienceLogic does not recommend setting "loglevel": 10 for the whole stack with the docker-compose file.
To run an application in Debug Mode using the PowerFlow user interface:
-
Select the PowerFlow application from the Applications page.
-
Hover over the (
 ) from and select Debug Run from the pop-up menu. PowerFlow executes the application in Debug Mode with a log level of 10.
To run an application in Debug Mode using the API:
-
POST the following to the API endpoint:
https://<PowerFlow>/api/v1/applications/run
-
Include the following in the request body:
{
"name": "<application_name>",
"params": {
"loglevel": 10
}
}
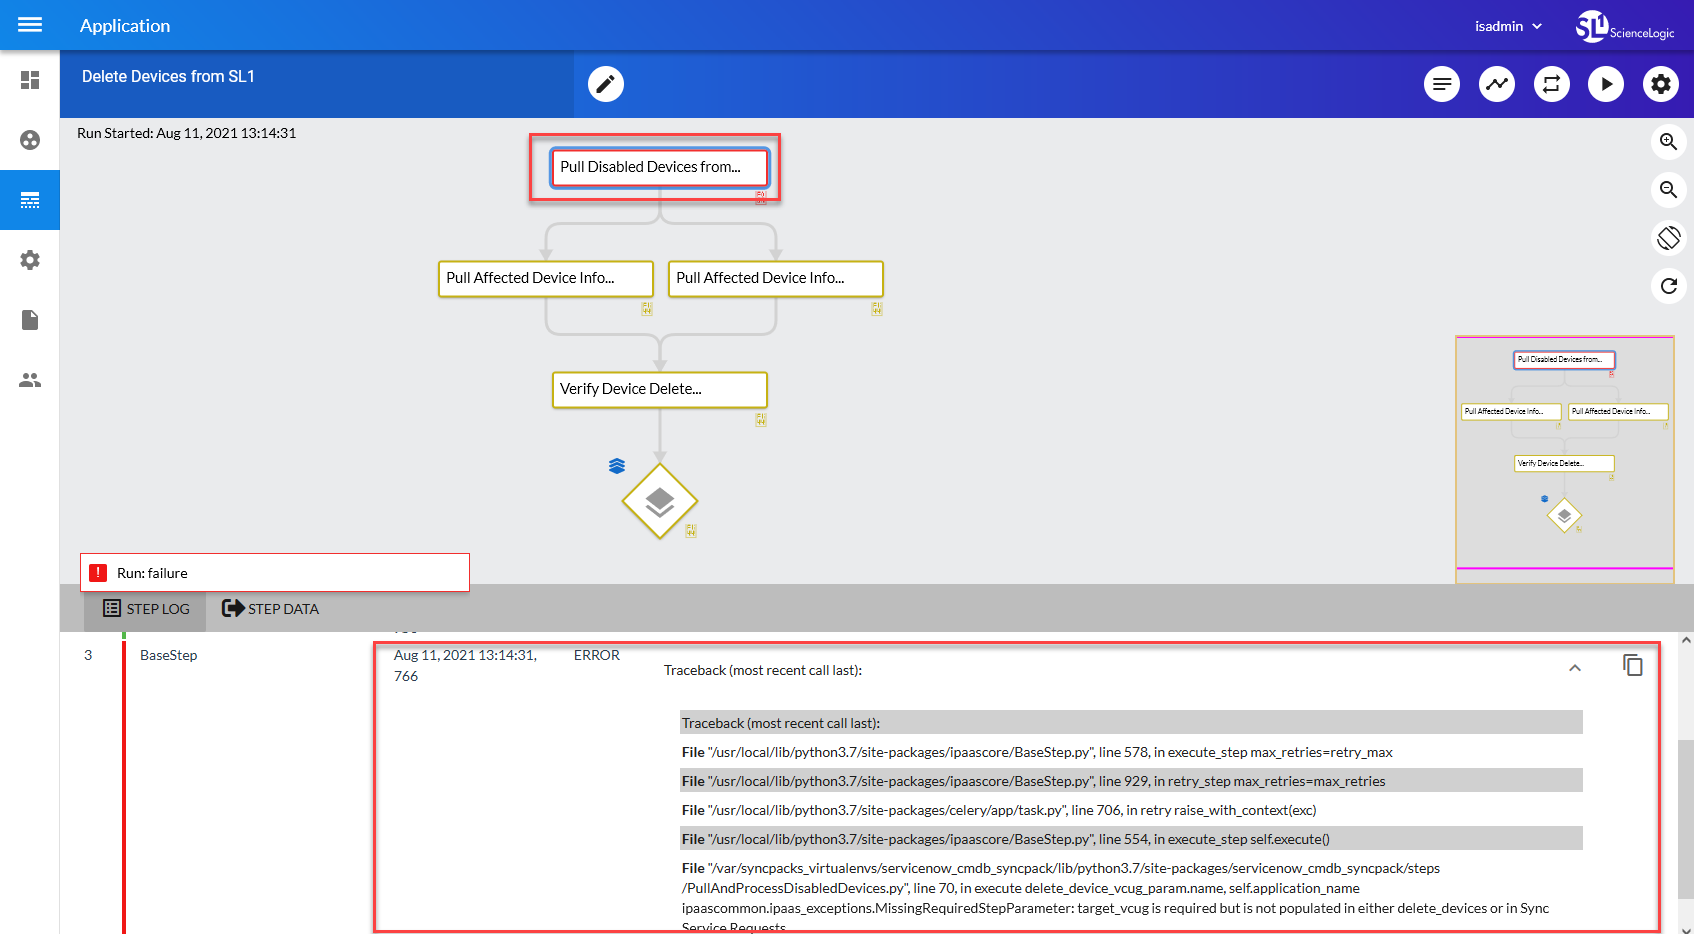
After running the application in Debug Mode, review the step logs in the PowerFlow user interface to see detailed debug output for each step in the application. This information is especially helpful when trying to understand why an application or step failed:
You can also run an application in debug using curl via SSH:
-
SSH to the PowerFlow instance.
-
Run the following command:
curl -v -k -u isadmin:em7admin -X POST "https://<your_hostname>/api/v1/applications/run" -H 'Content-Type: application/json' -H 'cache-control: no-cache' -d '{"name": "interface_sync_sciencelogic_to_servicenow","params": {"loglevel": 10}}'
Troubleshooting Clustering and Node Failover
This section covers how to troubleshoot a clustered environment and what to expect with a node failover in a PowerFlow system.
After a failover, Couchbase or the PowerFlow user interface are not available
In this situation, a failover occurred in a three-node cluster. Docker was stopped on the Swarm Leader, and another node in the cluster took the Swarm Leader role. After that, you could not access the PowerFlow user interface, and Couchbase was not running.
The reason that the master of Couchbase on that node was not running was that the node was down. The other two Couchbase systems in the cluster were still running, and you should have been able to access the system through the PowerFlow user interface.
If you could not access the PowerFlow user interface, check to make sure you have a load balancer in front of the cluster. Each instance of Couchbase is "pinned" to a specific node so that it can persist data to that local node. The locally persisted data is then replicated between all three Couchbase nodes.
I get a 502 error when I try to log in using the load balancer IP address
Make sure that the HOST_ADDRESS in the /etc/iservices/isconfig.yml file is pointing to that load balancer. If needed, update that value and re-deploy the PowerFlow system.
You should only use the load balancer IP when you want to log into or otherwise access the system.
Also, you should make sure that your contentapi service is properly configured in the docker-compose.yml file. If this service only specifies one of the Couchbase nodes, such as db_host: couchbase.isnet,localhost, you will not get API responses when that Couchbase node is down.
To properly configure the contentapi service in the docker-compose.yml file, use the following example as a template:
db_host:couchbase.isnet,couchbase-worker.isnet,couchbase-worker2.isnet
The healthcheck and autoheal actions in the powerflowcontrol(pfctl) command-line utility will report problems like this to you, and it will also creates relevant templates. The healthcheck and autoheal ations are supported in PowerFlow 2.0.0 and later. For more information, see Using the powerflowcontrol (pfctl) Command-line Utility.
After a node goes down, the SyncPacks page does not display the expected content
In this situation, the node that went down was the node that was hosting the PyPi server, which is not an operationally critical service. The PyPi server is only used to install new Synchronization PowerPacks onto the system.
After a node goes down, I cannot access the db port for that instance of Couchbase :8091 directly
You will not be able to access the db port for that instance of couchbase :8091 directly. Because that node is down, the Couchbase server is not available to provide the Administrator IP. By default, only the user interface for that node is exposed, but you can expose the admin user interfaces on the other systems as well, and those admin user interfaces will be available even when the primary node goes down.
If you fail over one of the other nodes instead of that master, you will see that the Couchbase user interface stays up, because the node hosting that Couchbase instance is still up).
Couchbase fails to properly initialize or keeps trying to initialize
Couchbase might fail to properly initialize or keep trying to initialize if the Couchbase database is in a highly virtualized environment, where the CPUs are over-provisioned, and high CPU ready wait and costop times are occurring. In this situation, you will not be able to access the Couchbase user interface at https://<IP of PowerFlow>:8091.
To address this issue, make sure that the VMware environment is optimized and ready waits are minimized. For more information about CPU over-allocation in VMware, see Maximizing VMware Performance and CPU Utilization.
The system will not be as optimal as possible due to high ready wait times at the vCPU level. As a result, you will need to retry to initialize Couchbase on the first startup. Also, rebalances might need to be done multiple times to eventually succeed in over-provisioned environments.
Frequently Asked Questions
This section contains a set of frequently asked questions (FAQs) and the answers to address those situations:
For additional troubleshooting information specific to multi-tenant environments, see Common Problems, Symptoms, and Solutions in the PowerFlow for Multi-tenant Environments appendix.
What is the first thing I should do when I have an issue with PowerFlow?
Ensure that all the services are up and running by running the following command:
docker service ls
If any service is not running, such as display a 0/1, run the following commands:
docker service ps <service not running>
docker service logs <service not running>
Can the steprunner_syncpacks service can be limited to just workers?
The syncpack_steprunners are responsible for keeping all Synchronization PowerPack virtual environments in sync on all nodes. As you install or upgrade Synchronization PowerPacks, these steprunners consistently maintain the virtual environment changes throughout the cluster without network storage. Disabling these steprunners will not affect the system operationally unless you need to update, modify, or install new Synchronization PowerPacks onto the nodes of a system.
What is the difference between the steprunner_syncpacks and the steprunner services?
The syncpack_steprunners accept no other tasks, beside create and update tasks for the virtual environment.
What is the minimal image required for workers?
At a minimum, worker nodes that will only be used to process tasks will need just the worker image.
If the GUI server is constrained to use only the manager nodes, do the worker nodes need to have their isconfig.yml file updated with the correct HOST value?
The isconfig.yml file is applied to all nodes in the cluster when the stack is deployed. The config used is created from the config on the system where you actually run Docker stack deploy and applied to all other nodes. In other words, only the managers from which you are deploying the stack need to have the isconfig.yml value correct.
Can I unload unwanted images from a worker node?
Removing unwanted images is part of typical Docker operations, and it uses the following command: docker image rm <image name>
For more information, see https://docs.docker.com/engine/reference/commandline/image_rm/.
If I dedicated workers to one SL1 stack, how are jobs configured to run only on those workers?
You create a worker service with the user_queues variable set, with a list of queues that you want that worker to process only. The queues are auto-created. That worker service can also be pinned to run on specific nodes. You can tell an integration to run on a specific queue at runtime, on a schedule, or in the application configuration. The queue will be processed by the workers that you previously defined. If no workers are listening to the queue, the task will not process.
Approximately how much data is sent between distributed PowerFlow nodes?
The amount of data sent between distributed PowerFlow nodes largely depends on the applications that are currently running, the size of the syncs for those applications, and how much of the cache those syncs use. In general, only configuration files, cache, and some logs are stored or replicated between database nodes, while the queue service mirrors messages between its nodes as well. As a result, not a lot of information is being replicating at any given time, as only necessary cluster and vital data are replicated.
Why can't I find a Synchronization PowerPack on the SyncPacks page?
If you have uploaded a Synchronization PowerPack, but you cannot see it on the SyncPack page, make sure that the SyncPack filter is showing all SyncPacks. By default, the SyncPacks page will only show SyncPacks that are activated. An activated Synchronization PowerPack has been installed and is ready to be used.
Click the Filter icon (![]() ) at the top right of the SyncPacks page and enable the Toggle Inactive SyncPack toggle to show all of theSynchronization PowerPacks.
) at the top right of the SyncPacks page and enable the Toggle Inactive SyncPack toggle to show all of theSynchronization PowerPacks.
Why can't I see or upload a Synchronization PowerPack?
If your PowerFlow system uses self-signed certificates, you will need to manually accept the certificate before you can upload Synchronization PowerPacks.
Go to https://<IP address of PowerFlow>:3141/isadmin, accept the certificate, and then exit out of the tab. When you log into PowerFlow again, you will be able to upload Synchronization PowerPacks.
Also, if a Synchronization PowerPack failed to load or activate, a red exclamation mark icon (![]() ) appears next to that Synchronization PowerPack on the SyncPacks page. Click the red icon (
) appears next to that Synchronization PowerPack on the SyncPacks page. Click the red icon (![]() ) to view errors logs related to the loading or activation process.
) to view errors logs related to the loading or activation process.
The most common error that occurs when installing a Synchronization PowerPack is that the Synchronization PowerPack dependencies are not installed. Review the "System Requirements" section of the release notes for that Synchronization PowerPack to ensure that you have installed all of the required applications for that Synchronization PowerPack.
Why do I get a "Connection error" message when I try to install the System Utils Synchronization PowerPack?
In this situation, you get the following error message:
Connection error, please verify that the steprunners can request data from pypiserver and that the syncpack system_utils_syncpack==1.0.1 uploaded to the local pypiserver is a valid syncpack.
To address this issue, review the following checklist
- Review the logs for the "Activate & Install SyncPacks" PowerFlow application for relevant error details.
- Make sure that the cluster nodes are not offline.
- If the error is related to the "Activate & Install SyncPacks" application, make sure that the Synchronization PowerPack that you uploaded to pypi does not have extra characters at the end, such as a "(1)" or anything else that does not follow the correct name syntax.
- If the failure is related to the "Activate & Install SyncPacks" application, then the environment might be preventing the connection, such as the no_proxy setting in the docker-compose.yml file.
- Make sure that the pypiserver has a pypiserver.isnet alias in the docker-compose.yml file.
- Validate all of the required settings in the docker-compose.yml file, including no_proxy and Couchbase database settings.
The following is an example of a portion of a docker-compose.yml file for this issue:
syncpacks_steprunner:
.... ...
environment:
    ... ....
   db_host: couchbase.isnet,couchbase-worker.isnet,couchbase-worker2.isnet
   http_proxy: http://is.cms.com:8080/
   https_proxy: https://is.cms.com:8080/
   no_proxy: .isnet, 172.1.1.1/16
How can I optimize workers, queues, and tasks?
The PowerFlow system uses Celery to spawn and manage worker processes and queues. You can define environment variables to optimize these worker processes.
You can use the following environment variables to optimize worker processes:
- task_soft_time_limit. Enforces global timeout for all tasks in the PowerFlow system. If a task exceeds the specified timeout limit, the PowerFlow system terminates the task so that the next task in the queue can be processed. Possible values are:
- Integer that specifies the time in seconds.
- Default value is "3600" (1 hour).
- optimization. Determines how tasks are distributed to worker processes. Possible values are:
- -Ofair. Celery distributes a task only to the worker process that is available for work.
- " " (double-quotation mark, space, double-quotation mark). Distributes and queues all tasks to all available workers. Although this increases performance, tasks in queues might be delayed waiting for long-running tasks to complete.
- Default value is -Ofair.
- task_acks_late. Specifies that if a worker process crashes while executing a task, Celery will redistribute the task to another worker process. Possible values are:
- True. Enables the environment variable.
- False. disabled the environment variable.
- Default value is "False"
NOTE: Because many applications run at regular intervals or are scheduled, the PowerFlow system re-executes tasks even if the task_acks_late environment variable is disabled. in the event of a worker crash, if you want to ensure that tasks are completed, you can enable the task_acks_late variable. However, be aware that if tasks are not idempotent, the task_acks_late variable can cause unpredictable results.
To define these environment variables:
- Either go to the console of the PowerFlow system or use SSH to access the server.
- Log in as isadmin with the appropriate password.
- Use a text editor like vi to edit the file /opt/iservices/scripts/docker-compose.yml.
- You can define the environment variables for one or more worker processes. The docker-compose.yml file contains definitions for worker processes. For example, you might see something like this:
services:
steprunner:
image: sciencelogic/is-worker:latest
environment:
LOGLEVEL: 10
celery_log_level: 10
logdir: /var/log/iservices
broker_url: 'pyamqp://guest@rabbit//'
result_backend: 'redis://redis:6379/0'
db_host: 'couchbase,localhost'
secrets:
- is_pass
- encryption_key
deploy:
replicas: 2
networks:
- isnet
volumes:
- "/var/log/iservices:/var/log/iservices"
- "statedb:/var/run/celery/states/"
steprunner_1:
image: : sciencelogic/is-worker:latest
environment:
LOGLEVEL: 10
celery_log_level: 10
task_soft_time_limit: 30
optimization: ""
task_acks_late: 'False'
logdir: /var/log/iservices
broker_url: 'pyamqp://guest@rabbit//'
result_backend: 'redis://redis:6379/0'
db_host: 'couchbase,localhost'
secrets:
- is_pass
- encryption_key
deploy:
replicas: 2
networks:
- isnet
volumes:
- "/var/log/iservices:/var/log/iservices"
- "statedb:/var/run/celery/states/"
steprunner_2:
image: : sciencelogic/is-worker:latest
environment:
LOGLEVEL: 10
celery_log_level: 10
task_soft_time_limit: 30
optimization: '-Ofair'
task_acks_late: 'False'
logdir: /var/log/iservices
broker_url: 'pyamqp://guest@rabbit//'
result_backend: 'redis://redis:6379/0'
db_host: 'couchbase,localhost'
secrets:
- is_pass
- encryption_key
deploy:
replicas: 2
networks:
- isnet
volumes:
- "/var/log/iservices:/var/log/iservices"
- "statedb:/var/run/celery/states/"
-
The services with names that start with "steprunner" are the workers for the PowerFlow system. To define the optimization variables, enter the variables and values in the definition of the worker, under the environment section. See the example in step #3 to see the syntax for environment variables.
-
After you have updated the docker-compose file, you can update and re-deploy the PowerFlow system to pick up your changes to the file. To do this, execute the following command:
docker stack deploy -c /opt/iservices/scripts/docker-compose.yml iservices
Why do I get a "Connection refused" error when trying to communicate with Couchbase?
If you get a "Connection refused to Couchbase:8091" error when you are trying to communicate with Couchbase, check the firewalld service by running the following command:
systemctl status firewalld
Firewalld is responsible for all of the internal communications between the various Docker services on the Docker Swarm. If firewalld is not active, there will be no communications between the services, and you might see an error like "Connection refused to Couchbase:8091".
To start the firewalld service, run the following command:
systemctl start firewalld
Why do I have client-side timeouts when communicating with Couchbase?
If you are running an intensive application, or if you are running in Debug Mode, you might see the following stack trace error:
(generated, catch TimeoutError): <RC=0x17[Client-Side timeout exceeded for operation. Inspect network conditions or increase the timeout], HTTP Request failed. Examine 'objextra' for full result, Results=1, C Source=(src/http.c,144), OBJ=ViewResult<rc=0x17[Client-Side timeout exceeded for operation. Inspect network conditions or increase the timeout], value=None, http_status=0, tracing_context=0, tracing_output=None>, Tracing Output={":nokey:0": null}>
This error occurs when there is too much load going into the Couchbase database. If you're running with Debug Mode, that mode creates a large number of extra log messages in the database, which can contributeto this error.
To work around this issue, increase the timeout being used by setting the db_host environment variable in the steprunner service:
db_host: 'couchbase.isnet,localhost?n1ql_timeout=100000000.00'
If you increase the timeout, the timeout errors should go away.
Increasing the timeout might not always be the correct action. If you are using an especially large system, you might want to allocate additional resources to the Couchbase services, including more memory for indexing and search. If you are encountering timeouts in a non-temporary fashion, such as only running Debug Mode for an application to determine what went wrong, you might want to add more resources instead of increasing the timeout.
What should I do if the Couchbase disk is full, the indexer is failing, and the database is unusable?
If the Couchbase database stops unexpectedly and the disk is full:
- Check the size of the /var/data/couchbase/lib/couchbase/data/@2i directory.
- If the contents of this directory are causing the disk to fill up, stop the couchbase service and remove the @2i directory.
- Restart Couchbase to return the PowerFlow system to normal operations.
Use the following optimizations to ensure that the indexer directory @2i does not overuse disk space:
- When running PowerFlow in production, do not run applications in Debug Mode by default.
- Remove any #primary index that exists in content or logs. Primary indexes are useful for troubleshooting, but they should not be used in production. In prior versions of PowerFlow, the primary index was automatically created, which caused no problems with typical workloads. However, with large workloads, the primary index adds unnecessary overhead that might impact the system. ScienceLogic recommends removing primary indexes that exist on systems in production.
- Qualys scans running against a whole cluster at once have been known to affect the performance of the database, and these scans have caused crashes resulting in index corruption in the past. If you plan on running Qualys scans on the PowerFlow system, run them at an off-peak time, and only on one node of the cluster.
-
Under heavy workloads, the default auto-compaction settings might occur too frequently, causing issues due to heavy operations and compaction activities running at the same time. To reduce this possibility, select a specific day and time of the week for the database compaction to occur. Ideally compaction is configured to occur during a time of lower workloads, and not at peak. You can configure these settings in the Couchbase user interface (Settings > Auto-Compaction), or through the API: Configure Auto-Compaction with the CLI.
Needing to change auto-compaction defaults might be an early indication that the PowerFlow system needs additional resources with more load. For more information, see the following list of workload considerations.
Sizing the Couchbase database for workload considerations:
- indexer memory. Under heavy workloads, the indexer might be constrained and causing a bottleneck in the system due to its default 500 MB memory allocation. In real-time you can monitor the index memory percentage used through the Couchbase Administrator user interface (https://<IP of PowerFlow>:8091). If memory is constantly at 90% or greater, the system might benefit from an increase in memory allocation to the indexer service (Settings > Service Memory Quotas).
- Make sure that VMotion is disabled in VMware, and make sure that PowerFlow nodes will not be VMotioned while running.
- db disk size: Depending on the workload being performed and how much data is being saved into the system via logs, you might need to increase the database disk space. In general, you can expect the database to use at most twice the size of a bucket fully compacted. For more information, see Indexes size and compaction. The disk size available to the Couchbase system should be sufficient for whatever size workloads are expected.
What causes a Task Soft Timeout?
The following error might occur when you see a long-running task fail:
raise SoftTimeLimitExceeded() SoftTimeLimitExceeded: SoftTimeLimitExceeded()
This error message means that the default timeout for a task on your PowerFlow system is too low. By default the task timeout, which is set by the environment variable task_soft_time_limit, is set to 3600 seconds (1 hour).
If you intend to have tasks executing for longer than an hour at a time, you can increase this setting by changing the task_soft_time_limit environment variable in your steprunners. Note that the value is set in seconds.
How do I address an "Error when connecting to DB Host" message when access is denied to user "root"?
In this situation, you get an error similar to the following:
Error when connecting to DB Host... (1045, "Access denied for user 'root'@'10.86.21.224' (using password: NO)"
This issue occurs when the encryption_key file from one PowerFlow system does not match the encryption_key file on another system, such as when you take data from a production PowerFlow system to a test PowerFlow system.
The encryption key must be identical between two PowerFlow systems if you plan to migrate from one to another. The encryption key must be identical between High Availability or Disaster Recovery systems as well.
To address this issue:
-
Copy the encryption_key file from the /etc/iservices/ folder on the production system to the /etc/iservices/ folder on the test system.
-
Re-upload all applications and configurations from the production system to the test system.
-
Remove and redeploy the stack on the test PowerFlow after copying the key by running the following command on the test system:
docker stack deploy -c /opt/iservices/scripts/docker-compose.yml iservices
How do I remove a schedule that does not have a name?
If you encounter a schedule in PowerFlow that was created without a name, PowerFlow cannot update or delete that schedule using the API.
This issue only affects versions of PowerFlow prior to version 1.8.2.
To address this issue, you will need to delete all schedules on PowerFlow, which involves going into Couchbase and deleting a file.
Exercise extreme caution when performing this procedure, as deleting the wrong file will cause your PowerFlow instance to stop working.
To delete all schedules, including a schedule without a name:
- Log in to the Couchbase management interface at https://<localhost>:8091.
- Navigate to the tab.
-
Click the Documents link on the content bucket:
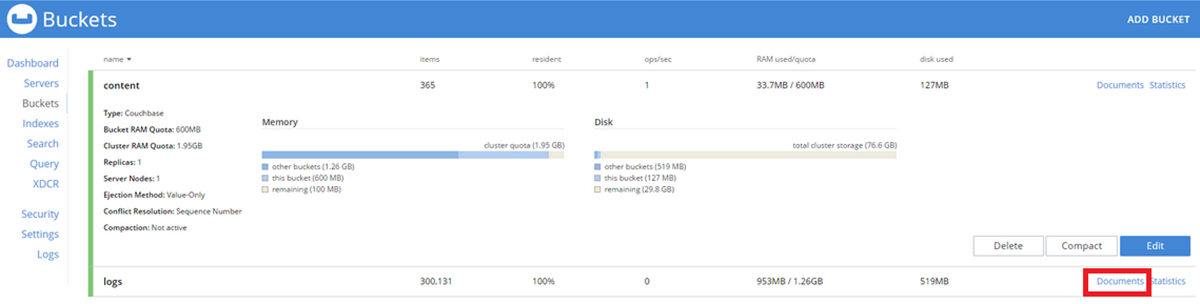

- On the content > documents page, extend the results to show 100 records per page
-
Search for "schedule". You will see a file similar to the following example:
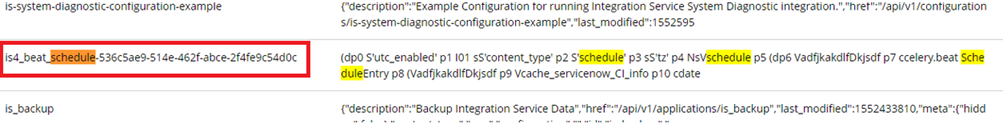

- Delete the file.
Deleting this file deletes all schedules on your PowerFlow instance.
How do I identify and fix a deadlocked state?
If PowerFlow appears to be running, but it is not processing any new applications or tasks, then PowerFlow could be in a deadlocked state.
A deadlocked state occurs when one or more applications include steps that are either ordered improperly or that contain syntax errors. In this situation, tasks are waiting on subsequent tasks to finish executing, but the worker pool is exhausted. As a result, PowerFlow is not able to execute those subsequent tasks.
To identify a deadlocked state with a PowerFlow system:
- Navigate to the Celery Flower interface for PowerFlow by typing the URL or IP address for your PowerFlow and adding /flower/dashboard at the end of the URL, such as https://192.0.2.0/flower/dashboard.
-
Click the tab for Flower. A list of workers appears:

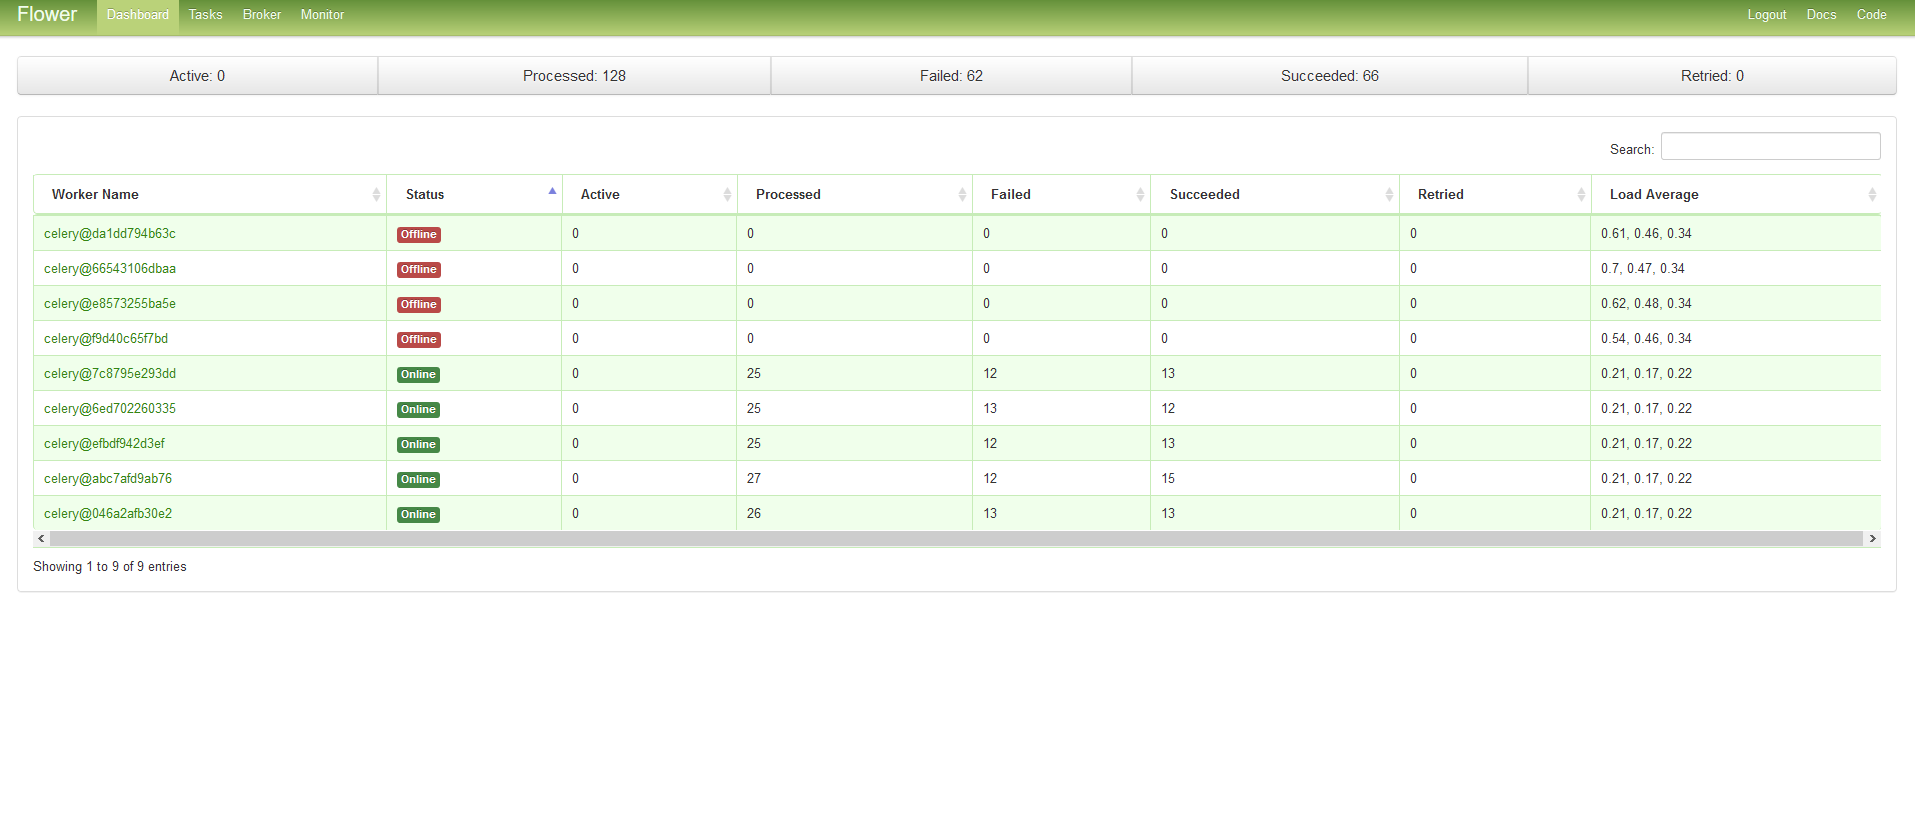
- Review the number of active or running tasks for all workers. If all workers have the maximum number of tasks, and no new tasks are being consumed, then you might have a deadlock state.
To fix a deadlocked state in a PowerFlow system, perform one of the following steps:
-
Go to the console of the PowerFlow system or use SSH to access the server.
-
Log in as isadmin with the appropriate password.
-
Increase the number of workers by either:
A. Running the following command at the shell prompt:
docker service scale iservices_steprunner=x
where x is the number of workers.
B. Using a text editor like vi to edit the file /opt/iservices/scripts/docker-compose.yml. In the environment: section at the top of the file, add the following:
worker_threads: number_greater_than_3
where number_greater_than_3 is an integer greater than 3.
-
After you have updated the docker-compose file, you can update and re-deploy the PowerFlow system to pick up the changes in the docker-compose.yml file To do this, execute the following at the shell prompt:
docker stack deploy -c /opt/iservices/scripts/docker-compose.yml iservicesThe PowerFlow system should now include additional workers.
-
Navigate to the Celery Flower interface for PowerFlow by typing the URL or IP address for PowerFlow and adding /flower/dashboard at the end of the URL, such as https://192.0.2.0/flower/dashboard.
-
Click the tab for Flower. A list of workers appears:
-
Review the number of active or running tasks for all workers.
How can I point the "latest" container to my latest available images for PowerFlow?
If you force-upgraded an RPM on top of an existing PowerFlow RPM of the same version (such as version 1.8.0 force-installed on 1.8.0), and you have custom worker types pointing to specific images, the latest tag gets created incorrectly.
To address this issue:
- Modify the docker-compose.yml file and update all SL1 images to point to the correct version that you expect to be latest.
- Change any custom worker or custom services using SL1 containers to point to: latest.
- Re-install the RPM of the same version via force.
Why does the "latest" tag not exist after the initial ISO installation?
This situation only affects users with custom services that point to the latest tag. To work around this issue, run the tag latest script manually after running the ./pull_start_iservices.sh command:
python /opt/iservices/scripts/system_updates/tag_latest.py /opt/iservices/scripts/docker-compose.yml
How do I address permissions errors with Synchronization PowerPack virtual environments?
This situation is relevant only for upgrades to PowerFlow version 2.3.0. Permission errors might occur if you restarted Docker before the stack was redeployed, using the old stack services definition. In this situation:
-
The permission that was properly set during the RPM installation for PowerFlow version 2.3.0 was reset to root. This change was not expected for PowerFlow version 2.3.0, because containers were rootless starting with version 2.3.0 for more security.
-
The PowerFlow version 2.3.0 Docker containers (rootless users) cannot recreate the syncpacks virtual environments, because containers in versions of PowerFlow before 2.3.0 used root as user.
To address this issue, you need to force the steprunners to recreate the syncpacks virtual environments:
-
Run the following commands:
pfctl --host pf-node-ip '<username>:<password>' node-action --action modify_iservices_volumes_owner
docker service update --force iservices_syncpacks_steprunner
-
Verify that the syncpacks virtual environments owner is not root and that the environments were recently recreated:
sudo ls -la /var/lib/docker/volumes/iservices_syncpacks_virtualenvs/_data/sudo ls -la /var/lib/docker/volumes/iservices_syncpacks_virtualenvs/_data/
-
If the syncpacks virtual environments were not recreated, perform steps 4-5.
Use caution while performing these next two steps.
-
Remove the syncpacks virtualenvironments volume on every node:
sudo rm -r /var/lib/docker/volumes/iservices_syncpacks_virtualenvs/_data/*
-
Restart the syncpacks_steprunners service using either of the following actions:
docker service update --force iservices_syncpacks_steprunner
or
docker service rm iservices_syncpacks_steprunner
docker stack deploy -c /opt/iservices/scripts/docker-compose.yml --resolve-image never iservices
How do I restore an offline backup of my PowerFlow system?
To completely restore a PowerFlow system from an existing backup using a fresh PowerFlow installation, copy the following files and make sure that they match what existed on the previous PowerFlow system:
- /etc/iservices/encryption_key. This file ensures that the restored data can be decrypted as it was on the previous system.
- /etc/iservices/is_pass. Use this file if you wish to re-use the same password from the old system.
- /etc/iservices/isconfig.yml. This file contains authentication related settings, if used, and it sets the hostname to the load balancer, if it's a clustered environment.
- /opt/iservices/scripts/docker-compose-override.yml. This file contains your PowerFlow container versions and environment settings.
- /opt/iservices/scripts/docker-compose.yml. This file contains your PowerFlow container versions and environment settings.
The swarm cluster should have the same amount of nodes and node labels applied as in the previous system to ensure identically matching Docker environments. All nodes in the cluster must have the PowerFlow images in your docker-compose.yml file loaded and available (use ).
After the PowerFlow system is started, you can run the "PowerFlow Restore" application to restore all previously used applications, cache, and config data. For more information, see Backing up Data.
If the workers/api are now running on completely new nodes after the restore, you will have to re-install the Synchronization PowerPacks from the PowerFlow user interface to install the environments on the new nodes. Applications from those Synchronization PowerPacks will already be configured with the restored settings.
This process is not considered a "Passive Disaster Recovery failover scenario. Active/Passive relationships between PowerFlow clusters is not supported.
What do I do if I get a Code 500 Error when I try to access the PowerFlow user interface?
To address this issue:
-
SSH to your PowerFlow instance.
-
Check your Docker services with the following command:
docker service ls
-
Ensure that all of your services are up and running:


- If all of your services are up and running, but you are still getting Code 500 Errors, navigate to the Couchbase management portal of your PowerFlow server at port 8091 over HTTPS.
-
In the Couchbase portal, navigate to the tab and verify that all of your indexes are in a ready state:


-
Wait until all status entries are ready and all build progress entries are 100%, and then navigate back to your PowerFlow user interface.
-
Verify that the Code 500 Error no longer exists.
-
If an index is stuck in a non-ready state, find the index name, copy that value and execute the following command in the Couchbase Query Editor:
BUILD INDEX ON content(INDEX_NAME_HERE)
What should I do if I get a 500 Error?
A 500 Internal Server Error will always have some kind of stack trace in the contentapi logs. Run the following command to find the cause of the 500 Error:
docker service logs -t iservices_contentapi
A 502 or 504 Error might mean that the user interface cannot reach an API container on a node, or the API container cannot reach a database node in the cluster. To address this issue:
-
For a cluster, make sure the cluster is healthy, and all database nodes are balanced.
-
For a cluster, make sure that the firewall ports are open on all nodes.
-
Run the following commands to check the logs for 502 or 504 Errors:
docker service logs -t iservices_gui
docker service logs -t iservices_contentapi
The logs will specify which container caused a timeout when trying to reach that container.
What are some common examples of using the iscli tool?
The PowerFlow system includes a command line utility called the iscli tool. You can use the iscli tool to upload components such as steps, configurations, and applications from the local file system onto PowerFlow.
For more information on how to use this tool, SSH to your PowerFlow instance and type the following command:
iscli --help
You can use the iscli tool to add drop files or additional content onto the PowerFlow. You can also use the utility to upload content to a remote host. Examples of common syntax include the following:
iscli -usf <STEP_FILE.PY> -U isadmin -p em7admin
iscli -uaf <APPLICATION_FILE.JSON> -U isadmin -p em7admin
iscli -ucf <CONFIG_FILE.JSON> -U isadmin -p em7admin
iscli -usf <STEP_FILE.PY> -U isadmin -p em7admin -H <IS_HOST>
The password for the iscli tool should be the same password as the PowerFlow Administrator (isadmin) user password. For more information, see Changing the PowerFlow Password.
How do I view a specific run of an application in PowerFlow?
To view the log results of a previous execution or run of an application in the PowerFlow:
- Use Postman or another API tool to locate the appID and the name of the application.
-
In the PowerFlow, update the PowerFlow URL with the appID, in the following format:
https://<PowerFlow>/integrations/<application_name>?runid=<App_ID>
For example:
https://<PowerFlow>/integrations/CreateServiceNowCI?runid=isapp-d8d1afad-74f8-42d4-b3ed-4a2ebcaef751
Why am I getting an "ordinal not in range" step error?
If you get an "ordinal not in range" error, check your CI Class Mappings to make sure the mappings do not contain international or "special" characters.
For example:
AWS | Availability Zone - São Paulo
If you find a class mapping with a special character like the above example, remove the class mapping, or rename the device class in SL1 to not include the special characters. Then you can sync the CI classes again.
How do I clear a backlog of Celery tasks in Flower?
To clear a backlog of Celery tasks:
-
docker exec into a bash shell in a worker process. For example:
docker exec -it e448db31aaec /bin/bash
where e448db31aaec is the container ID of the is-worker process on your system
-
Run the Python interpreter.
-
Run the following commands:
from ipaascommon.celeryapp import app
app.control.purge()
Why does traffic from specific subnets not get a response from PowerFlow?
In this situation, you can see traffic going into the host and into the Docker network, the traffic is not being routed back out. Responses were lost in the Docker ingress network, and the client timed out.
To address this issue:
-
Remove the Docker service by running the following command:
docker stack rm iservices
-
Remove the default ingress network:
docker network rm ingress
-
Add a newly addressed ingress network:
docker network create --driver overlay --ingress --subnet=172.16.0.0/16 --gateway=172.16.0.1 ingress
-
Redeploy PowerFlow:
docker stack deploy -c docker-compose.yml iservices
If the containers have an exposed port and you find the following error in the logs, you might need to remove /var/lib/docker/network/files/local-kv.db:
error="failed to detect service binding for container iservices_gui…"
To address this issue:
-
Remove the Docker service:
docker stack rm iservices
-
Remove the .db file:
rm /var/lib/docker/network/files/local-kv.db
-
Restart the docker daemon:
systemctl restart docker
-
Redeploy PowerFlow:
docker stack deploy -c docker-compose.yml iservices
What should I do if the number of tasks listed in the dashboards is not accurate?
To address an issue where the number of tasks listed in the PowerFlow and Flower dashboards do not match the Task List, you can set the FLOWER_MAX_TASKS environment variable in the PowerFlow docker-compose file to 20,000 tasks or higher. (Case: 00194044. JIRA ID: EM-45576)
For example:
flower:
environment:
... ....
worker_type: flower
FLOWER_MAX_TASKS: 20000