This appendix describes how to generate reports that are embedded in SL1 that include information about:
- Devices
- Device Interfaces
- System Processes
- Windows Services
- Hardware Components
- Installed Software
Use the following menu options to navigate the SL1 user interface:
- To view a pop-out list of menu options, click the menu icon (
).
- To view a page containing all the menu options, click the Advanced menu icon (
).
This
Generating a Report for Multiple Devices
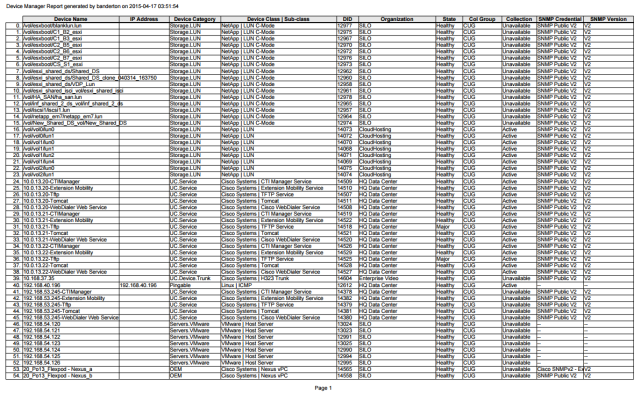
From the Device Manager page (Devices > Device Manager), you can generate a report on all devices in SL1 or on multiple devices in SL1. The report will contain all the information displayed in the Device Manager page.
To generate a report about all or multiple devices:
-
In SL1, go to the Device Manager page (Devices > Device Manager):
-
To filter the list of devices, use the "search as you type" fields at the top of each column. You can filter the list of devices by one or more column values. Only the devices displayed in the Device Manager page will appear in the report.
- Click the button.
- When prompted, specify the output format for the report and if you want to save the report.
-
Click . The report displays:
Generating a Report for a Single Device
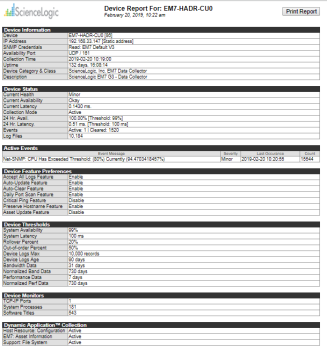
On the Device Investigator page for a specific device, you can generate a detailed report on that device. You can specify the information to include in the report and the format that SL1 will use to generate the report, including HTML, PDF, XLS, and more.
- On the Device Investigator page, click the button in the top navigation bar. The Device Report modal page appears.
- In the Type drop-down, select the type of report you want to generate. Your options include:
- . Includes information about device status, status of all device policies, status of all monitors, status of hardware components, status of all thresholds defined for the device, a list of all active events associated with the device, and information about the last collection time and last entry to the device log.
- . Includes information about device status, status of all monitors, status of hardware components, status of all thresholds defined for the device, and information about the last collection time and last entry to the device log.
- . Includes status of all monitors, status of all thresholds defined for the device, and information about the last collection time and last entry to the device log.
- . Includes contact information for the device's organization and contact information for all vendors and warranty or support accounts.
- . Includes overview of hardware components for the device.
- . Includes all notes created in the Notepad Editor page.
- . Displays a list of software installed on the device.
- . Displays a list of all processes running on the device.
- . Includes information about network ports and network configuration.
- . Includes a list of all active events associated with the device.
- . Includes information about device status, status of all monitors, status of all Dynamic Applications associated with the device, status of all thresholds defined for the device, and a list of all active events associated with the device.
- In the Format drop-down, select the format for the report. Your options include:
- HTML. Create the report as an HTML document.
- PDF. Create the report as a PDF document.
- DOC. Create the report as a Microsoft Word document.
- XLS. Create the report as Microsoft Excel spreadsheet.
- CSV. Create the report using comma-separated values.
- Click to generate the report.
Generating a Report for a Single Device in the Classic SL1 User Interface
From the Device Investigator page of the SL1 user interface or the Device Manager page (Devices > Device Manager), you can generate a detailed report on a single device. You can specify the information to include in the report and the format in which the report will be generated, such as PDF, HTML, XLSX, ODS, or CSV.
To generate a detailed report on a single device:
-
If you are on the Devices page, click the device name to open theDevice Investigator page for that device. Click the button. The Device Report modal page appears.
-
If you are on the Device Manager page, select the printer icon (
 ) for the device for which you want to generate a detailed report. The Report Creator modal page appears.
-
On the modal page, select one of the following to specify the information to include in the device report:
- . Includes information about device status, status of all device policies, status of all monitors, status of hardware components, status of all thresholds defined for the device, a list of all active events associated with the device, and information about the last collection time and last entry to the device log.
- . Includes information about device status, status of all monitors, status of hardware components, status of all thresholds defined for the device, and information about the last collection time and last entry to the device log.
- . Includes status of all monitors, status of all thresholds defined for the device, and information about the last collection time and last entry to the device log.
- . Includes contact information for the device's organization and contact information for all vendors and warranty or support accounts.
- . Includes overview of hardware components for the device.
- . Includes all notes created in the Notepad Editor page.
- . Displays a list of software installed on the device.
- . Displays a list of all processes running on the device.
- . Includes information about network ports and network configuration.
- . Includes a list of all active events associated with the device.
- . Includes information about device status, status of all monitors, status of all Dynamic Applications associated with the device, status of all thresholds defined for the device, and a list of all active events associated with the device.
- Select from the following list of formats in which the report can be generated:
- HTML. Create the report as an HTML document.
- PDF. Create the report as a PDF document.
- DOC. Create the report as a Microsoft Word document.
- XLS. Create the report as Microsoft Excel spreadsheet.
- CSV. Create the report using comma-separated values.
Generating a Report for Multiple Interfaces
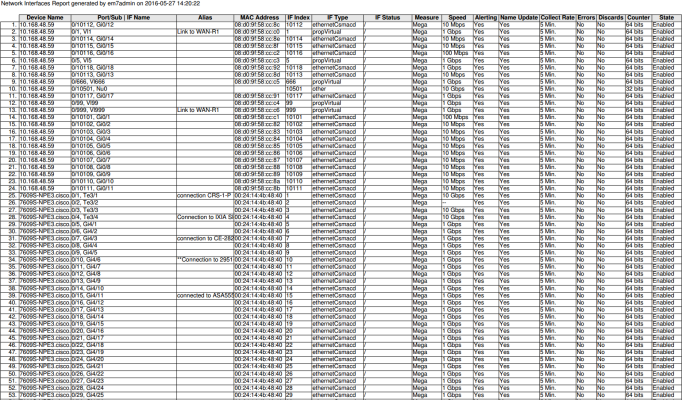
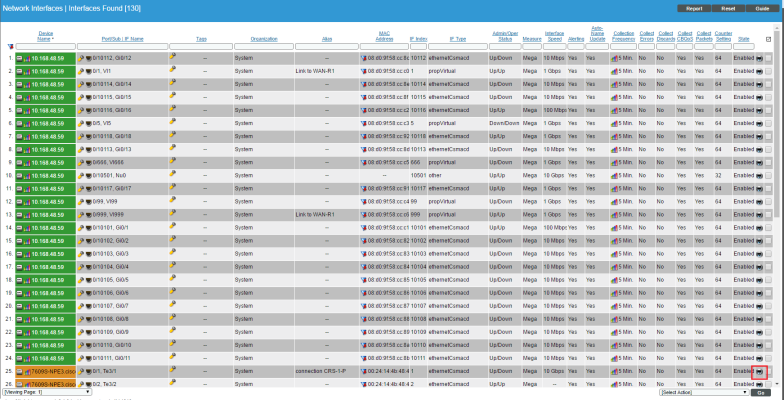
On the Network Interfaces page (Registry > Networks > Interfaces) you can generate a report on all, multiple, or a single interface in SL1. The report will contain all the information displayed in the Network Interfaces page.
To view a report on all or multiple discovered interfaces:
-
Go to the Network Interfaces page (Registry > Networks > Interfaces).
NOTE: If you want to include only certain interfaces in the report, use the "search as you type" fields at the top of each column. You can filter the list by one or more column headings. You can then click the button, and only the interfaces displayed in the Network Interfaces page will appear in the report.
- Select the format in which SL1 will generate the report. Your choices are:
- Acrobat document (.pdf)
- Web page (.html)
- Excel spreadsheet (.xlsx)
- OpenDocument Spreadsheet (.ods)
- Comma-separated values (.csv)
- Click the button. The report will contain all the information displayed in the Network Interfaces page. You can immediately view the report or save it to a file for later viewing.
Generating a Report for a Single Interface
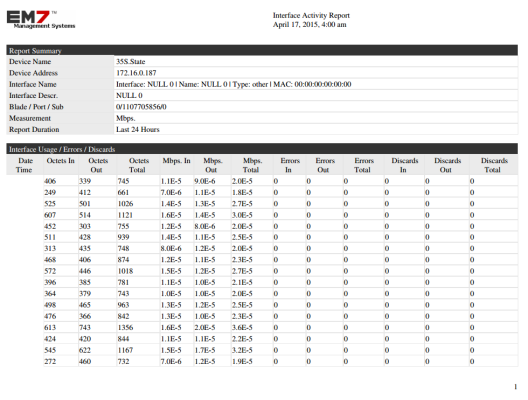
From the Network Interfaces page, you can generate a text-based, bandwidth-usage report for a single interface. You can choose to generate a report on outbound traffic, inbound traffic, all traffic, errors, discards, or all.
To generate the report:
- Go to Network Interfaces (Registry > Networks > Interfaces).
- In the Network Interfaces page, find the interface for which you want to generate a bandwidth report. Click its printer icon (
 ).
).
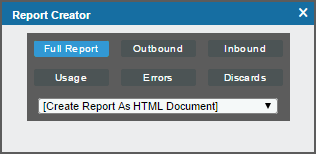
- The Report Creator modal page is displayed.
- Select from the following list of formats to select a format in which to generate the report:
- Create Report as HTML Document
- Create Report as PDF Document
- Create Report as MS Word Document
- Create Report as MS Excel Document
- CSV - Comma Separated Values
- Select one of the following buttons to specify the information to include in the device report:
- . Include all information about outbound data through the interface, inbound data through the interface, combined bandwidth through the interface, errors on the interface, and discards on the interface.
- . Include all information about outbound data through the interface.
- . Include all information about inbound data through the interface.
- . Include all information about inbound data and outbound data through the interface.
- . Include all information about errors on the interface.
- . Include all information about discards on the interface.
- SL1 will generate the report. You can immediately view the report or save it to your local computer.
Generating a Report for Multiple Processes
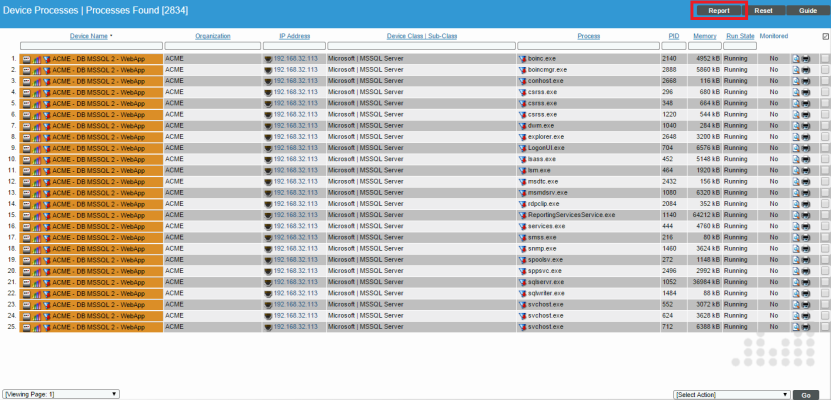
From the Device Processes page (Devices > Processes) you can generate a report on all, multiple, or a single process in SL1.
The report will contain all the columns displayed in the Device Processes page.
To generate a report on all or multiple device processes in SL1:
- Go to the Device Processes page (Devices > Processes).
- In the Device Processes page, select the button.
NOTE: If you want to include only certain processes in the report, use the "search as you type" fields at the top of each column. You can filter the list by one or more column headings. You can then select the button, and only the processes displayed in the Device Processes page will appear in the report.
- The Export current view as a report modal appears.
- In the Export current view as a report modal, you must select the format in which SL1 will generate the report. Your choices are:
- Comma-separated values (.csv)
- Web page (.html)
- OpenDocument Spreadsheet (.ods)
- Excel spreadsheet (.xlsx)
- Acrobat document (.pdf)
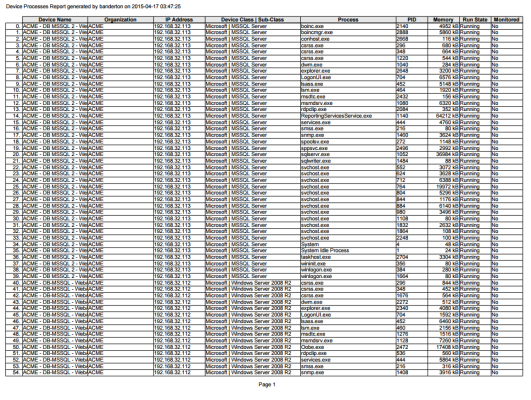
- Click . The report will contain all the information displayed in the Device Processes page. You can immediately view the report or save it to a file for later viewing.
Generating an Exclusion Report for a Process
From the Device Processes page (Devices > Processes), you can generate an exclusion report for a process. SL1 will generate the report in MS Word format. An exclusion report specifies all devices where the selected process is running and all devices where the selected process is not running. SL1 lists only appropriate servers in this report. For example, Linux servers would not appear in a report for Windows-based processes.
A Process Exclusion Report displays the following:
- Name of the process.
- List of all devices in SL1 where the process is running.
- List of all devices in SL1 where the process is not running. SL1 includes only appropriate servers in this report. For example, Solaris servers would not appear in a report for a Windows 2000 patch.
- The last row in the report displays:
- Total number of devices in report.
- Total number of device categories included in the report.
- Total number of device classes included in the report.
- Total number of devices where process is running
- Total number of devices where process is not running.
To generate an exclusion report about a process:
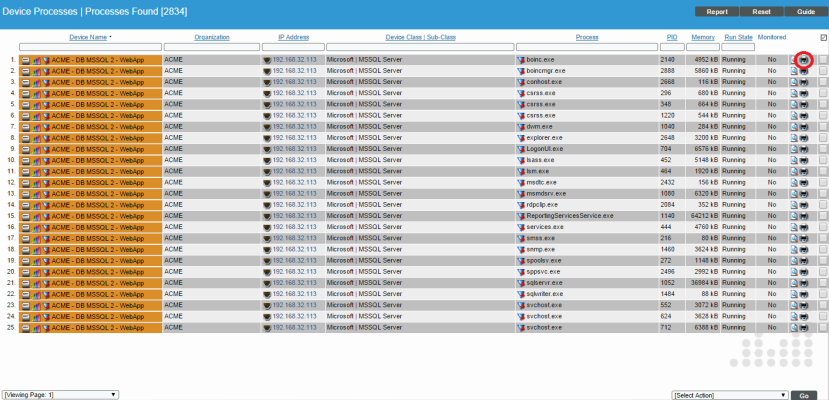
- Go to the Device Processes page (Devices > Processes).
- In the Device Processes page, find an instance of the process you want to generate an exclusion report for. Select its printer icon (
 ).
). - You will be prompted to save or view the generated report.
Generating a Report for Multiple Windows Services
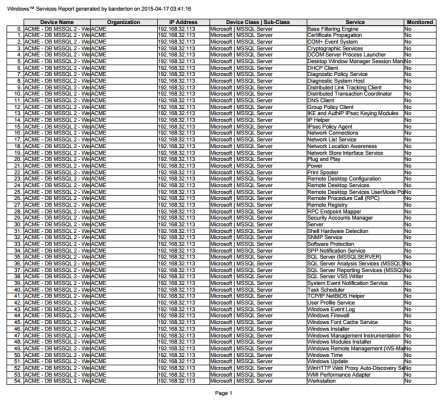
From the Windows Services page (Devices > Services) you can generate a report on all, multiple, or a single service in SL1. The Windows Services page allows you to generate a report that contains all the information displayed in the Windows Services page.
To generate a report on all or multiple Windows services in SL1:
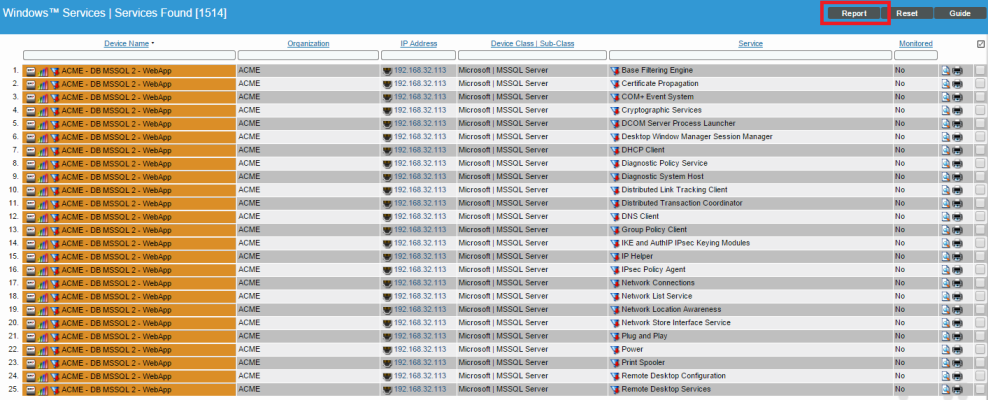
- Go to the Windows Services page (Devices > Services).
- In the Windows Services page, select the button.
NOTE: If you want to include only certain services in the report, use the "search as you type" fields at the top of each column. You can filter the list by one or more column headings. You can then select the button, and only the services displayed in the Windows Services page will appear in the report.
- The Export current view as a report modal appears.
- In the Export current view as a report modal, you must select the format in which SL1 will generate the report. Your choices are:
- Comma-separated values (.csv)
- Web page (.html)
- OpenDocument Spreadsheet (.ods)
- Excel spreadsheet (.xlsx)
- Acrobat document (.pdf)
- Click the button. The report will contain all the information displayed in the Windows Services page. You can immediately view the report or save it to a file for later viewing.
Generating an Exclusion Report for a Windows Service
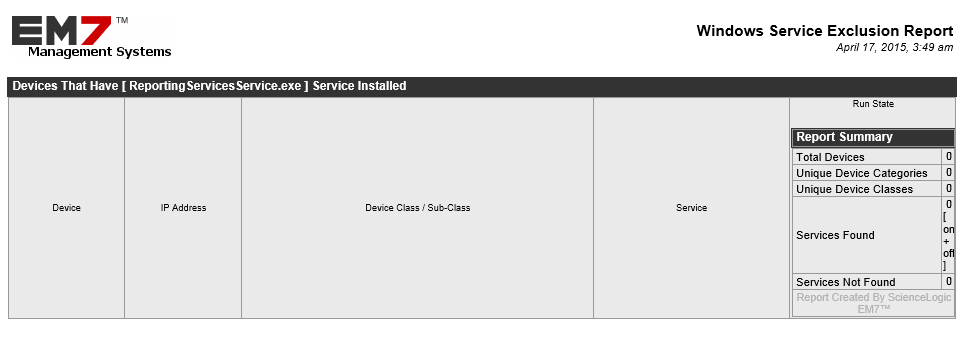
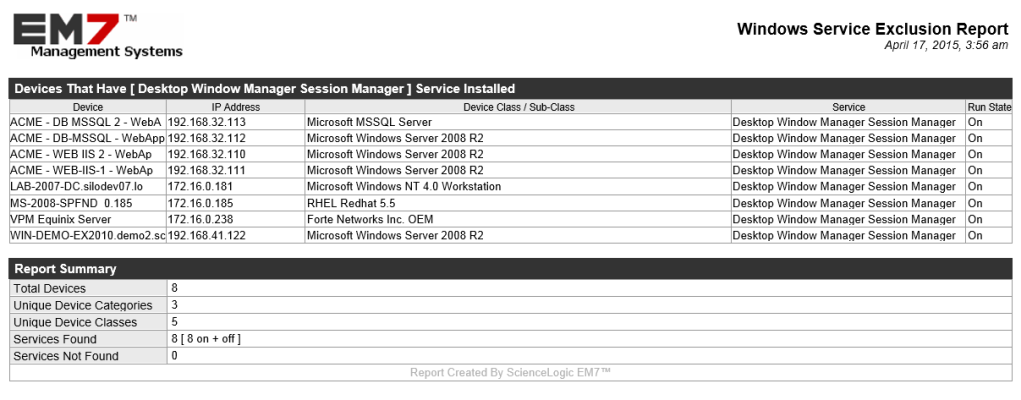
From the Windows Services page, you can generate an exclusion report for a service. SL1 will generate the report in MS Word format. An exclusion report specifies all devices where the selected Windows service is running and all devices where the selected Windows service is not running.
A Windows Services Exclusion Report displays the following:
- Name of the Windows service.
- List of all devices in SL1 where the Windows service is running.
- List of all devices in SL1 where the Windows service is not running. SL1 includes only appropriate servers in this report. For example, Solaris servers would not appear in a report for Windows services.
- The last row in the report displays:
- Total number of devices in report.
- Total number of device categories included in the report.
- Total number of device classes included in the report.
- Total number of devices where Windows service is running.
- Total number of devices where Windows service is not running.
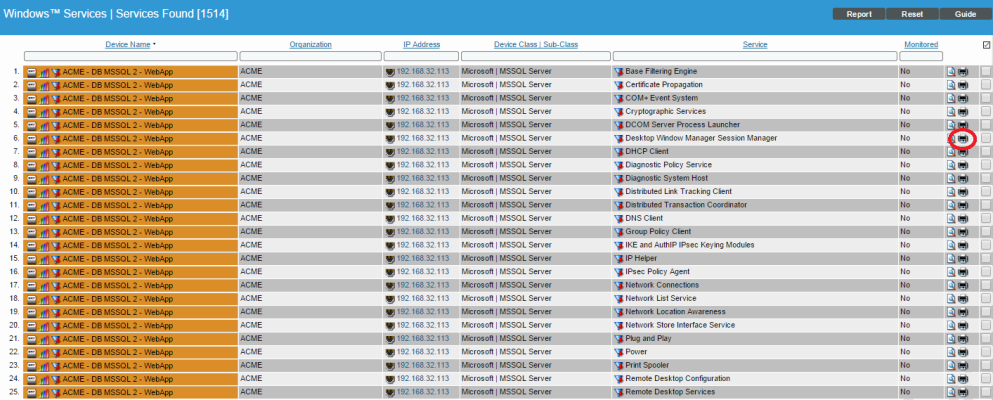
To generate an exclusion report about a Windows service:
- Go to the Windows Services page (Devices > Services).
- In the Windows Services page, find an instance of the Windows service you want to generate an exclusion report for. Select its printer icon (
 ).
). - You will be prompted to save or view the generated report.
Generating a Report for Multiple Hardware Components on Multiple Devices
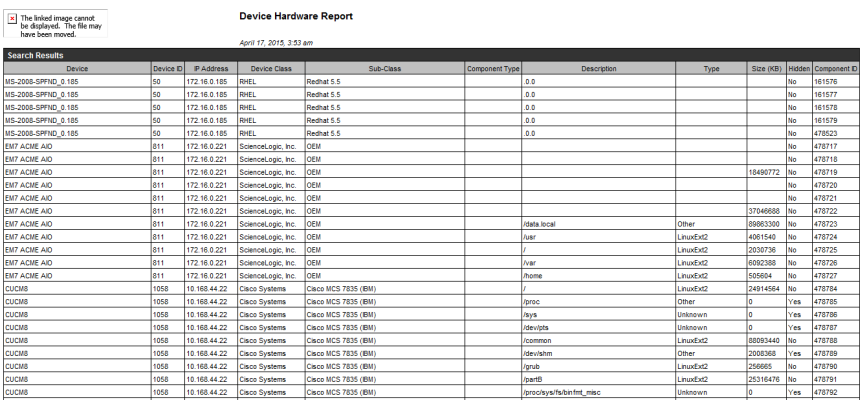
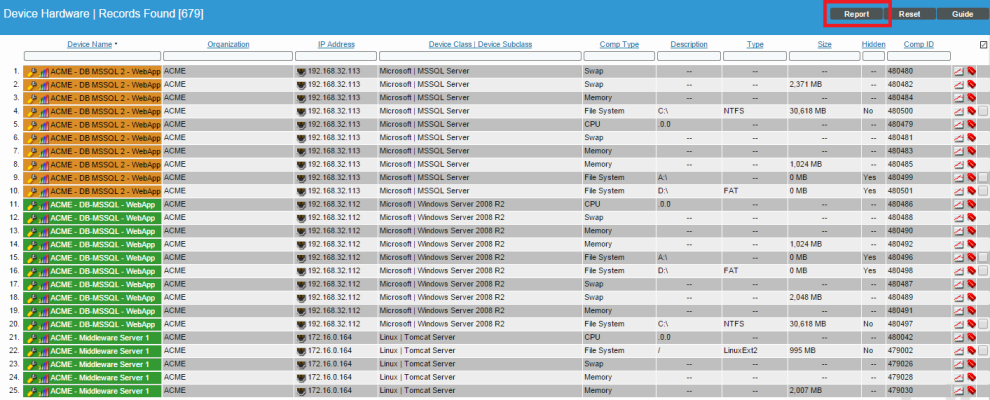
The Device Hardware page allows you to generate an Excel report that contains all the information on the Device Hardware page. You can immediately view the information or save it to a file for later viewing.
To generate a report on all hardware components in SL1:
- Log in to SL1.
- Go to the Device Hardware page (Devices > Hardware).
- In the Device Hardware page, click the button.
- When prompted, specify whether you want to save the report to your local computer or open the report immediately.
Generating a Report for Multiple Software Titles on Multiple Devices
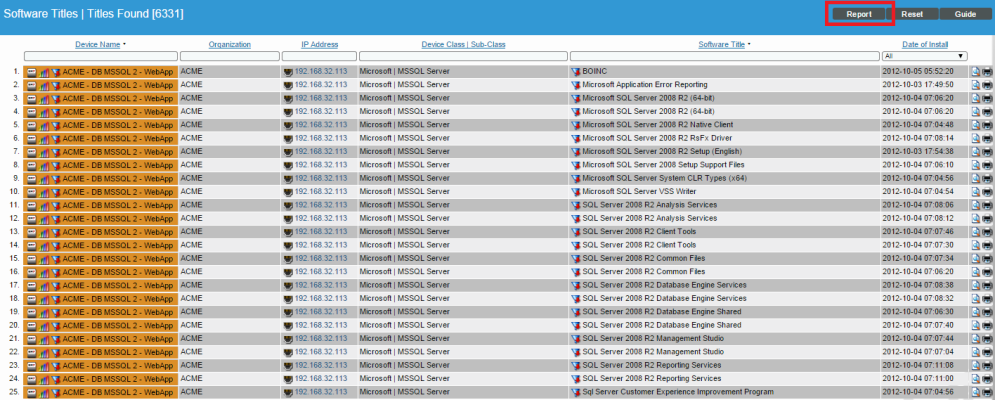
From the Software Titles page (Devices > Software) you can generate a report on all, multiple, or a single software title in SL1. The report will contain all the information displayed in the Software Titles page.
To generate a report on all or multiple software titles in SL1:
- Go to the Software Titles page (Devices > Software).
- In the Software Titles page, select the button.
NOTE: If you want to include only certain software titles in the report, use the "find while you type" fields at the top of each column. You can filter the list by one or more column headings. You can then select the button, and only the software titles displayed in the Software Titles page will appear in the report.
- The Export current view as a report modal appears:
- In the Export current view as a report page, you must select the format in which SL1 will generate the report. Your choices are:
- Comma-separated values (.csv)
- Web page (.html)
- OpenDocument Spreadsheet (.ods)
- Excel spreadsheet (.xlsx)
- Acrobat document (.pdf)
- Click the button. The report will contain all the information displayed in the Software Titles page. You can immediately view the report or save it to a file for later viewing.
Generating an Exclusion Report for a Software Title
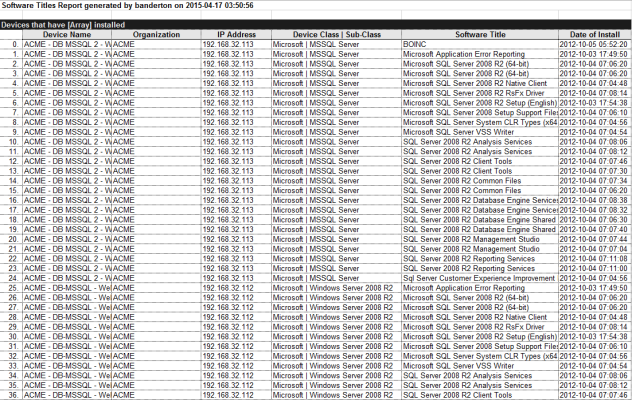
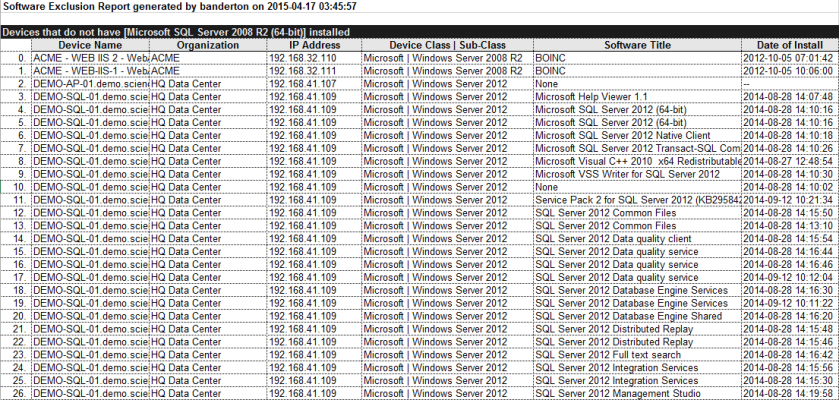
From the Software Titles page you can generate Software Exclusion Reports. These reports can help administrators manage patches and software versions. Software Exclusions Reports are generated in .XLSX format.
A Software Exclusions Report displays the following:
- Name of the software title and the date the report was generated.
- List of all devices in SL1 that have the software installed.
- List of all devices in SL1 that don't have the software installed. SL1 includes only appropriate servers in this report. For example, Solaris servers would not appear in a report for a Windows 2000 patch.
- The last row in the report displays:
- Total number of devices in report.
- Total number of device categories included in the report.
- Total number of device classes included in the report.
- Number of devices where software is installed.
- Number of devices where software is not installed.
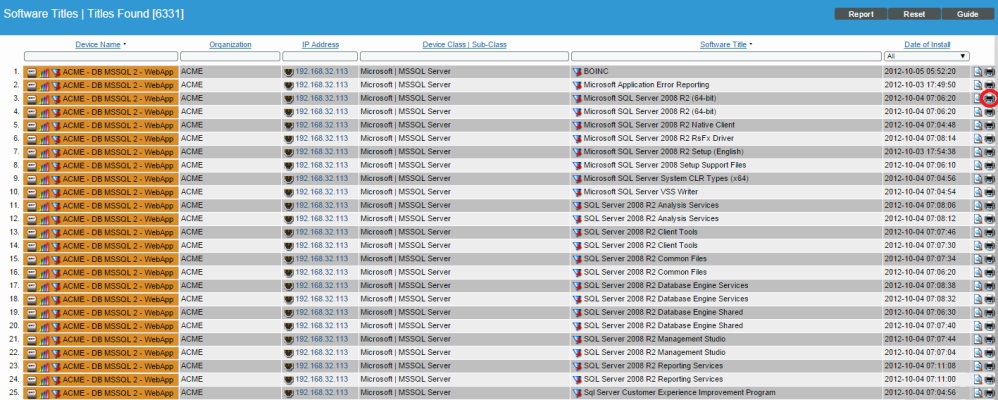
To generate a software exclusion report:
- Go to the Device Software page (Devices > Software).
- In the Software Titles page, find an instance of the software title you want to generate an exclusion report for and click its printer icon (
 )
) - You will be prompted to save or view the generated report.
Saving an Embedded Report from the Device Performance Page
You can use the button to save an embedded device report to a file on your local computer. You can choose from a number of different formats in which to save the file.
To save a report to your local computer:
- Go to the Device Manager page (Registry > Devices > Device Manager).
- Select the graph icon (
 ) for the device for which you want to save a report. The Device Summary page appears.
 - Select the tab to open the Device Performance page.
- In the Device Performance page, select the report you want to save from the left nav bar.
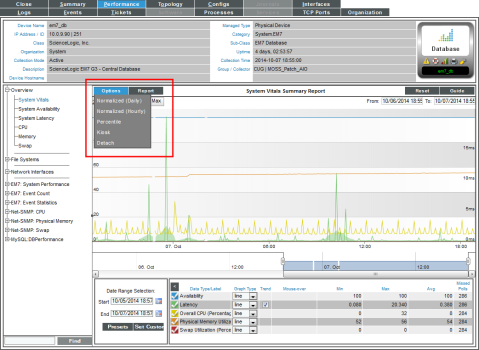
- Once you have selected the report, you can select the button to determine how you want to configure the data before it is displayed in the report. Your choices are:
- Default. The initial report that is displayed is not normalized and displays every collected value.
- Normalized (Daily). In SL1, normalized data does not include polling sessions that were missed or skipped. So for normalized data, null values are not included when calculating maximum values, minimum values, or average values. When you select this option, SL1 normalizes all the data collected in each 24-hour period and displays a single value for each day.
- Normalized (Hourly). This option applies only to Bandwidth Usage reports. In SL1, normalized data does not include polling sessions that were missed or skipped. So for normalized data, null values are not included when calculating maximum values, minimum values, or average values. When you select this option, SL1 normalizes all the data collected each hour and displays a single value for each hour.
- Percentile. Displays percent on the y-axis. This can be applied to normalized or non-normalized reports.
- Kiosk. Displays the report in full-page mode. This is helpful for NOC personnel who need to display reports on large screens.
- Detach. Spawns the report in a new window.
- Select Scale. For Bandwidth Usage reports, multiple options allow you to select the scale (octets, Octetbps, Kbps, Mbps, Gbmp, Tbps, Pbps) for display of inbound traffic and outbound traffic in the report.
- Interface Manager. This option applies only to Bandwidth Usage reports. Leads to the Interface Properties modal page, where you can view and edit the monitoring parameters for an interface.
- Edit Current Policy. For policy-based reports (domain name, email round-trip, SOAP/XML transactions, system processes, TCP/IP ports, web content), selecting this option displays a modal page in which you can edit the policy associated with the report.
- Series Selection. Each graph generated by a Dynamic Application can display up to eight data-series at a time. If a Presentation Object includes more than eight data-series, you can use this selection to view a different set of data series. When you select this option, the Graph Index Selection modal page is displayed. In the Graph Index Selection modal page, you can select up to eight data-series to display in the graph.
- Edit Current Presentation. For reports generated by Dynamic Applications, selecting this option allows you to edit the Presentation Object associated with the report.
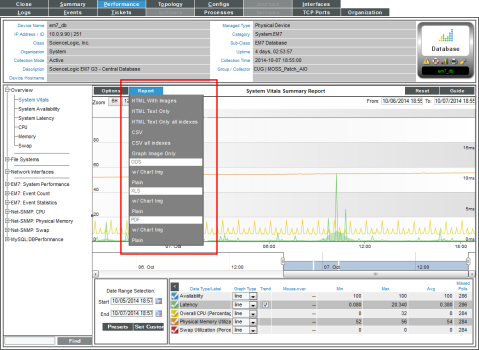
- After you have determined how you want to configure the data in your report, select the button to select the format in which you want to save the report. You can select from the following:
- HTML with Images. Saves the graph and a table of all the data in the report, in HTML format.
- HTML Text Only. Saves the report as a table of data, in HTML format.
- HTML Text Only all indexes. Saves the report as a table of data, in HTML format. In the Device Performance page, the report can include up to eight data series (indexes); when you select this option, the HTML report will include all indexes collected by SL1, even if the number of indexes is greater than eight.
- CSV. Saves the data from the report (usually date, time, and value) as comma-separated values.
- CSV all indexes. Saves the data from the report (usually date, time, and value) as comma-separated values. In the Device Performance page, the report can include up to eight data series (indexes); when you select this option, the CSV report will include all indexes collected by SL1, even if the number of indexes is greater than eight.
- Graph Image Only. Saves only the graph from the report as a .png file.
- ODS w/Chart Img. Saves the graph and a table of all the data in the report, in ODS format.
- ODS Plain. Saves the table of all the data in the report, in ODS format.
- XLSX w/ Chart Img. Saves the graph and a table of all the data in the report, in XLSX (Excel) format.
- XLSX Plain. Saves the table of all the data in the report, in XLSX (Excel) format.
- PDF w/chart Img. Saves the graph and a table of all the data in the report, in PDF format.
- PDF Plain. Saves the table of all the data in the report, in PDF format.
- When you select the format, you will be prompted to save the report to your local computer.
- Saving a report to your local computer also gives you the opportunity to print the saved report.

