![]()
To use machine learning-based anomaly detection on the SL1 Extended Architecture, you must enable the Collector Pipeline to collect data from Performance Dynamic Applications. For more information, see
Use the following menu options to navigate the SL1 user interface:
- To view a pop-out list of menu options, click the menu icon (
 ).
). - To view a page containing all the menu options, click the Advanced menu icon (
 ).
).
Viewing the List of Devices that Have Anomaly Detection Enabled
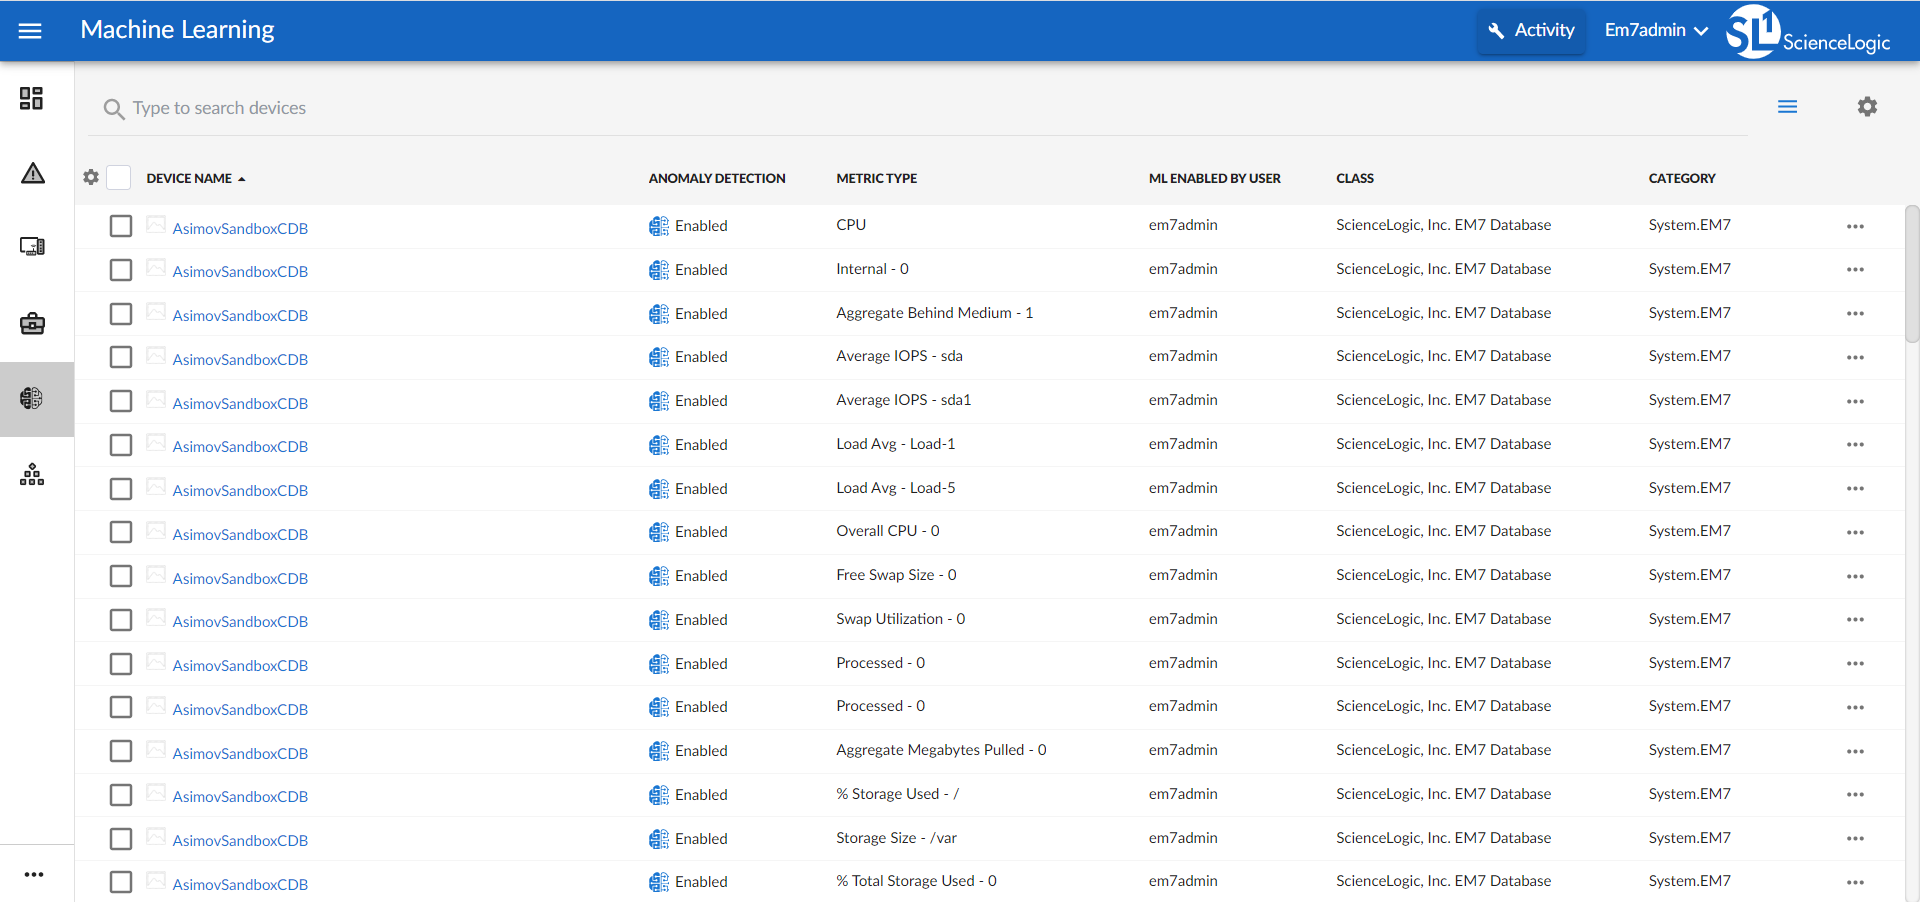
The Machine Learning page displays a list of devices that are currently using machine learning for anomaly detection, as well as devices for which you can enable anomaly detection if it is not enabled already.
To navigate to the Machine Learning page, click the Machine Learning icon (![]() ):
):
If you are looking for a very specific set of devices for anomaly detection, click the gear icon (![]() ) to the right of the Search field and select Advanced. In this mode you can create an advanced search using "AND" or "OR" for multiple search criteria. For more information, see Performing an Advanced Search.
) to the right of the Search field and select Advanced. In this mode you can create an advanced search using "AND" or "OR" for multiple search criteria. For more information, see Performing an Advanced Search.
To filter the devices that appear on the page based on whether anomaly detection is enabled or disabled, type "MachineLearningPolicy.enabled" in the Search field. A "MachineLearningPolicy.enabled" pill appears below the Search field. Click that pill and then select True to filter the page to display only those devices on which anomaly detection is enabled, or select False to filter the page to display only those devices on which anomaly detection is disabled.
For each device in the list, the Machine Learning page displays the following information:
- Device Name. Displays the name of the device. Click the hyperlink to go to the tab of the Device Investigator page for that device. Each row in the list represents a specific device and metric; therefore, a device might appear in the list multiple times if anomaly detection is enabled for multiple metrics on that device.
- Anomaly Detection. Indicates the build status for the for the metric that SL1 is evaluating for anomalies on the device. Possible values include:
- Disabled. Anomaly detection is disabled for the metric.
- Enabled. Anomaly detection is enabled for the metric.
- Queued. The metric has been selected for anomaly detection, but SL1 has not yet begun building the anomaly detection model for that metric.
- Building. SL1 is building the anomaly detection model that is specific to the selected device and metric.
- Failed. The anomaly detection model build process failed.
- Metric Type. Indicates the metric that SL1 is evaluating for anomalies on the device.
- ML Enabled By User. Indicates the username of the user that enabled anomaly detection for the device and metric.
- Class. Displays the device's Device Class.
- Category. Displays the device's Device Category.
Enabling Machine Learning on a Device
For SL1 to collect and analyze data for the sake of detecting anomalies for a specific metric on a particular device, you must first enable machine learning on that device. You can do that from several different places within SL1.
The following sections describe each of these methods.
Enabling Machine Learning from the Machine Learning Page
To enable machine learning for a device from the Machine Learning page:
- Click the Machine Learning icon (
 ). The Machine Learning page displays.
 - Locate the device (and metric, if applicable) on which you want to enable machine learning.
- Click the icon (
 ) for that device and metric and then select Enable. The Select Metric to Enable Machine Learning modal page appears.
Alternatively, you can select the checkbox of the device on which you want to enable machine learning and then click at the bottom of the page.
- Click on the Metric drop-down field. You can either use the Search field to search for a specific metric or click one of the category names (such as "Dynamic Apps" or "Collection Labels") to view a list of available metrics for that metric category.
- Click the name of the metric on which you want to enable machine learning for the device.
- For some metrics, a second drop-down field might display that enables you to specify the device directory. If this field appears, click the name of the directory on which you want to enable machine learning.
- Click .
To enable or disable machine learning for more than one device and metric, select the checkboxes for each device and metric for which you want to enable or disable machine learning and then click or at the bottom of the page.
Enabling Machine Learning in the Device Investigator
To enable machine learning for a device in the Device Investigator:
- Click the Devices icon (
 ). The Devices page displays.
 - On the Devices page, click the Device Name for the device on which you want to enable anomaly detection. The Device Investigator displays.
- Click the tab.
If the tab does not already appear on the Device Investigator, click the More drop-down menu and select Machine Learning from the list of tab options.
- On the tab of the Device Investigator, click the button or click the Actions icon () for any of the listed metrics and select Enable. The Select Metric to Enable Machine Learning modal page appears.
- Click on the Metric drop-down field. You can either use the Search field to search for a specific metric or click one of the category names (such as "Dynamic Apps" or "Collection Labels") to view a list of available metrics for that metric category.
- Click the name of the metric on which you want to enable machine learning for the device.
- For some metrics, a second drop-down field might display that enables you to specify the device directory. If this field appears, click the name of the directory on which you want to enable machine learning.
- Click . The metric appears on the Machine Learning tab.
To disable machine learning for a metric, click the Actions icon (![]() ) for that metric and select Disable. The metric is removed from the Machine Learning tab.
) for that metric and select Disable. The metric is removed from the Machine Learning tab.
Enabling Machine Learning in the Service Investigator
The Anomalies widget in the Service Investigator displays a list of devices within the selected business, IT, or device service that have anomaly detection enabled. From this widget, you can also enable machine learning for additional metrics or disable machine learning metrics on which it is currently enabled.
The Anomalies widget appears only if you have at least one device in the selected service that has anomaly detection enabled.
To enable machine learning in the Service Investigator:
- On the Business Services page (
 ), select a service from the list of business, IT, and device services by clicking its name. The Service Investigator displays.
 - On the Service Investigator page, click the Anomalies widget.
- Click the Actions icon () for any of the listed metrics and select Enable. The Select Metric to Enable Machine Learning modal page appears.
- Click on the Metric drop-down field. You can either use the Search field to search for a specific metric or click one of the category names (such as "Dynamic Apps" or "Collection Labels") to view a list of available metrics for that metric category.
- Click the name of the metric on which you want to enable machine learning for the device.
- For some metrics, a second drop-down field might display that enables you to specify the device directory. If this field appears, click the name of the directory on which you want to enable machine learning.
- Click . The metric appears in the Anomalies widget.
To disable machine learning for a metric, click the Actions icon (![]() ) for that metric and select Disable. The metric is removed from the Anomalies widget.
) for that metric and select Disable. The metric is removed from the Anomalies widget.
Viewing Device Anomalies
On the tab of the Device Investigator, you can view a list of machine learning metrics that are enabled for the device:

For each machine learning metric, the tab displays the following information:
- Metric. The metric label.
- Date Updated. The date and time at which machine learning was enabled for the metric or the metric's machine learning settings were last updated.
- Last Updated By. The username of the user who enabled machine learning for the metric or last updated the metric's machine learning settings.
- Anomaly Detection. Indicates the build status for the for the metric that SL1 is evaluating for anomalies on the device. Possible values include:
- Disabled. Anomaly detection is disabled for the metric.
- Enabled. Anomaly detection is enabled for the metric.
- Queued. The metric has been selected for anomaly detection, but SL1 has not yet begun building the anomaly detection model for that metric.
- Building. SL1 is building the anomaly detection model that is specific to the selected device and metric.
- Failed. The anomaly detection model build process failed.
Click the expand icon (![]() ) next to a metric label to open a graph showing the anomalies detected for the device metric during the selected time span.
) next to a metric label to open a graph showing the anomalies detected for the device metric during the selected time span.
You can use the time span filter on the tab to adjust the time span of anomalies that appears in the graph. The default filter is Last 24 hours, but you can select a time span ranging from Last Hour up to Last 2 Years.
This anomaly detection graph displays:
- A blue band representing the range of probable values that SL1 expected for the device metric.
- A green line representing the actual value for the device metric.
- A red dot indicating anomalies where the actual value appears outside of the expected value range.
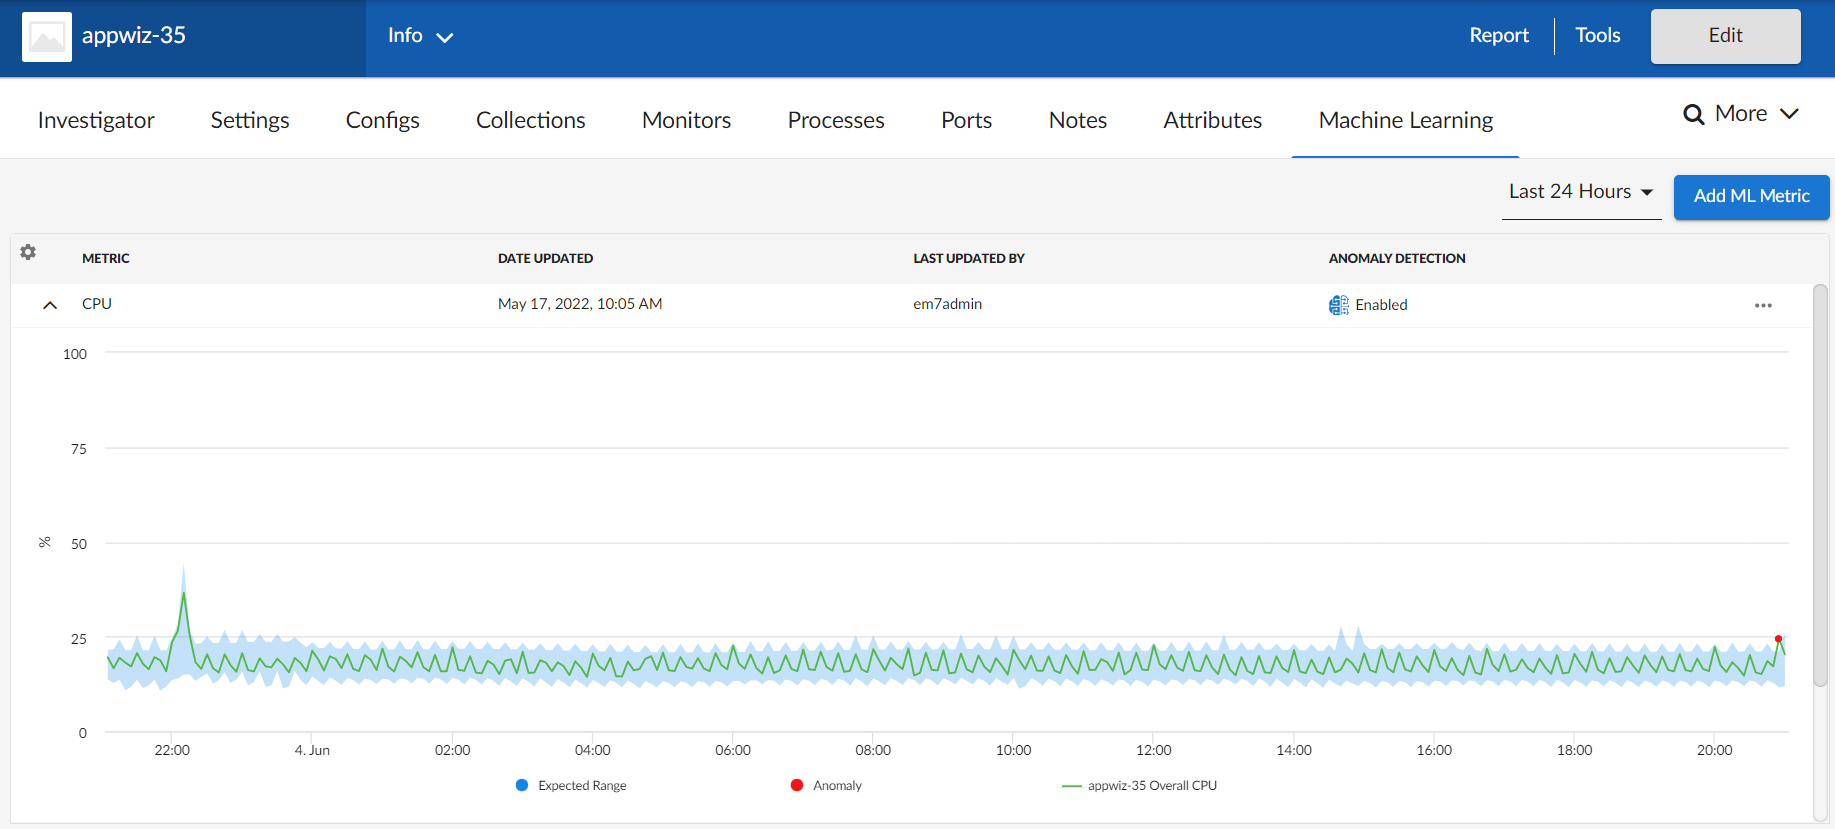
You can hover over any part of the graph with your mouse to see the exact historical values for each polling cycle. Also, you can zoom in on a shorter time frame by clicking and dragging your mouse over the part of the chart representing that time frame, and you can return to the original time span by clicking the button.
For more information about devices, see
Viewing Service Anomalies
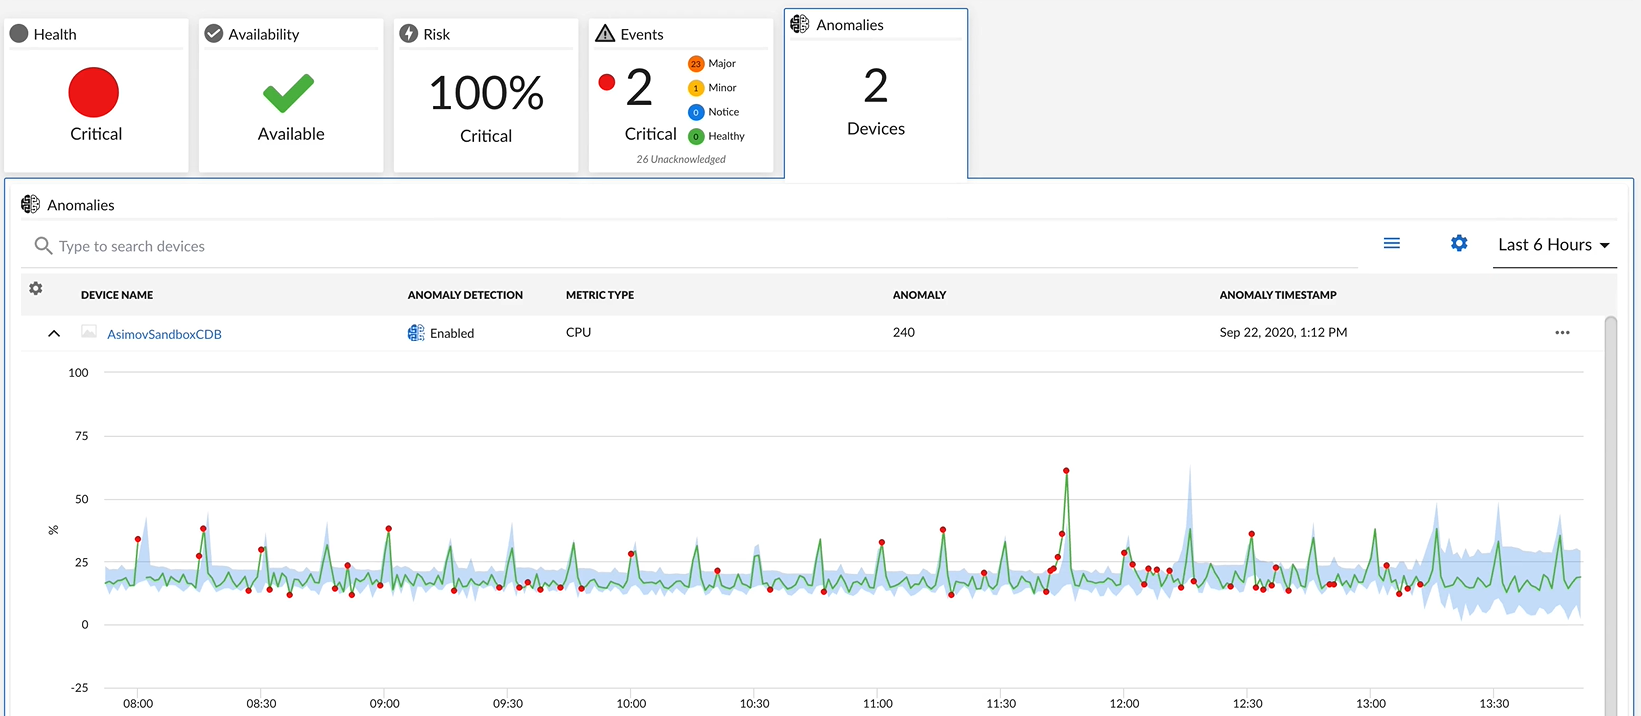
If one or more devices within a business, IT, or device service has anomaly detection enabled, the Anomalies widget will appear on the tab of the Service Investigator. The Anomalies widget displays a list of all the devices within the selected service that have anomaly detection enabled.
To view the Service Investigator page, select a service from the list of business, IT, and device services on the Business Services page (![]() ). The tab opens by default. This tab provides a single-page view of the selected service, including key metrics, events, and anomalies that are impacting the service.
). The tab opens by default. This tab provides a single-page view of the selected service, including key metrics, events, and anomalies that are impacting the service.
The Anomalies widget displays the following information about each device and metric in the list:
- Device Name. Displays the name of the device. Click the hyperlink to go to the tab of the Device Investigator for the device.
- Anomaly Detection.
- Disabled. Anomaly detection is disabled for the metric.
- Enabled. Anomaly detection is enabled for the metric.
- Queued. The metric has been selected for anomaly detection, but SL1 has not yet begun building the anomaly detection model for that metric.
- Building. SL1 is building the anomaly detection model that is specific to the selected device and metric.
- Failed. The anomaly detection model build process failed.
- Metric Type. Indicates the metric that SL1 is evaluating for anomalies on the device.
- Anomaly. The most recent anomaly value for the metric listed in the Metric Type column.
- Anomaly Timestamp. The time at which the most recent anomaly occurred.
From the Anomalies widget, you can do the following:
- Use the search field to search for specific devices.
- Click the expand icon (
 ) next to the device name to open a graph showing the anomalies detected for the device during the selected time span. This graph displays:
- A blue band representing the range of probable values that SL1 expected for the device metric.
- A green line representing the actual value for the device metric.
- A red dot indicating anomalies where the actual value appears outside of the expected value range.
You can use the time span filter on the Anomalies widget to adjust the time span of anomalies that appears in the graph. The default filter is Last 24 hours, but you can select a time span ranging from Last Hour up to Last 2 Years.
For more granularity, you can hover over any part of the graph with your mouse to see the exact historical values for each polling cycle. Also, you can zoom in on a shorter time frame by clicking and dragging your mouse over the part of the chart representing that time frame, and you can return to the original time span by clicking the button.
- Enable or disable anomaly detection on the devices listed by clicking the icon () and selecting Enable or Disable.
For more information about services, see