This example monitors two hosted, mission-critical, MS SQL database servers for availability and latency. The MS SQL database servers are leased by the company Acme and hosted by a service provider.
Use the following menu options to navigate the SL1 user interface:
- To view a pop-out list of menu options, click the menu icon (
).
- To view a page containing all the menu options, click the Advanced menu icon (
).
This example includes the following topics:
Creating an IT Service Policy
To define an IT Service policy, you must:
- Define a service name and basic properties. This example monitors two MS SQL database servers. The name of the IT Service policy will be "Acme: MS SQL Database Servers".
- Define a list of devices (model) for the IT Service that includes all the devices associated with the IT Service. This example includes two MS SQL servers in the IT Service.
- Optionally, define service sets. A service set is a sub-group of devices. This example does not use service sets.
- Define metrics. A metric is based on your business processes and examines all devices or one or more service sets to evaluate the state of the IT Service. For each IT Service, SL1 provides a default metric called Average Device Availability, based on the availability of all devices in the IT Service. You can define additional metrics, based on default data collected by SL1 (availability, latency, CPU usage, memory usage, swap usage, device state, and device count), data collected by a Dynamic Application, and data about network interfaces, TCP/IP ports, system processes, Windows services, Email round-trip time, web content, SOAP/XML transactions, and DNS availability.
NOTE: When SL1 evaluates a metric, it performs an aggregation, that is, SL1 evaluates the data for all devices specified in the definition of the metric, over a specified time period (the Aggregation Frequency). Depending on the definition of the metric, SL1 calculates the average, maximum, minimum, sum, standard deviation, or count value for all devices specified in the definition of the metric.
- Define Key Metrics. Key Metrics are the standard method for describing the status of an IT Service. Key Metrics allow you to quickly gauge the status of multiple IT Services, even if those IT Services require very different metrics that aggregate very different performance data.The Key Metrics are Health, Availability, and Risk. When you define a Key Metric, you are specifying how the value for a metric you created in step 4 translates to one of the standard Key Metric values. By default, all three Key Metrics are based on the default Average Device Availability metric.
- Define alerts and associated events. Each alert and its associated event is triggered by a metric. In our example, we will define alerts for each metric.
Defining the Name of the IT Service Policy and its Basic Properties
To define the basic parameters of our example IT Service policy:
- Go to the IT Service Manager page (Registry > IT Services > IT Service Manager).
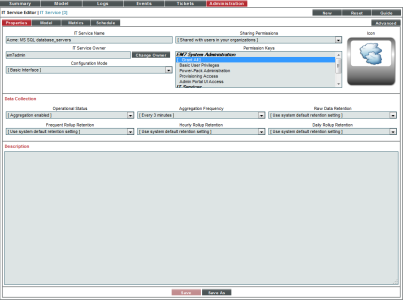
- Select the button. The IT Service Editor page appears, with the tab and sub-tab selected:
- Supply the following values in the following fields:
- IT Service Name. Name of the IT Service policy. We entered "Acme: MS SQL database_servers".
- IT Service Owner. Automatically populated with your username.
- Configuration Mode. We selected Basic Interface. The Basic Interface allows you to quickly setup an IT Service policy.
- Sharing Permissions. Specifies whether other users can view and use the IT Service policy, in both the IT Service Manager page, IT Service Editor page, and in the pages in SL1 where the IT Service is visible. We selected Shared with users in your organization. The IT Service policy can be viewed and used by other users who belong to the same organization as the creator.
- Permission Keys. We did not select any permission keys.
- Operational Status. We selected Aggregation enabled.
- Aggregation Frequency. Frequency at which SL1 will collect data from all devices in the IT Service and "crunch" the data for each metric into a single value. We specified Every 3 minutes.
- Raw Data Retention. Specifies how long SL1 should store the raw data for the IT Service Policy. We accepted the default value.
- Frequent Rollup Retention. Deprecated field no longer used by SL1.
- Hourly Rollup Retention. Specifies how long SL1 should store the "hourly" normalized data for the IT Service policy. We accepted the default value.
- Daily Rollup Retention. Specifies how long SL1 should store the "daily" normalized data for the IT Service policy. We accepted the default value.
- Description. We did not enter a description.
- Select the button to save the values in the tab.
Defining a List of Devices for the IT Service Policy
After defining the name and basic properties of an IT Service Policy, you must next determine the devices to include in your IT Service policy. You do this in the sub-tab.
For example, if you want to monitor Email service, you could create a list of devices that includes Exchange servers, DNS servers, and devices that run Email round-trip policies.
You can manually assign devices and device groups to the IT Service device group, or you can use membership rules, like you would for a dynamic device group.
When you define the list of devices to include in your IT Service policy, that list of devices appears as a device group throughout SL1.
There are three ways to add a device to the list of devices for the IT Service policy.
- Add a device group to the list of devices for the IT Service policy.
- Add a static list of one or more devices to the list of devices for the IT Service policy.
- Add a dynamic list of one or more devices to the list of devices for the IT Service policy.
In our example, we will add a static list of devices that includes two MS SQL servers to the IT Service policy.
To create the list of devices for the IT Service policy.
- After performing the tasks in the previous section, select the sub-tab.
- To add a static list of one or more devices to the list of devices for the IT Service policy, go to the Static Devices pane.
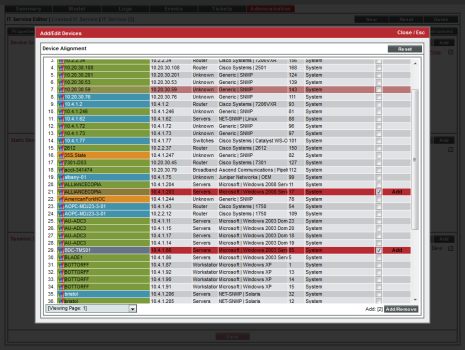
- Select the button. The Device Alignment modal page appears and displays a list of all devices in SL1.
- In the Device Alignment modal page, we selected the checkbox for devices "ALLIANCECOPIA" and "BDC-TMS01". Each is a device running the Windows operating system and MS SQL database server.
- Select the button in the lower right.
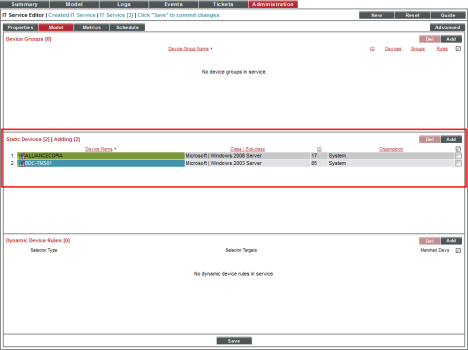
- The selected devices appear in the Static Devices pane:
- Select the button to save the list of devices.
Defining Metrics for the IT Service Policy
A metric is a measurement that helps determine the status of an IT Service.
SL1 automatically includes a default metric with each IT Service policy. The default metric is called Average Device Availability. The Average Device Availability metric aggregates the current availability value (0 or 1) of all devices in the IT Service and calculates the average value. The aggregation is performed at the frequency specified in the Aggregation Frequency setting in the basic properties for the IT Service policy. The availability of a device is determined every 5 minutes.
Before you can define a metric, you must determine what parameters you want to monitor for the IT Service policy. You can use data from the following sources to monitor the IT Service:
- Device Availability
- Device Latency
- Overall CPU Usage
- Physical Memory Usage
- Swap Usage
- Device State (Condition of the device, based upon the most severe event generated by the device.)
- Device Count
- Presentation Objects from Dynamic Applications
- Network Interface
- TCP/IP Port Monitor
- System Process Monitor
- Windows Service Monitor
- Email Round Trip Monitor
- Web Content Monitor
- SOAP/XML Transaction Monitor
- Domain Name Monitor
Our example includes three metrics:
- Device Availability
- Device Latency
- System Process availability
We will create our metrics in Basic mode. We will edit the default metric and create two additional metrics. We will also define an alert/event for each metric.
Device Availability Metric
- After performing the tasks in the previous section, select the sub-tab.
- Ensure that you are in Basic mode. If you see the sub-tab, you are not in Basic mode. Click on the button to toggle to Basic mode.
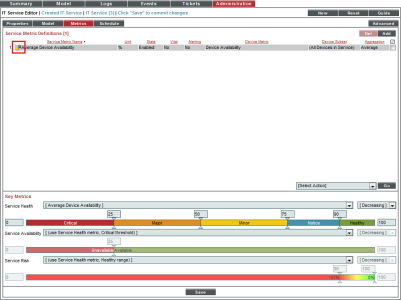
- First, we will edit the default metric. In the Service Metric Definitions pane, find the metric Average Device Availability and select its wrench icon (
 ).
).
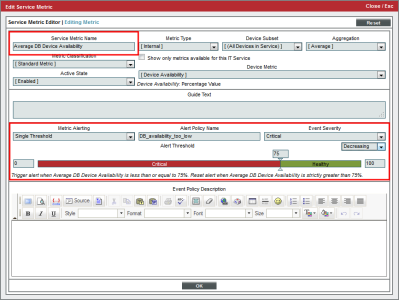
- The Service Metric Editor modal page appears:
- In the Service Metric Editor page, edit the following field:
- Service Metric Name. Enter Average DB Device Availability. This lets us know that the metric is measuring the device's availability, not the database server's availability.
- In the lower pane, we'll define an alert for the metric. This alert specifies that when the availability of the two database servers falls below 75%, trigger an event with a severity of Critical. To define this alert and event, supply values in the following fields:
- Metric Alerting. Select Single Threshold.
- Alert Policy Name. Enter "DB_availability_too_low".
- Event Severity. Select Critical.
- Increasing/Decreasing. Select Decreasing.
- Threshold. Drag the slider to 75.
- Select the button to save the metric.
Device Latency Metric
Next, we will define a new metric that examines the latency of the devices where the MS SQL servers reside. To do this:
- Go to Service Metric Definitions pane and select the button.
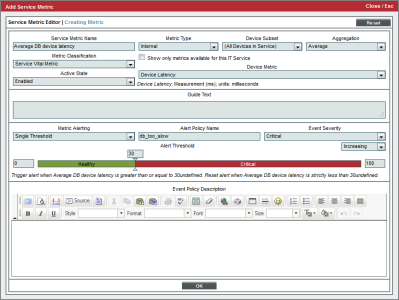
- The Service Metric Editor modal page appears. In this page, we'll define a metric that measures the latency of the two devices in our IT Service policy. We'll also define an alert that will trigger an event if the average latency of the two devices is greater than 30 milliseconds.
- To create the new metric, supply the following values in the fields:
- Service Metric Name. Enter "Average DB device latency".
- Metric Type. Select Internal.
- Device Metric. Select Device Latency.
- For all other fields in the top pane, you can accept the default values.
- In the lower pane, we'll define an alert for the metric. This alert specifies that when the average latency of the two devices where the database servers reside is greater than 30 milliseconds, it will trigger an event with a severity of Critical. To define this alert and event, supply values in the following fields:
- Metric Alerting. Select Single Threshold.
- Alert Policy Name. Enter "db_too_slow".
- Event Severity. Select Critical.
- Increasing/Decreasing. Select Increasing.
- Threshold. Drag the slider to 30.
- Select the button to save the metric.
System Process Metric
Next, we will define a metric that makes sure that the process sqlservr.exe is running on both devices where the MS SQL databases reside.
- Before we can define this metric in the IT Service Editor, we must tell SL1 to monitor the sqlservr.exe process, outside of the IT Service policy. To do this:
- Go to the Device Processes page (Registry > Devices > Processes).
- Use the Device Name column to search for the device ALLIANCECOPIA.
- Use the Process column to search for the process sqlservr.exe.
- Select the checkbox for sqlservr.exe running on ALLIANCECOPIA.
- Select the Select Actions menu. Select Enable (Create Policy).
- Select the button.
- Use the Device Name column to search for the device BDC-TMS01.
- Use the Process column to search for the process sqlservr.exe.
- Select the checkbox for sqlservr.exe running on BDC-TMS01.
- Select the Select Actions menu. Select Enable (Create Policy).
- Select the button.
- Go back to the IT Service Manager page (Registry > IT Services > IT Service Manager). Find the IT Service policy Acme: MS SQL database server. Select its wrench icon (
 ).
).
- Select the tab. Select the button.
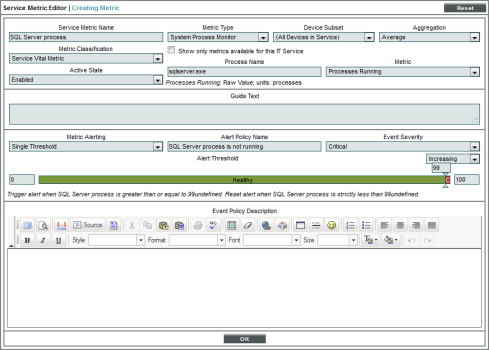
- The Service Metric Editor modal page appears. In this page, we'll define a metric ensures that the process sqlservr.exe is running on both devices where the MS SQL database resides. We'll also define an alert that will trigger an event if the availability of the process sqlservr.exe is less than 99%. In other words, with the exceptions of very, very brief outages, the process sqlservr.exe should be running.
- To create the new metric, supply the following values in the fields:
- Service Metric Name. Enter SQL Server process.
- Metric Type. Select System Process Monitor.
- Process Name. Enter sqlservr.exe.
- Metric. Select Process Running.
- For all other fields in the top pane, you can accept the default values.
- In the lower pane, we'll define an alert for the metric. This alert specifies that if the process sqlservr.exe is not running on both devices in the IT Service policy, trigger an event with a severity of Critical. To define this alert and event, supply values in the following fields:
- Metric Alerting. Select Single Threshold.
- Alert Policy Name. Enter "SQL Server process is not running".
- Event Severity. Select Critical.
- Increasing/Decreasing. Select Increasing.
- Threshold. Drag the slider to 99.
- Select the button to save the metric.
Defining Key Metrics for the IT Service Policy
Key Metrics are the standard method for describing the status of an IT Service. Key Metrics allow you to quickly gauge the status of multiple IT Services, even if those IT Services require very different metrics that aggregate very different performance data. For example, you can define "health" for a remote backup service and also define "health" for an Internet bandwidth service, even though you would use different criteria to measure the health of those two services.
All IT Service policies define how SL1 should calculate the following Key Metrics for the IT Service:
NOTE: SL1 automatically includes a default metric with each IT Service policy. The default metric is called Average Device Availability. The Average Device Availability metric specifies that SL1 should aggregate the availability data for all the devices in the policy and calculate the average availability.
- Service Health. The health of an IT Service can be one of the five standard severity values: Healthy, Notice, Minor, Major, or Critical. By default, the Service Health metric is aligned with the Average Device Availability metric.
- Service Availability. The availability of an IT Service can be either available or unavailable. By default, the Service Availability metric is aligned with the same metric as Service Health, converting Critical Service Health to Unavailable and all other Service Health values to Available.
- Service Risk. The risk of an IT Service is a percentage value that indicates how close an IT Service is to being in an undesirable state. By default, the Service Risk metric is aligned with the same metric as Service Health, converting the threshold between Healthyand Notice Service Health to 100% and the healthiest possible value to 0%.
SL1 generates an event if the Service Health Key Metric has a value of Notice, Minor, Major, or Critical, and/or if the System Availability key metric has a value of unavailable.
For more details on Key Metrics, see the main section on Key Metrics.
Using the three metrics we created in the previous section, we'll define the Key Metrics for our IT Service Policy:
- Select the sub-tab.
- In the top pane, you will see the default metric, Average Device Availability. If you have already defined additional custom metrics, they will also appear in the top pane.
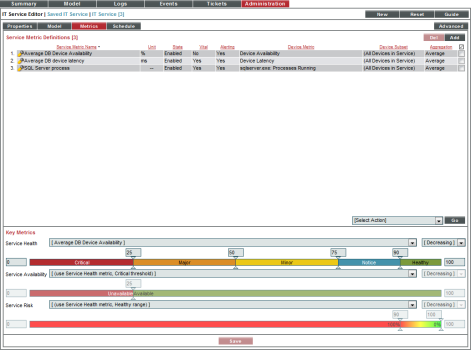
- In the bottom pane, you will see the three Key Metrics:
- To edit each metric, supply the following values:
- Service Health. Appears in the Health column in the IT Service Manager page (Registry > IT Services > IT Service Manager). Possible values are Healthy, Notice, Minor, Major, and Critical. By default, the Service Health Key Metric is based on the metric for Average Device Availability, with values set at 0-24 is Critical, 25-49 is Major, 50-74 is Minor, 75-89 is Notice, and 90 and above is Healthy.
- In the drop-down list that appears above the Service Health Key Metric, select Average DB device latency.
- Select Increasing.
- Enter the following thresholds: 30, 40, 50, 60.
- If average latency is below 30 milliseconds, the IT Service policy will have a Health value of Healthy.
- If average latency is between 30 - 40 milliseconds, the IT Service policy will have a Health value of Notice.
- If average latency is between 40 - 50 milliseconds, the IT Service policy will have a Health value of Minor.
- If average latency is between 50 - 60 milliseconds, the IT Service policy will have a Health value of Major.
- If average latency is greater than 60 milliseconds, the IT Service policy will have a Health value of Critical.
- Service Availability. Appears in the Availability column in IT Service Manager page (Registry > IT Services > IT Service Manager). Possible values are Available and Unavailable. By default, the Service Availability Key Metric is based on the same metric as is used for the Service Health Key Metric. By default, 0 - 24 is Unavailable and 25 - 100 is Available.
- In the drop-down list that appears above the Service Availability Key Metric, select Average DB Device Availability.
- Select Decreasing.
- Enter the threshold 75.
- If the average availability of the two devices in the IT Service policy falls below 75%, the IT Service policy will have an Availability value of Unavailable.
- Service Risk. Appears as a percentage in the Risk column in the IT Service Manager page (Registry > IT Services > IT Service Manager). Possible values are 0% - 100%. By default, the Service Risk Key Metric is based on the same metric as is used for the Service Health Key Metric. By default, 0 - 89 is Critical and 90 - 100 is Healthy.
- In the drop-down list that appears above the Service Risk Key Metric, select SQL Server process.
- Select Decreasing.
- Enter the threshold 99.
- If the process sqlservr.exe is not running an average of 99% of the time, the IT Service policy will have a Risk value of 100%.
- Select the button to save your changes to the Key Metrics.
Events for the IT Service Policy
To see the definitions for the events associated with each metric, go to the Event Policy Manager page (Registry > Events > Event Manager).
To find the event definitions, filter the Event Policy Name field by the name of the IT Service policy.
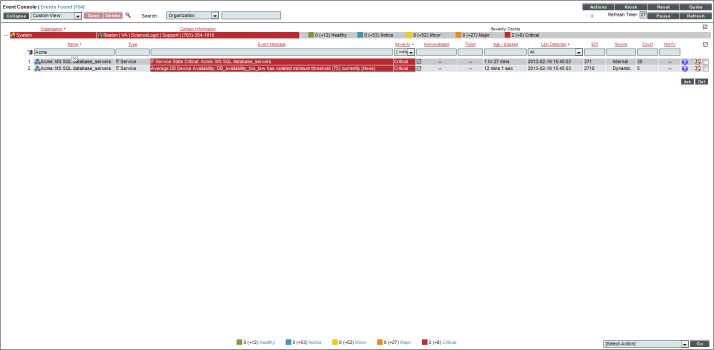
When an event for an IT Service is triggered, it displays the following message in the Event Console:
[name of metric] has violated threshold (%T) currently (%V).
where %T is the threshold you defined for the alert and %V is the current value for the metric.
SL1 generates an event if the Service Health key metric has a value of Notice, Minor, Major, or Critical. In the event above the metric that we associated with the Service Health Key Metric exceeded the threshold for the metric.
IT Service Dashboard
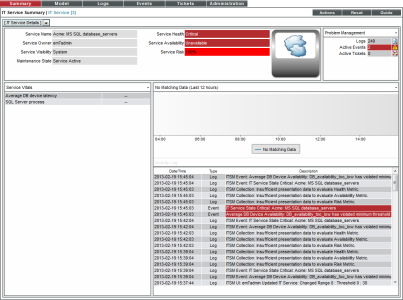
If you select the tab for our example IT Service policy, you'll see something like the following:
The IT Service Summary page displays the following:
- IT Service Details. Displays the following information about an IT Service:
- Service Name
- Service Owner
- Service Visibility
- Maintenance State
- Service Health
- Service Availability
- Service Risk
- IT Service Vitals. Displays the current value for each Key Metric defined for an IT Service.
- IT Service Problem Management. Displays the number of logs, active events, and active tickets associated with an IT Service.
- IT Service Health Last 12 Hours. Displays a graph of the Availability metric. The y-axis displays percent availability. The x-axis displays time in one-hour increments.
- IT Service Activity Log. Displays a list of all current and past alerts and events associated with an IT Service.
