The following sections describe the device dashboards that are included in the Aruba Central PowerPack:
Device Dashboards
The Aruba Central PowerPack includes device dashboards that provide summary information for Aruba Central component devices. Each of the device dashboards in the Aruba Central PowerPack is set as the default device dashboard for the equivalent device class.
NOTE: Some widgets will not display data for the "Aruba: Central Controller," "Aruba: Wireless Access Points," "Aruba: Gateway Summary," "Aruba: Gateway," and "Aruba: Switches" SL1 dashboards because the Dynamic Applications "REST: Performance Metrics Monitor (Aruba Central)" and "Aruba: Central Component Counts" are disabled by default for this version:
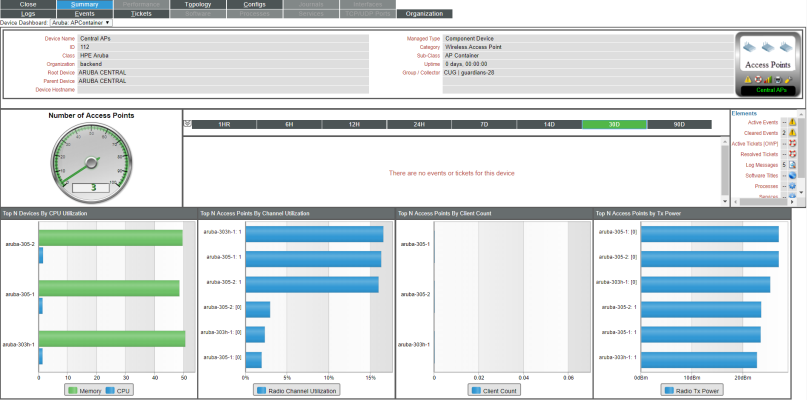
Aruba: AP Container
The Aruba: AP Container dashboard displays the following information:
- The basic information about the device
- The total number of access points
- A list of active events and open tickets associated with the device
- A count of, and links to, the elements associated with the device
- Four instances of the Leaderboard/Top-N Widget that display the top access points based on the following metrics:
- CPU/memory utilization
- Channel utilization
- Client count
- Transmit power
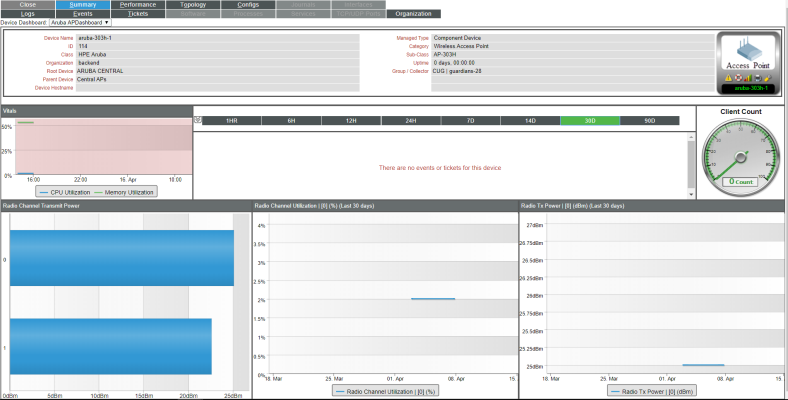
Aruba: AP
The Aruba: AP dashboard displays the following information:
- The basic information about the device
- The device's CPU and memory utilization vitals
- A list of active events and open tickets associated with the device
- The total number of AP clients
- Three instances of the Multi-series Performance Widget that display the following metrics trended over the specified period of time:
- Radio channel transmit power
- Radio channel utilization
- Radio transmit power
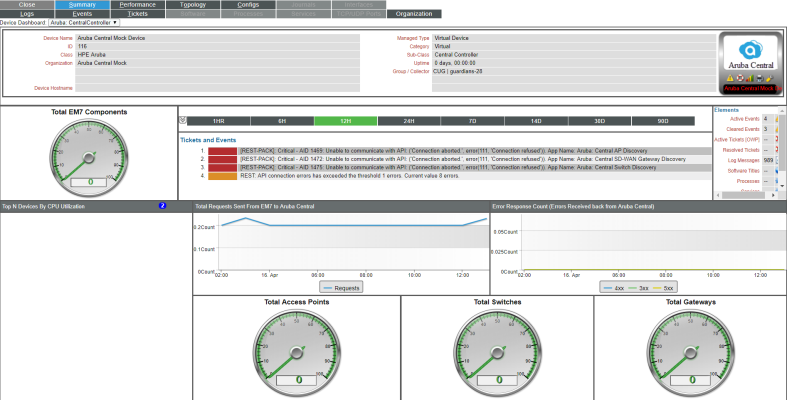
Aruba: Central Controller
The Aruba: Central Controller dashboard displays the following information:
- The basic information about the device
- A list of active events and open tickets associated with the device
- A count of, and links to, the elements associated with the device
- Four instances of the Gauge Widget that display the following metrics trended over the specified period of time:
- Total SL1 components
- Total access points
- Total switches
- Total gateways
- The top devices by CPU utilization over the specified period of time
- The total requests sent from SL1 to Aruba Central over the specified period of time
- The errors received back from Aruba Central over the specified period of time
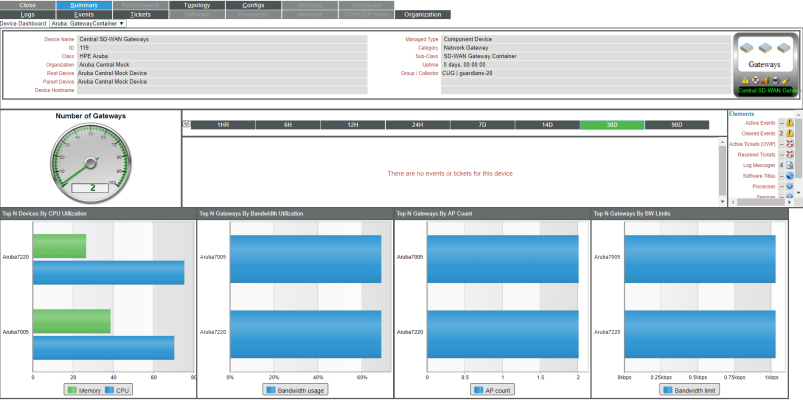
Aruba: Gateway Container
The Aruba: Gateway Container dashboard displays the following information:
- The basic information about the device
- The total number of gateways
- A list of active events and open tickets associated with the device
- A count of, and links to, the elements associated with the device
- Four instances of the Leaderboard/Top-N Widget that display the top gateways based on the following metrics:
- CPU/memory utilization
- Bandwidth utilization
- AP count
- Bandwidth limit
Aruba: Gateway
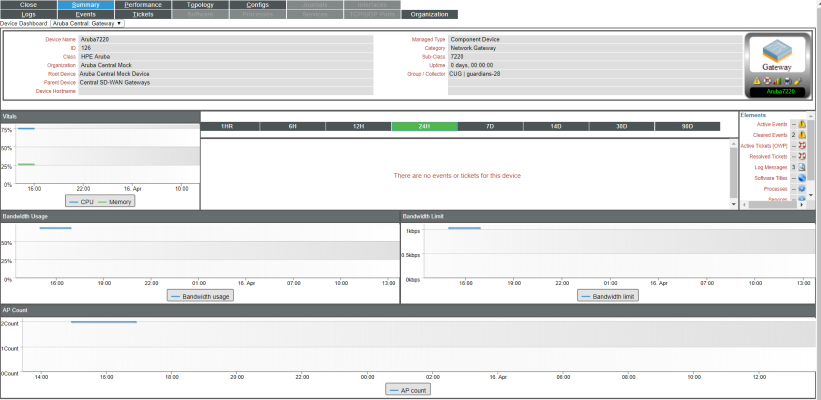
The Aruba: Gateway dashboard displays the following information:
- The basic information about the device
- The device's CPU and memory utilization vitals
- A list of active events and open tickets associated with the device
- A count of, and links to, the elements associated with the device
- Three instances of the Multi-series Performance Widget that display the following metrics trended over the specified period of time:
- Bandwidth usage
- Bandwidth limit
- AP count
Aruba: Switch Container
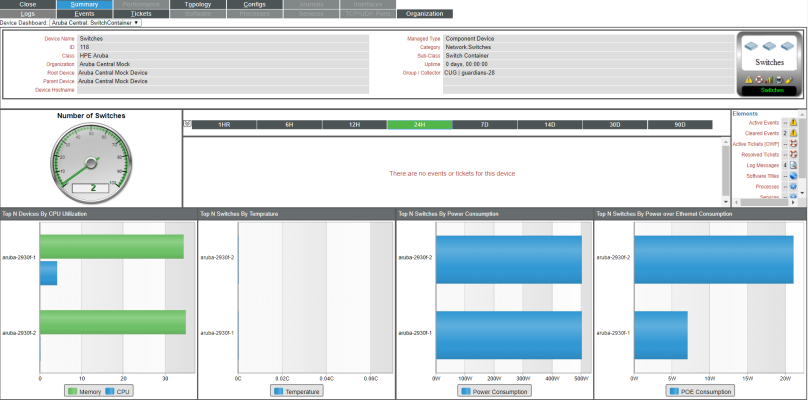
The Aruba: Switch Container dashboard displays the following information:
- The basic information about the device
- The total number of switches
- A list of active events and open tickets associated with the device
- A count of, and links to, the elements associated with the device
- Four instances of the Leaderboard/Top-N Widget that display the top gateways based on the following metrics:
- CPU/memory utilization
- Temperature
- Power consumption
- Power over Ethernet consumption
Aruba: Switch
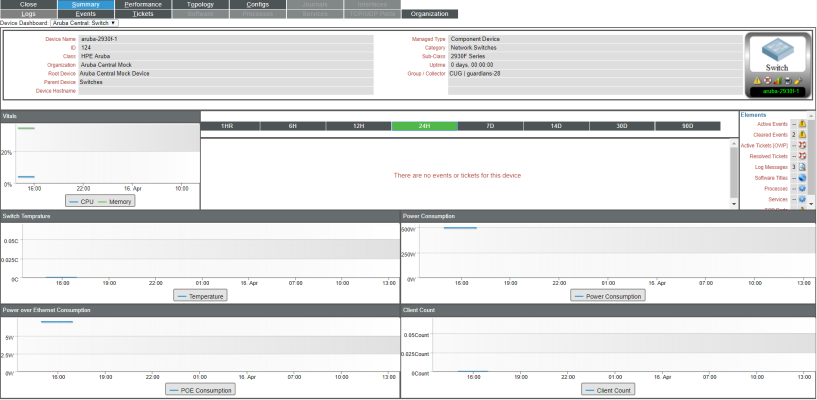
The Aruba: Switch dashboard displays the following information:
- The basic information about the device
- The device's CPU and memory utilization vitals
- A list of active events and open tickets associated with the device
- A count of, and links to, the elements associated with the device
- Four instances of the Multi-series Performance Widget that display the following metrics trended over the specified period of time:
- Switch temperature
- Power consumption
- Power over Ethernet consumption
- Client count
