The following sections describe the device dashboards that are included in the Docker PowerPack and can be accessed in the SL1 classic user interface:
Device Dashboards
The Docker PowerPack includes device dashboards that provide summary information for Docker component devices. Each of the device dashboards in the Docker PowerPack is set as the default device dashboard for the equivalent device class.
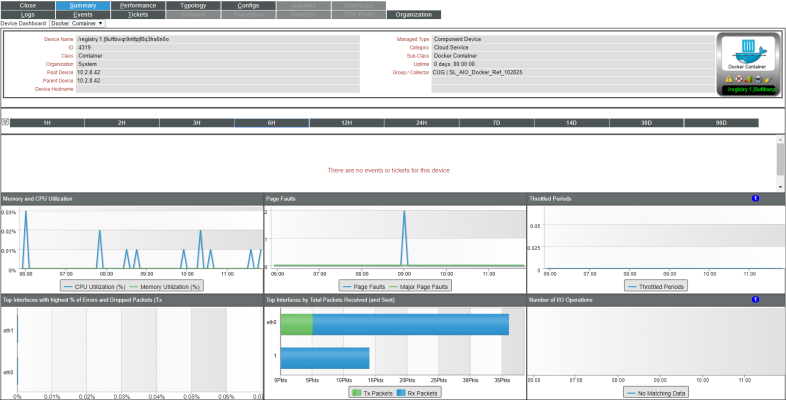
Docker: Container
The Docker: Container device dashboard displays the following information:
- Events and tickets for the device
- Memory and CPU utilization over a specified period of time
- Page faults over a specified period of time
- Throttled periods over a specified period of time
- Top interfaces with the highest percentage of errors and dropped packets over a specified period of time
- Top interfaces by total packets received over a specified period of time
- Number of input and output operations over a specified period of time
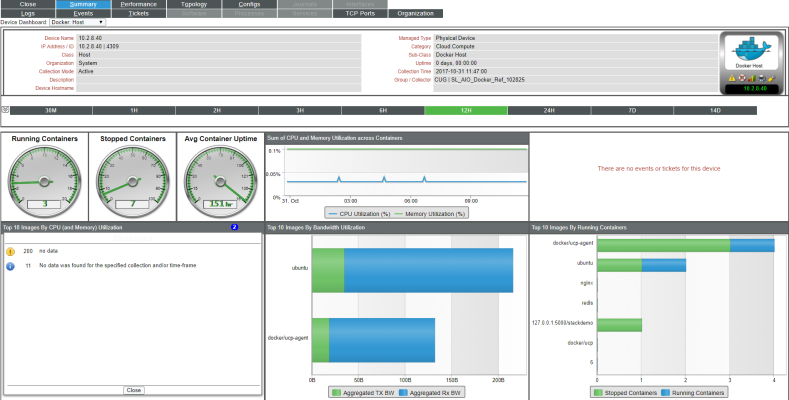
Docker: Host
The Docker: Host device dashboard displays the following information:
- Containers running and stopped over a specified period of time, as well as average container uptime
- Total CPU utilization and memory across all containers over a specified period of time
- Events and tickets for the device
- Top 10 images by CPU and memory utilization over a specified period of time
- Top 10 images by bandwidth utilization over a specified period of time
- Top 10 images by running containers over a specified period of time
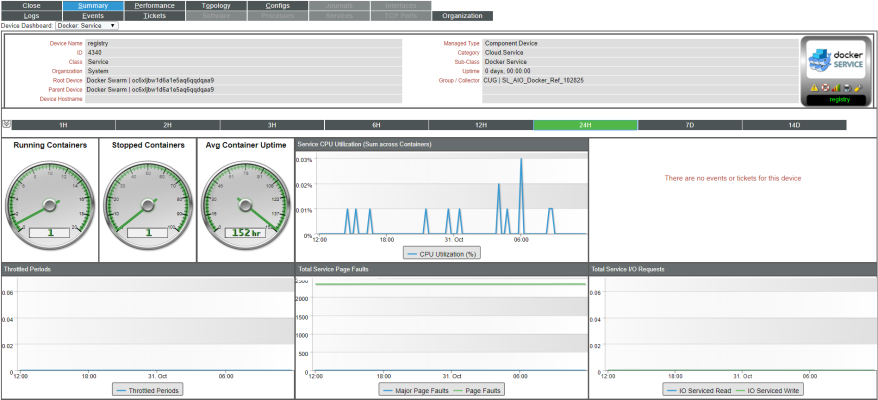
Docker: Service
The Docker: Service device dashboard displays the following information:
- Containers running and stopped over a specified period of time, as well as average container uptime
- Service CPU utilization over a specified period of time
- Events and tickets for the device
- Throttled periods over a specified period of time
- Top service page faults over a specified period of time
- Total service input and output requests over a specified period of time
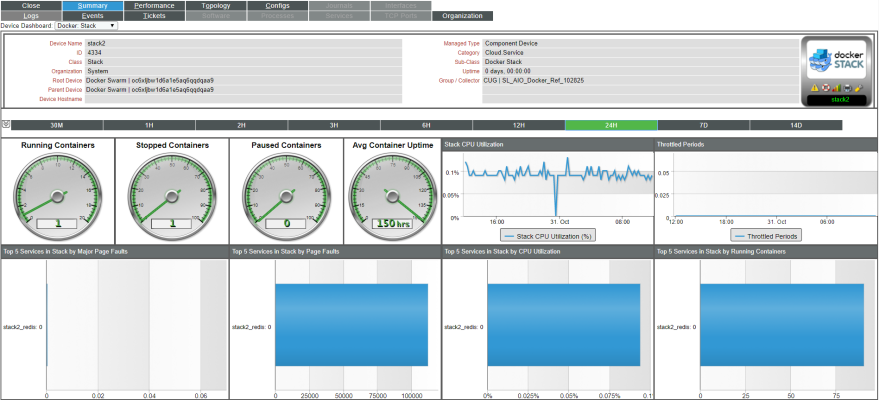
Docker: Stack
The Docker: Stack device dashboard displays the following information:
- Containers running, stopped, and paused over a specified period of time, as well as average container uptime
- Stack CPU utilization over a specified period of time
- Throttled periods over a specified period of time
- Top 5 services in the stack over a specified period of time, based on the number of major page faults
- Top 5 services in the stack over a specified period of time, based on the number of page faults
- Top 5 services in the stack over a specified period of time, based on CPU utilization
- Top 5 services in the stack over a specified period of time, based on the number of running containers
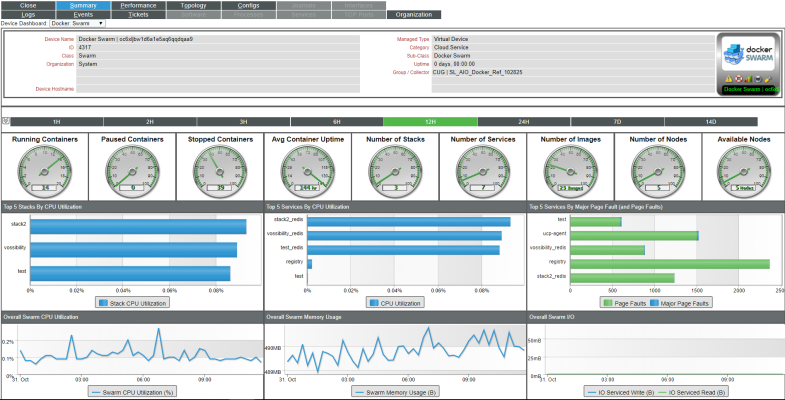
Docker: Swarm
The Docker: Swarm device dashboard displays the following information:
- Containers running, stopped, and paused over a specified period of time, as well as average container uptime
- Number of stacks, services, images, total nodes, and available nodes over a specified period of time
- Top 5 stacks in the swarm over a specified period of time, based on CPU utilization
- Top 5 services in the swarm over a specified period of time, based on CPU utilization
- Top 5 services in the swarm over a specified period of time, based on the number of major page faults and total page faults
- Overall swarm CPU utilization
- Overall swarm memory utilization
- Overall swarm input and output
