The following sections describe the dashboard that is included in the IBM: AIX Monitoring PowerPack:
IBM: AIX Server Dashboard
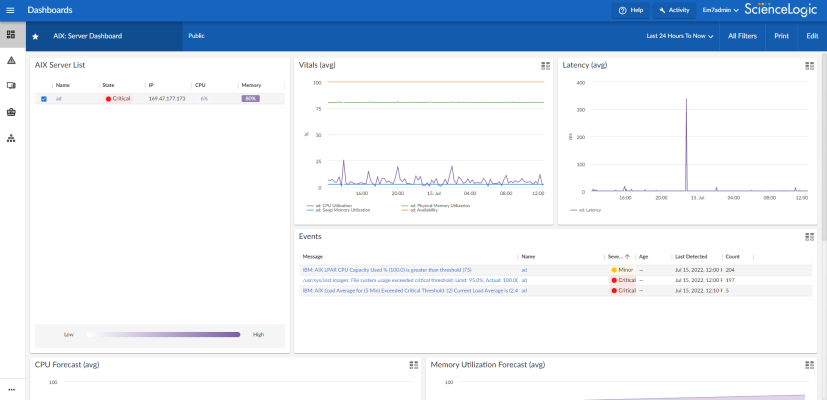
The IBM: AIX Server Dashboard displays the following widgets:
- AIX Server List. Displays a list of your monitored IBM AIX servers. You can select one or more IBM AIX server(s).
- Vitals (avg). Displays the averages of vitals for your selected IBM AIX server(s).
- Latency (avg). Displays the average latency of your selected IBM AIX server(s).
- Events. Displays a list of events associated with your selected IBM AIX server(s).
- CPU Forecast (avg). Displays the average CPU forecast in percent for your IBM AIX server(s).
- Memory Utilization Forecast (avg). Displays the average memory utilization forecast in percent for your IBM AIX server(s).
- AIX Filesystem Top-10. Displays a list of filesystems using the most data by percentage.
