The following sections describe the CloudWatch alarm Event Policies that are included in the Amazon Web Services PowerPack and information about configuring CloudWatch and SL1 to generate events based on CloudWatch alarms:
CloudWatch Alarm Event Policies
Amazon CloudWatch is a service that allows you to monitor your AWS resources and applications in near real-time. You can use CloudWatch to collect and track metrics, and use CloudWatch alarms to send notifications or automatically trigger changes to the resources being monitored based on rules that you define.
In addition to SL1 collecting metrics for AWS instances, you can configure CloudWatch to send alarm information to SL1 via API. SL1 can then generate an event for each alarm.
The Amazon Web Services PowerPack includes an "AWS :CloudWatch Alarms Performance" Dynamic Application. This Dynamic Application monitors CloudWatch alarms and associates the alarms with the appropriate AWS component devices, if applicable. If an appropriate component device does not exist in SL1 or cannot be determined, the alarm is instead associated with the component device for the AWS account.
The performance data collected by the "AWS: CloudWatch Alarms Performance" Dynamic Application is metadata intended to give general insight into the alarm activity the Dynamic Application is processing. This metadata can help identify overall trends, but users should be cautioned that the data presented can be imprecise in certain scenarios, such as when the Dynamic Application is being run in debug mode while data is still being collected.
The Amazon Web Services PowerPack also includes several pre-defined event policies for CloudWatch alarms:
| Alarm Type | Alarm State | Event Policy Name | Description | Event Source | Severity |
|---|---|---|---|---|---|
| Action | Failed | AWS: CloudWatchAlarm_Action_Failed | An Amazon CloudWatch alarm action has failed. | API | Major |
| Action | InProgress | AWS: CloudWatchAlarm_Action_InProgress | An Amazon CloudWatch alarm action is in progress. | API | Notice |
| Action | Succeeded | AWS: CloudWatchAlarm_Action_Succeeded | An Amazon CloudWatch alarm action has succeeded. | API | Notice |
| Configuration Update | Configuration Update | AWS: CloudWatchAlarm_ConfigurationUpdate | A ConfigurationUpdate alarm type is received. | API | Notice |
| Status Update | Alarm | AWS: CloudWatchAlarm_StateUpdate_Alarm | A CloudWatch alarm transitions to an "Alarm" state. | API | Major |
| Status Update | Insufficient Data | AWS: CloudWatchAlarm_StateUpdate_InsufficientData | A CloudWatch alarm transitions to an "Insufficient Data" state. | API | Notice |
| Status Update | OK | AWS: CloudWatchAlarm_StateUpdate_OK | A CloudWatch alarm transitions to an "OK" state. | API | Healthy |
These events are aligned to AWS Account component devices in the following way:
- If the CloudWatch alarm is configured on a device that is discovered in SL1, then the event in SL1 will be aligned with the component device for that instance.
- If the CloudWatch alarm is configured on a device that is either not discovered or not supported by CloudWatch, or if SL1 cannot determine a correct component device, then that alarm will be aligned to the Account component device.
The "AWS: CloudWatch Alarms Performance" Dynamic Application and related Event Policies are disabled by default. If you want SL1 to monitor CloudWatch alarms and generate events about them, you must enable the Dynamic Application and Event Policies. You must also configure the Dynamic Application to specify which types of alarms you want to monitor.
For more information about enabling and configuring the "AWS: CloudWatch Alarms Performance" Dynamic Application, see the Configuring the "AWS: CloudWatch Alarms Performance" Dynamic Application section. For more information about enabling the CloudWatch alarms Event Policies, see the Enabling CloudWatch Alarm Events in the ScienceLogic Platform section.
Because the AWS services make new data points available at varying time intervals, there might be a difference in the data points collected by SL1 when compared to data presented in CloudWatch at a given time. The difference between SL1 and CloudWatch is typically less than 1%.
If an event expires and the CloudWatch alarm in AWS is still in an "Alarm" state, SL1 will not generate any additional CloudWatch events unless that CloudWatch alarm changes states in AWS.
Creating Custom CloudWatch Metrics
A CloudWatch alarm watches a single metric and performs one or more actions based on the value of the metric relative to a threshold over a number of time periods. A CloudWatch metric consists of the following elements:
- A namespace, such as AWS/EC2
- A metric name, such as CPUUtilization
- A value, such as 42
- A dimension that identifies a particular resource instance, such as {'Name': 'InstanceId', 'Value': 'i-0a6a989bb8d57b074'}
For a complete list of supported CloudWatch Metrics and Dimensions, see https://docs.aws.amazon.com/AmazonCloudWatch/latest/monitoring/CW_Support_For_AWS.html.
The Amazon Web Services PowerPack uses the metric dimensions identified in an alarm to associate the alarm message to a particular ScienceLogic component device. The following table lists the services that are currently supported and the dimensions used to associate an alarm to a component device:
| AWS Service | Dimension |
|---|---|
| API Gateway |
'ApiName' | 'ApiName | Stage' NOTE: ScienceLogic recommends that you create API Gateways with unique names within the same region. |
| ApplicationELB | 'LoadBalancer' | 'TargetGroup' |
| CloudFront | 'DistributionId' |
| Direct Connect | 'ConnectionID' |
| DynamoDB | 'TableName' |
| EBS | 'VolumeId' |
| ECS | 'ClusterName' | 'ServiceName' |
| EC2 | 'InstanceId' | 'AutoScalingGroupName' |
| EKS Cluster | 'ClusterName' |
| ElasticBeanstalk | 'EnvironmentName' |
| ElastiCache |
'CacheClusterId' NOTE: Alarms for this service will be associated with the component device for the AWS account. |
| ElasticMapReduce | 'JobFlowId' |
| ELB | 'LoadBalancerName' |
| Glacier |
'VaultId' NOTE: This service is not supported by CloudWatch. You must define a custom metric and publish the metric to the CloudWatch service using an agent toolkit or the AWS command-line interface. |
| Lambda |
'FunctionName', 'Resource', 'Version', 'Alias', 'Executed Version' NOTE: Alarms "across all functions" for this service will be associated with the component device for the AWS account. Alarms "by function name" will be aligned to a specific Lambda function. |
| NetworkELB | 'LoadBalancer' | 'TargetGroup' |
| OpsWorks | 'StackId' | 'InstanceId' |
| RDS |
'DBInstanceIdentifier' NOTE: Alarms for this service will be associated with the component device for the AWS account. |
| Redshift |
'ClusterIdentifier' NOTE: Alarms for this service will be associated with the component device for the AWS account. |
| Route53 | 'HealthCheckId' |
| Shield |
'ShieldService' NOTE: CloudWatch alarms are available only for Shield Advanced Services. |
| SNS | 'TopicName' |
| SQS | 'QueueName' |
| StorageGateway | 'GatewayId' | 'VolumeId' |
| S3 | 'BucketName' |
| WAF | 'WebACLId' |
AWS enables users to create custom metrics for these services and then publish those metrics to CloudWatch using the AWS command-line interface (CLI) or an application programming interface (API). The Dynamic Applications in the Amazon Web Services PowerPack can then collect data for these custom AWS metrics (which are not in the "AWS" cloud namespace).
For the Amazon Web Services PowerPack to collect data for these custom metrics, you must enable certain Dynamic Applications that are disabled by default. For more information, see the Enabling Custom Metrics Collection in the ScienceLogic Platform section.
When creating a custom metric, it is important that the metric is correctly formed. For SL1 to align a custom metric to a particular ScienceLogic component device, the following must be true:
- The metric namespace must include the service being tracked.
For example, MyVendorName/EC2 would be a valid namespace that the Amazon Web Services PowerPack could use to identify the EC2 service for a tracked metric.
- The dimension must include one or more of the dimensions listed in the preceding table. The dimension enables SL1 to identify which device to associate with the alarm.
For example, if the dimension included {'Name': 'InstanceId', 'Value': 'i-0a6a989bb8d57b074'}, this would identify the EC2 component. Other dimensions are permitted, but 'InstanceId' is necessary to locate the EC2 instance.
If the component device was an AutoScaleGroup component that is also under the EC2 service, then the dimension might look like this: {'Name': 'AutoScalingGroupName', 'Value': 'Y1Z55ZJ390UP'}.
If the CloudWatch event cannot align to a particular ScienceLogic component device, it will instead align to the component device for the AWS account.
Configuring CloudWatch to Send Alarms for a Metric
To configure CloudWatch to send alarms to SL1 for a metric, perform the following steps:
- Open a browser session and go to aws.amazon.com.
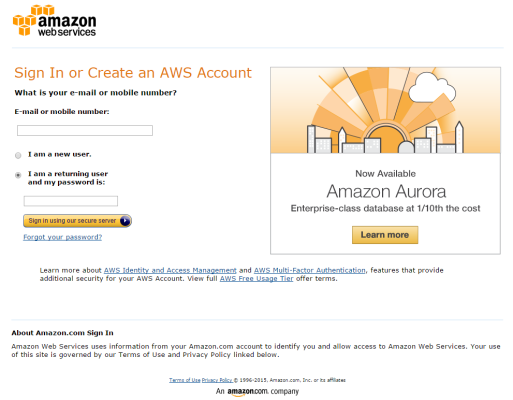
- Click and then select AWS Management Console. If you are not currently logged in to the AWS site, you will be prompted to log in:
- In the AWS Management Console, under the Management Tools heading, click .
- Click the button.
- Select the metric for which you want CloudWatch to send alarms.
- Select the instances for which you want CloudWatch to send alarms for this metric.
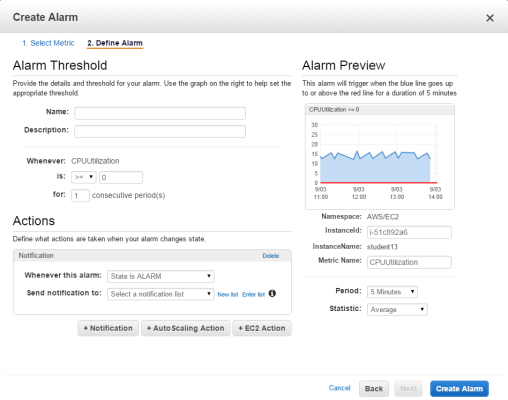
- Click the button. The Create Alarm page is displayed:
- Specify a Name and Description for the alarm.
- If you have previously configured an alarm for SL1, select the notification list for SL1 in the Send notification to field. Otherwise, select the link to the right of the Send notification to field and supply values in the following fields:
- Send notification to. Enter a name for the new notification list. If you add additional alarms, you can select the name you enter in this field instead of re-entering the email address.
- Email list. Enter the email address to which you want CloudWatch notifications sent.
- Supply values in the other fields in this page as desired.
- Click the button.
- Log in to the email account you configured to receive email from the email alias.
- Open the confirmation email from Amazon and click the link.
Enabling Custom Metrics Collection in SL1
AWS enables users to publish their own custom metrics to CloudWatch using the AWS command-line interface (CLI) or an application programming interface (API). The Amazon Web Services PowerPack includes Dynamic Applications that collect data for custom AWS metrics (which are not in the "AWS" cloud namespace). However, these Dynamic Applications are disabled by default and must be enabled for use.
To enable these Dynamic Applications:
- Go to the Dynamic Applications Manager page (System > Manage > Applications).
- Click the wrench icon (
 ) for the "AWS: Custom Metrics" Dynamic Application. The Dynamic Applications Properties Editor page appears.
 - In the Operational State field, select Enabled.
- Click the button.
- Repeat steps 1 - 4 for the "AWS: Custom Metrics Cache" Dynamic Application.
Configuring the "AWS: CloudWatch Alarms Performance" Dynamic Application
The Amazon Web Services PowerPack includes an "AWS: CloudWatch Alarms Performance" Dynamic Application that monitors CloudWatch alarms and associates the alarms with the appropriate AWS component devices, if applicable. This Dynamic Application must be enabled if you want SL1 to generate CloudWatch alarm events.
If an appropriate component device does not exist in SL1 or cannot be determined, the alarm is instead associated with the "Account" component device.
To enable the "AWS: CloudWatch Alarms Performance" Dynamic Application:
- Go to the Dynamic Applications Manager page (System > Manage > Applications).
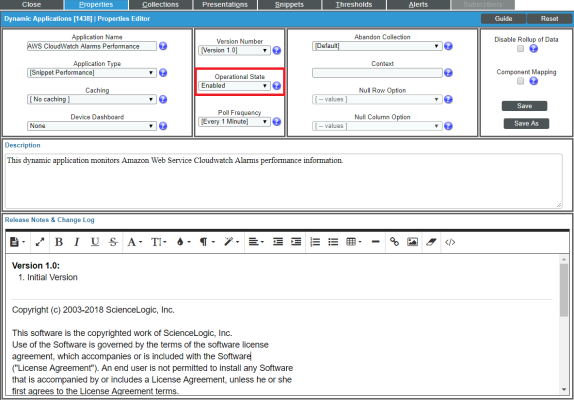
- Locate the "AWS: CloudWatch Alarms Performance" Dynamic Application and then click its wrench icon (
 ). The Dynamic Applications Properties Editor page appears.
- In the Operational State field, select Enabled.
- Click .
By default, the "AWS: CloudWatch Alarms Performance" Dynamic Application monitors only the "StateUpdate" type of CloudWatch alarms. If you want the Dynamic Application to also monitor "Action" and "ConfigurationUpdate" alarm types, you must configure the Dynamic Application to do so.
To configure the "AWS: CloudWatch Alarms Performance" Dynamic Application to monitor all CloudWatch alarm types:
- Go to the Dynamic Applications Manager page (System > Manage > Applications).
- Locate the "AWS: CloudWatch Alarms Performance" Dynamic Application and then click its wrench icon (
 ). The Dynamic Applications Properties Editor page appears.
 - Click the tab. The Collection Objects page appears.
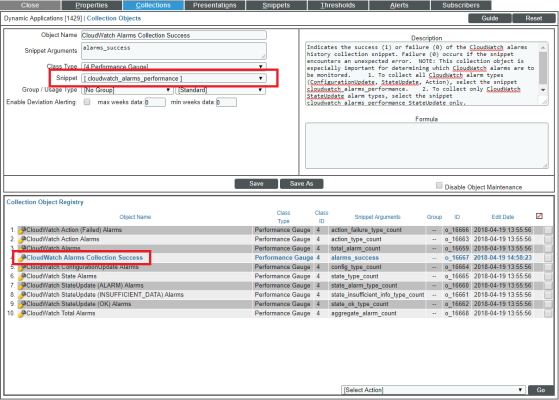
- On the Collection Objects page, locate the "CloudWatch Alarms Collection Success" collection object and then click its wrench icon (
 ).
).
- In the Snippet field, select one of the following options:
- cloudwatch_alarms_performance. This option is selected by default. This snippet triggers notifications if any alarm configuration is modified.
- cloudwatch_alarms_performance_StateUpdate_only. This snippet will only trigger events for State Update alarms.
- cloudwatch_alarms_statistics. This snippet will trigger events for all CloudWatch alarm types (Action, Configuration Update, and State Update).
If you want to revert back to monitoring only the "StateUpdate" CloudWatch alarms, then select cloudwatch_alarms_performance_StateUpdate_only in the Snippet field.
- Click . This Dynamic Application will be executed every 1 minute.
Enabling CloudWatch Alarm Events in SL1
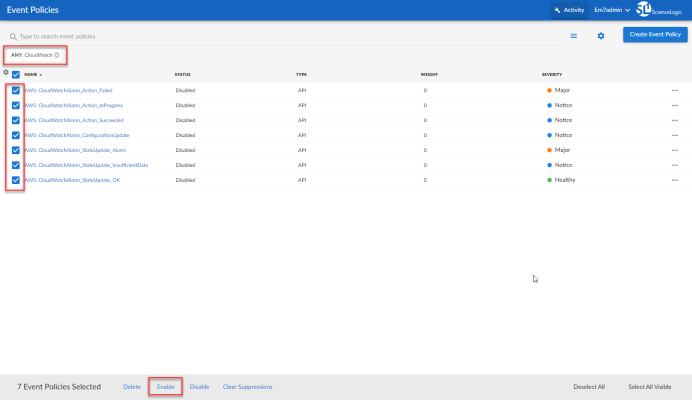
The Amazon Web Services PowerPack also includes several pre-defined event policies for CloudWatch alarms. These Event Policies must be enabled if you want SL1 to generate CloudWatch alarm events.
To enable the CloudWatch alarms Event Policies:
- Go to the Event Policies page (Events > Event Policies).
- Perform a search for "CloudWatch".
- Select the check boxes for the events you want to enable.
- Select Enable at the bottom of the screen.
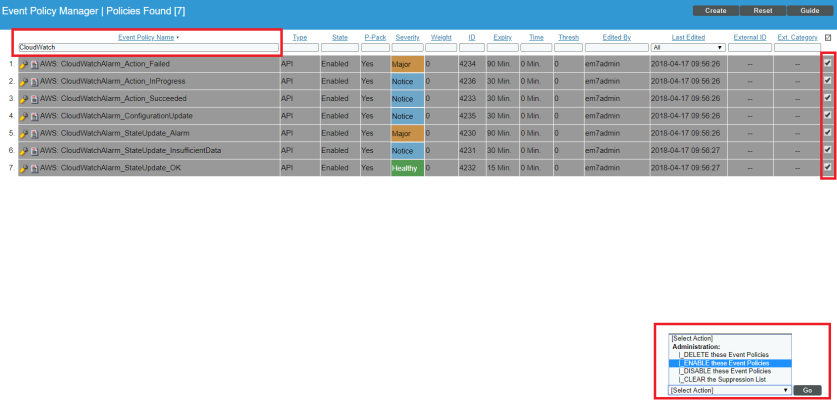
To enable the CloudWatch alarms Event Policies in the SL1 classic user interface:
- Go to the Event Policy Manager page (Registry > Events > Event Manager).
- In the Event Policy Name filter-while-you-type field, type "CloudWatch".
- Select the check boxes for the events you want to enable.
- In the Select Action drop-down field, select ENABLE these Event Policies.
- Click .
Preserving CloudWatch Alarm Event Changes
If you have modified CloudWatch alarm event policies that are included in the Amazon Web Services PowerPack, those changes will be overwritten when the PowerPack is updated in your system. If you have modified event policies that are included in the PowerPack, you can:
- Re-implement those changes after each update of the Amazon Web Services PowerPack.
- Remove the content from the PowerPack on your system. When the Amazon Web Services PowerPack is updated in your system, updated versions of this content will not be installed on your system and your local changes will be preserved.
To remove event policies from the Amazon Web Services PowerPack on your system:
- Go to the PowerPack Manager page (System > Manage > PowerPacks).
- Click the wrench icon (
 ) for the Amazon Web Services PowerPack. The Editing PowerPack page appears.
 - In the left NavBar of the Editing PowerPack page, click . The Embedded Event Policies and Available Event Policies panes appear.
- In the upper pane, click the bomb icon (
 ) for each event policy that you want to remove from the Amazon Web Services PowerPack on your system.
