Machine Learning-based Anomaly Detection
To use machine learning-based anomaly detection on the SL1 Extended Architecture, you must enable the Collector Pipeline to collect data from Performance Dynamic Applications. For more information, see
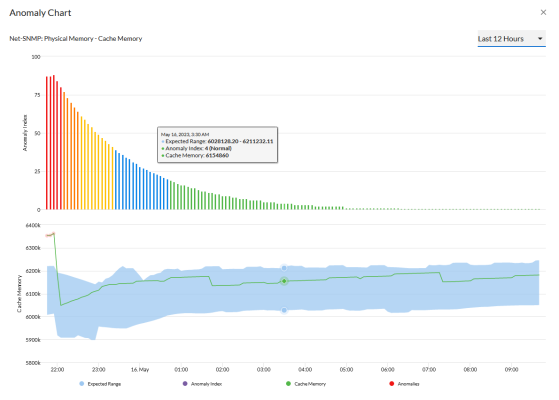
The following image shows the Anomaly Chart modal, which includes the "Anomaly Index", which displays a graph of values from 0 to 100 that represent how far the real data for a metric diverges from its normal patterns. The modal also displays a corresponding timeline chart with possible anomalies that are above or below the expected range for that metric.
