The IT Service Summary page allows you to view one or more dashboards that have been configured for the selected IT Service. A dashboard is a page that displays one or more graphical reports, called widgets. Each widget is displayed in its own page.
SL1 includes a default IT Service dashboard that displays general information that is available for all IT Services. You can create additional IT Service dashboards that can be made available in the IT Service Summary for one, multiple, or all IT Services.
Use the following menu options to navigate the SL1 user interface:
- To view a pop-out list of menu options, click the menu icon (
 ).
). - To view a page containing all of the menu options, click the Advanced menu icon (
 ).
).
Viewing the List of IT Service Dashboards
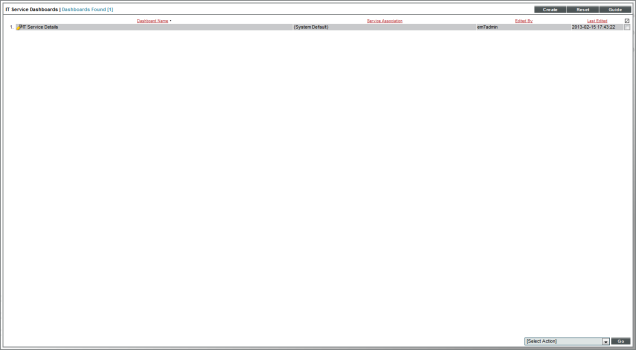
The IT Service Dashboards page (Registry > IT Services > IT Service Dashboards) displays the following about each IT Service dashboard in your SL1 system:
To sort the list of dashboards, click on a column heading. The list will be sorted by the column value, in ascending order. To sort by descending order, click the column heading again. The Last Edited column sorts by descending order on the first click; to sort by ascending order, click the column heading again.
- Dashboard Name. Name of the dashboard.
- Service Association. Specifies the IT Services associated with this dashboard. If a dashboard is associated with an IT Service, the dashboard can be viewed in the IT Service Summary page for that IT Service. The possible values in this field are:
- System Default. The dashboard is associated with all IT Services and is displayed when the IT Service Summary page loads.
- All Services. The dashboard is associated with all IT Services.
- Selected Services. The dashboard is associated with multiple, but not all, IT Services.
- The name of a specific IT Service. The dashboard is associated with only the IT Service specified in this field.
- Edited By. User who created or last edited the dashboard.
- Last Edited. Date and time the dashboard was created or last edited.
Creating an IT Service Dashboard
To create an IT Service dashboard:
- Go to the IT Service Dashboards page (Registry > IT Services > IT Service Dashboards).
- Select the button.
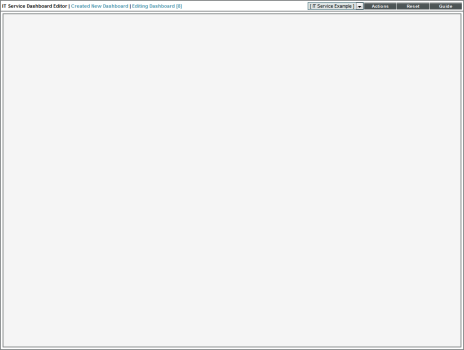
- The IT Service Dashboard Editor page is displayed:
- The following sections describe how to configure an IT Service dashboard.

Configuring Dashboard Settings
If you want to edit the name, layout, or IT Service association for an IT Service dashboard, you can edit the general settings for that dashboard. To do this from the IT Service Dashboard Editor page:
- Select the menu and choose Configure dashboard....
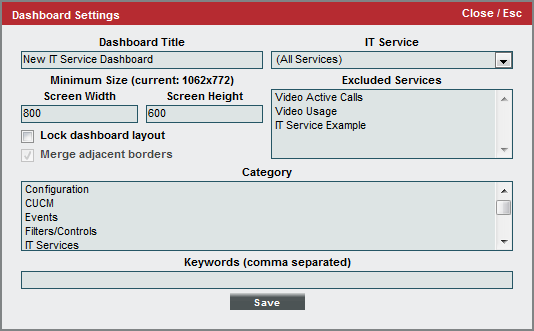
- In the Dashboard Settings modal page, supply a value in the following fields:
- Dashboard Title. Enter a name for the dashboard. This name is displayed in the Select Dashboard field in the top-left of the IT Service Summary page.
- Screen Width. Enter the minimum screen width required to view the whole dashboard at once. If a user views the dashboard at a resolution that has a smaller screen width than the value in this field, a horizontal scroll bar will be displayed. For convenience, the current size of the dashboard as viewed in your monitor is displayed in parentheses above the Screen Width and Screen Height fields.
- Screen Height. Enter the minimum screen height required to view the whole dashboard at once. If a user views the dashboard at a resolution that has a smaller screen height than the value in this field, a vertical scroll bar will be displayed. For convenience, the current size of the dashboard as viewed in your monitor is displayed in parentheses above the Screen Width and Screen Height fields.
- Lock Dashboard Layout. Select this checkbox to prevent the dashboard from being edited. When this checkbox is selected, a user viewing the dashboard cannot add, move, or modify widgets while viewing the dashboard. To edit a dashboard that has the Lock Dashboard Layout checkbox selected, a user must access the Dashboard Settings page and uncheck the Lock Dashboard Layout checkbox. This option is most useful for preventing users from accidentally modifying a dashboard.
- Merge Adjacent Borders. If the Lock Dashboard Layout checkbox is selected, this option is available. If you select this checkbox, widgets that appear next to each other will share a border. If this checkbox is not selected, a gap appears between each widget. If this checkbox is selected, the borders of adjacent widgets are merged.
- IT Service. Select how this dashboard will be associated with IT Services. If a dashboard is associated with an IT Service, the dashboard can be viewed in the IT Service Summary page for that IT Service. Choices are:
- All Services. Select this option to associate the dashboard with all IT Services. You can optionally select one or more IT Services that will be excluded from this association in the Excluded Services field.
- Selected Services. Select this option to associate the dashboard with multiple, but not all, IT Services. If you select this option, select one or more IT Services to associate with this dashboard in the Included Services field.
- The name of a specific IT Service. Select a single IT Service to associate with the dashboard.
- Category. Select one or more categories to associate with the dashboard. To select multiple categories, hold down the <Ctrl> key (or Command on Apple computers) when you select the categories.
- Keywords (comma separated). Enter a comma-delimited list of keywords to associate with the dashboard.
- Select the button to save your changes to the dashboard settings.

Context in IT Service Dashboards
The context of a dashboard is a set of values that control what is displayed in one or more widgets on the dashboard. Widgets can be configured to:
- Define the context, by allowing a user to select one or more values.
- Read the context, by updating to include only information about the selected values.
- Both define and read the context.
When a user views an IT Service dashboard in the IT Service Summary page, the selected IT Service is automatically defined in the context, i.e. all widgets in the dashboard that are configured to read the context will automatically include only information about the selected IT Service.
For example, suppose an instance of the Leaderboard/Top-N widget is included on an IT Service dashboard. Suppose that in the Widget Configuration page for the widget, the Use Device-related Context checkbox is selected. If you view the IT Service dashboard in the IT Service Summary page for an IT Service, the Leaderboard/Top-N widget will include only devices in that IT Service. If the IT Service dashboard is configured to display for multiple IT Services, the Leaderboard/Top-N widget will display different data for each IT Service.
Adding Widgets to a Dashboard
To add a widget to an IT Service dashboard from the IT Service Dashboard Editor page left-click and drag with your mouse to draw a rectangle in the main dashboard pane. This shape will determine the initial size and position of the widget in your dashboard.
- On the Classic Dashboards page (Dashboards > Classic Dashboards), in the selection field in the upper left of the page, select the dashboard to which you want to add a widget.
- Click the button, and then select Add Widget.
Or:
- On the Classic Dashboards page (Dashboards > Classic Dashboards), in the selection field in the upper left of the page, select the dashboard to which you want to add a widget.
- In the Dashboards tab page, left-click and drag with your mouse to draw a rectangle. This shape will determine the initial size and position of the widget in your dashboard.
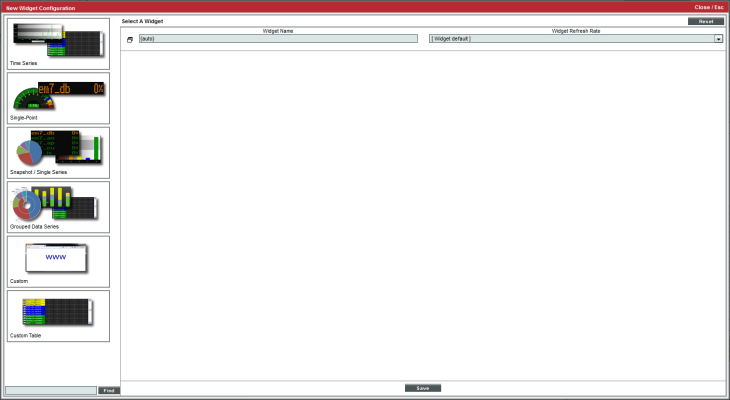
- The New Widget Configuration modal page is displayed:
-
To configure a new widget, use the left NavBar to navigate to the widget you want to include in the dashboard.
If you are editing an existing widget, the Widget Configuration page displays the configuration panel for the widget with the left NavBar and data type selection buttons automatically hidden. If you want to select a new widget, you can show the left NavBar and data type selection buttons by clicking the window icon to the left of the Widget Name field.
- The left NavBar includes an icon for each type of data that can be displayed in a widget:
- . Expands a list that includes widgets that display one or more metrics over time.
- . Expands a list that includes widgets that display a single metric.
- . Expands a list that includes widgets that display single instances of a metric for multiple entities.
- . Expands a list that includes widgets that display a single metric for multiple entities, with each metric sub-divided between multiple entities of another types. For example, a grouped data series could display a bar graph of the number of tickets in each state, with each bar in the graph divided by organization.
- . Expands a list that includes widgets that display custom HTML content.
- . Expands a list that includes widgets that display tabular data.
- When you expand the list of widgets that display a type of data, the NavBar displays a list of categories that are associated with the widget definitions in your system. You can expand a category to view the list of all widgets associated with that category. If a widget is associated with multiple categories, the widget will appear under each category it is associated with.
- You can search the list of widgets by entering a search term in the field that appears in the bottom-left of the page. When you click the button, the widgets that have a name or associated keywords that match your search term are highlighted in the left NavBar. The categories in the left NavBar will be automatically expanded and collapsed so that only categories that include a matching widget are expanded.
-
When you select a widget in the left NavBar, the right pane of the Widget Configuration page displays the configuration fields for the selected widget. Each widget definition has a different list of configuration fields.
After you select a widget, you can hide the left NavBar and data type selection buttons by selecting the window icon to the left of the Widget Name field.
- The following fields appear in all widget configuration panes:
- Widget Name. Enter a title for the widget. This title is displayed in the header that appears at the top of the widget. If you leave the default value of "{auto}" in this field, SL1 will automatically generate a title for the widget based on what is currently being displayed in the widget.
- Widget Refresh Rate. Specify how frequently the widget will be automatically updated with new data. The choices are:
- Widget Default. The widget will refresh at its default refresh rate, as defined by the widget developer. You can view and edit the default refresh rate in the Dashboard Widgets page (System > Customize > Dashboard Widgets) by clicking the wrench icon (
 ) for a widget.
- Auto-refresh disabled. The widget will not automatically refresh.
- 1 minute. The widget will automatically refresh every minute.
- 5 minutes. The widget will automatically refresh every 5 minutes.
- 10 minutes. The widget will automatically refresh every 10 minutes.
- 15 minutes. The widget will automatically refresh every 15 minutes.
- 30 minutes. The widget will automatically refresh every 30 minutes.
- 45 minutes. The widget will automatically refresh every 45 minutes.
- 1 hour. The widget will automatically refresh once an hour.
- Create Template. When selected, this checkbox allows you to save the current configuration as a Quick-Add option.
- Each widget contains additional fields.
NOTE: In widgets that allow you to filter the list of devices by the device class or device category, merged devices include special behavior. For merged devices, you can select either the device class or device category of the physical device or the device class or device category of the component device. If both device classes or device categories are selected, a merged device will appear twice in a single widget.
SL1 includes several widgets that are specifically designed for IT Service dashboards. The configuration panels for these widgets include only the default fields in the Widget Configuration page. These widgets always read the IT Service value from the dashboard context. The widgets for IT Services are:
- IT Service Details. Displays the following information about an IT Service:
- Service Name
- Service Owner
- Service Visibility
- Maintenance State
- Service Health
- Service Availability
- Service Risk
- IT Service Vitals. Displays the current value for each Key Metric defined for an IT Service.
- IT Service Problem Management. Displays the number of logs, active events, and active tickets associated with an IT Service.
- IT Service Health Last 12 Hours. Displays a graph of the Availability metric. The y-axis displays percent availability. The x-axis displays time in one-hour increments.
- IT Service Activity Log. Displays a list of all current and past alerts and events associated with an IT Service.
You can also use any other widgets that are installed in your SL1 system in an IT Service dashboard. For a description of the other default widgets supplied by ScienceLogic,
For example, suppose that on an IT Service dashboard that will be used for multiple IT Services, you want to include a line graph that displays the Health, Availability, and Risk values for an IT Service over time. To do this, you would add an instance of the Multi-series Performance widget to the IT Service dashboard. To ensure that the widget displays only information about the IT Service for which a user is viewing the dashboard, you would make the following selections for the Series Selections option in the configuration panel for the Multi-series Performance widget:
- Type. Select IT Service.
- Element. Select Contextual Service 1. Selecting this option tells the widget to read the IT Service value that is set in the context.
- Collection. Select Service Availability. The widget will display the availability values for the IT Service that is set in the context.
To add Service Health and Service Risk values to the graph, you can select the Add another series button, select the same Type and Element values, and then select the appropriate value in the Collection field.
Editing the Widgets in a Dashboard
You can edit the size and position of the widgets in a dashboard by manipulating the pane in which that widget appears:
- To move a widget, click and hold on the header of the widget, then drag the widget to a new position on the dashboard.
- To resize a widget, click and hold on the border of the widget, then drag the border to adjust the size.
Each widget has an options menu that appears in the top-right corner of the widget. The widget options menu includes the following options for editing a widget:
- Configure. Leads to the Widget Configuration modal page, where you can edit the parameters of the widget.
- Copy To.... Leads to the Copy Widget modal page, where you can copy the widget to another dashboard. To copy the widget to another dashboard, select the dashboard you want to copy the widget to in the Copy Widget To drop-down list and select the button.
- Lower. If widgets are stacked on top of each other in the dashboard, this option sends the widget to the bottom of the stack.
- Duplicate. Creates a copy of the widget in the current dashboard, using the same widget definition and same parameters as the original widget.
- Remove. Deletes the widget from the dashboard.
Setting a Dashboard as the System Default Dashboard
In SL1, there is always a default dashboard for IT Services. The default dashboard is initially displayed when a user views the IT Service Summary page. The default IT Service dashboard must be visible for all IT Services. If the dashboard you want to set as the default is not currently visible for all IT Services, perform the following steps from the IT Service Dashboard Editor page for that dashboard:
- Select the menu and choose Configure dashboard....
- In the Dashboard Settings modal page, select All Services in the IT Service field.
- Select the button.
After you have configured the dashboard to be visible for all IT Services, select the menu in the IT Service Dashboard Editor page and choose Set as system default.
Editing an IT Service Dashboard
To edit an IT Service dashboard:
- Go to the IT Service Dashboards page (Registry > IT Services > IT Service Dashboards).
- Find the IT Service dashboard you want to edit. Select its wrench icon (
 ).
). - The IT Service Dashboard Editor page is displayed. For a description of the IT Service Dashboard Editor page, see the Creating an IT Service Dashboard section.
Deleting an IT Service Dashboard
To delete one or more IT Service dashboards:
- Go to the IT Service Dashboards page (Registry > IT Services > IT Service Dashboards).
- Find the IT Service dashboard you want to delete. Select its checkbox.
- Select the checkbox for each IT Service dashboard you want to delete.
- Go to the Select Action field in the lower right of the page. Select Delete Dashboards. Select the button.
- Each selected IT Service dashboard is removed from SL1.

