The following sections describe the device dashboards that are included in the Cisco: Contact Center Enterprise PowerPack.
Device Dashboards
The Cisco: Contact Center Enterprise PowerPack includes device dashboards that provide summary information for Contact Center Enterprise component devices. The following device dashboards in the Cisco: Contact Center Enterprise PowerPack are aligned as the default device dashboard for the equivalent device class.
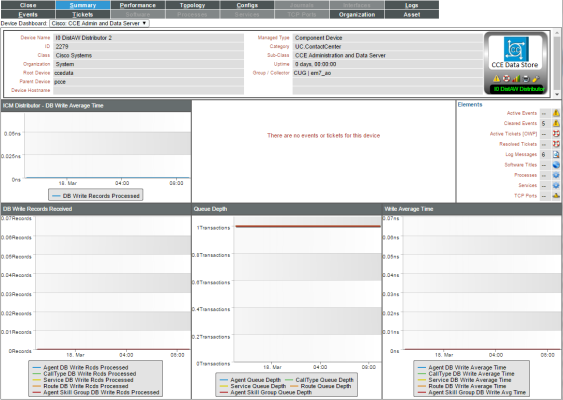
Cisco: CCE Admin and Data Server
The Cisco: CCE Admin and Data Server device dashboard displays the following information:
- The basic information about the device
- A list of active events and open tickets associated with the device
- A count of, and links to, the elements associated with the device
- Four instances of the Multi-series Performance Widget that display the following metrics trended over the last 12 hours:
- DB Write Average Time
- DB Write Records Processed
- Queue Depth
- Write Average Time
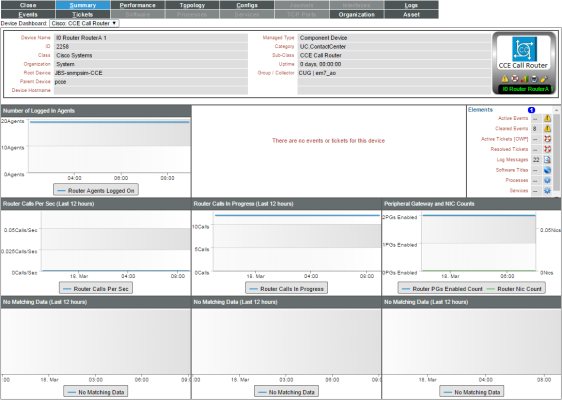
Cisco: CCE Call Router
The Cisco: CCE Call Router device dashboard displays the following information:
- The basic information about the device
- A list of active events and open tickets associated with the device
- A count of, and links to, the elements associated with the device
- Seven instances of the Multi-series Performance Widget that display the following metrics trended over the last 12 hours:
- Number of Logged In Agents
- Router Calls Per Sec
- Calls In Router and Calls In Queue
- Router Calls In Progress
- Pending PQA Agent Count
- Peripheral Gateway and NIC Counts
- Pending PQ Count
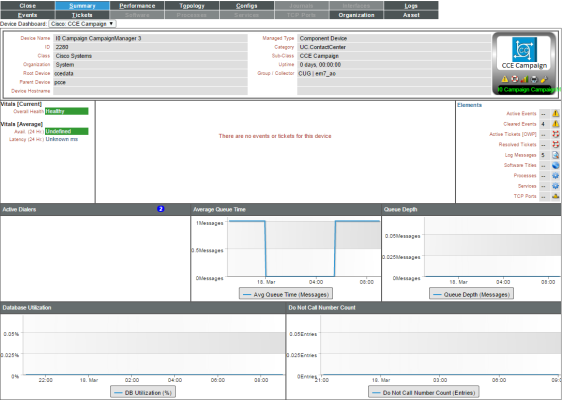
Cisco: CCE Campaign
The Cisco: CCE Campaign device dashboard displays the following information:
- The basic information about the device
- The current health, availability, and latency for the device
- A list of active events and open tickets associated with the device
- A count of, and links to, the elements associated with the device
- Five instances of the Multi-series Performance Widget that display the following metrics trended over the last 12 hours:
- Active Dialers
- Average Queue Time
- Queue Depth
- Database Utilization
- Do Not Call Number Count
Cisco: CCE CTI Gateway
The Cisco: CCE CTI Gateway device dashboard displays the following information:
- The basic information about the device
- The current health, availability, and latency for the device
- A list of active events and open tickets associated with the device
- A count of, and links to, the elements associated with the device
- Four instances of the Multi-series Performance Widget that display the following metrics trended over the last 12 hours:
- Talking Agents
- Ready Agent Count and Logged In Agent Count
- Session Counts - Open and Total Sessions
- Session Counts - Failed, Closed and Unknown Sessions
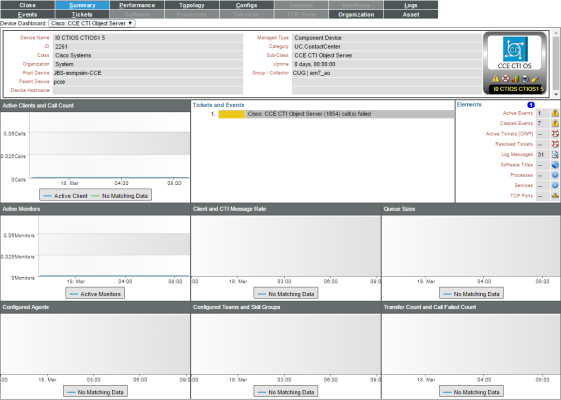
Cisco: CCE CTI Object Server
The Cisco: CCE CTI Object Server device dashboard displays the following information:
- The basic information about the device
- A list of active events and open tickets associated with the device
- A count of, and links to, the elements associated with the device
- Seven instances of the Multi-series Performance Widget that display the following metrics trended over the last 12 hours:
- Active Clients and Call Count
- Active Monitors
- Configured Agents
- Client and CTI Message Rate
- Configured Teams and Skill Group
- Queue Sizes
- Transfer Count and Call Failed Count
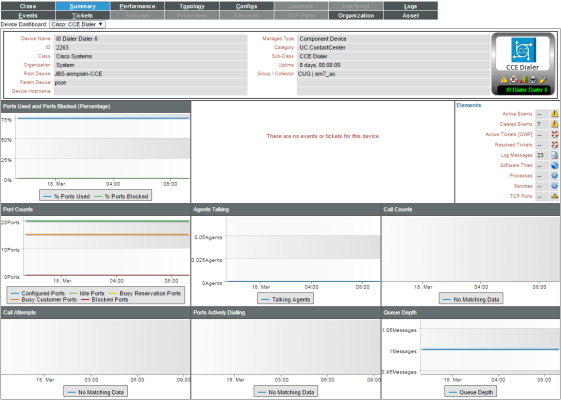
Cisco: CCE Dialer
The Cisco: CCE Dialer device dashboard displays the following information:
- The basic information about the device
- A list of active events and open tickets associated with the device
- A count of, and links to, the elements associated with the device
- Seven instances of the Multi-series Performance Widget that display the following metrics trended over the last 12 hours:
- Ports Used and Ports Blocked
- Port Counts
- Call Attempts
- Agents Talking
- Ports Actively Dialing
- Call Counts
- Queue Depth
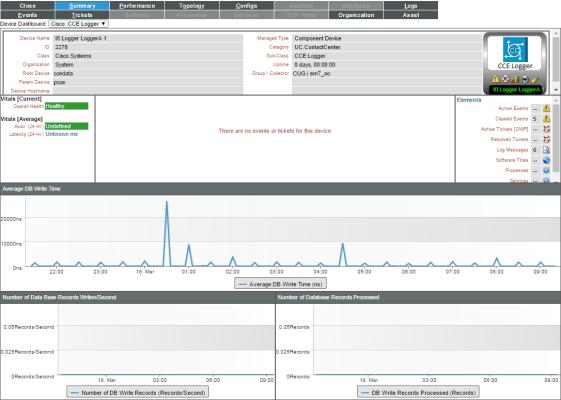
Cisco: CCE Logger
The Cisco: CCE Logger device dashboard displays the following information:
- The basic information about the device
- The current health, availability, and latency for the device
- A list of active events and open tickets associated with the device
- A count of, and links to, the elements associated with the device
- Three instances of the Multi-series Performance Widget that display the following metrics trended over the last 12 hours:
- Average DB Write Time
- Number of Database Records Written/Second
- Number of Database Records Processed
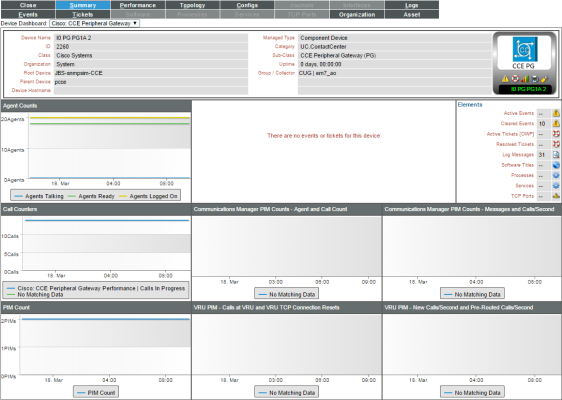
Cisco: CCE Peripheral Gateway
The Cisco: CCE Peripheral Gateway device dashboard displays the following information:
- The basic information about the device
- A list of active events and open tickets associated with the device
- A count of, and links to, the elements associated with the device
- Seven instances of the Multi-series Performance Widget that display the following metrics trended over the last 12 hours:
- Agent Counts
- Call Counters
- PIM Count
- Communications Manager PIM Counts (Agent and Call Counts)
- Communications Manager PIM Counts (Messages/sec and Calls/Second)
- VRU PIM - Calls at VRU and VRU TCP Connection Resets
- VRU PIM - New Calls/Second and Pre-Routed Calls/Second
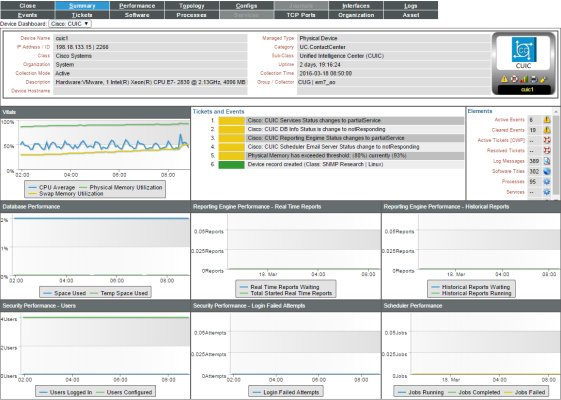
Cisco: CUIC
The Cisco: CUIC device dashboard displays the following information:
- The basic information about the device
- A list of active events and open tickets associated with the device
- A count of, and links to, the elements associated with the device
- Seven instances of the Multi-series Performance Widget that display the following metrics trended over the last 12 hours:
- Vitals
- Database Performance
- Security Performance - Users
- Reporting Engine Performance - Real Time Reports
- Security Performance - Login Failed Attempts
- Reporting Engine Performance - Historical Reports
- Scheduler Performance
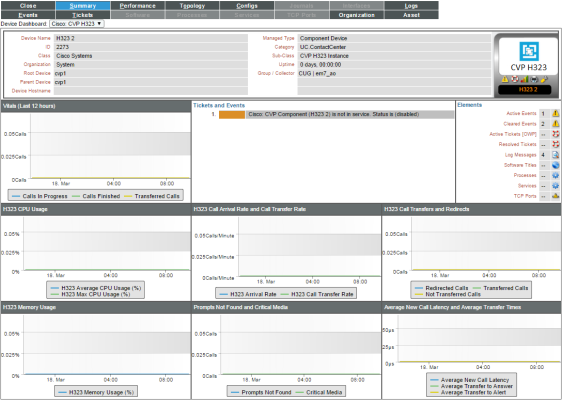
Cisco: CVP H323
The Cisco: CVP H323 device dashboard displays the following information:
- The basic information about the device
- A list of active events and open tickets associated with the device
- A count of, and links to, the elements associated with the device
- Seven instances of the Multi-series Performance Widget that display the following metrics trended over the last 12 hours:
- Vitals
- H323 CPU Usage
- H323 Memory Usage
- H323 Call Arrival Rate and Call Transfer Rate
- Prompts Not Found and Critical Media
- H323 Call Transfers and Redirects
- Average New Call Latency
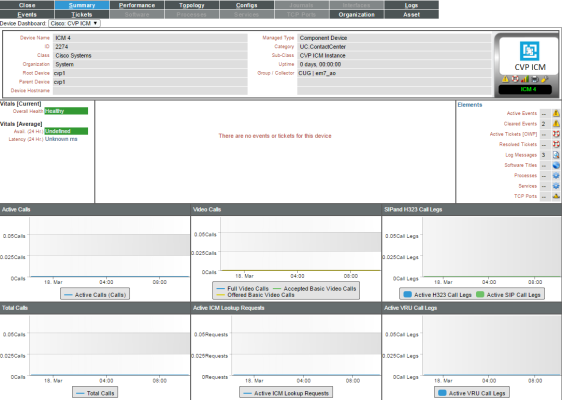
Cisco: CVP ICM
The Cisco: CVP ICM device dashboard displays the following information:
- The basic information about the device
- The current health, availability, and latency for the device
- A list of active events and open tickets associated with the device
- A count of, and links to, the elements associated with the device
- Six instances of the Multi-series Performance Widget that display the following metrics trended over the last 12 hours:
- Active Calls
- Total Calls
- Video Calls
- Active ICM Lookup Requests
- SIP and H323 Call Legs
- Active VRU Call Legs
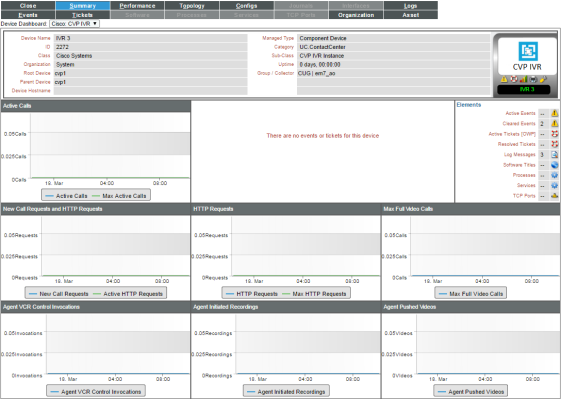
Cisco: CVP IVR
The Cisco: CVP IVR device dashboard displays the following information:
- The basic information about the device
- A list of active events and open tickets associated with the device
- A count of, and links to, the elements associated with the device
- Seven instances of the Multi-series Performance Widget that display the following metrics trended over the last 12 hours:
- Active Calls
- New Call Requests and HTTP Requests
- Agent VCR Control Invocations
- HTTP Requests
- Agent Initiated Recording
- Max Full Video Calls
- Agent Pushed Video
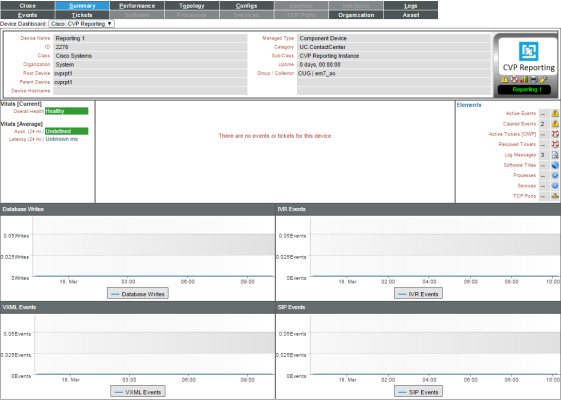
Cisco: CVP Reporting
The Cisco: CVP Reporting device dashboard displays the following information:
- The basic information about the device
- The current health, availability, and latency for the device
- A list of active events and open tickets associated with the device
- A count of, and links to, the elements associated with the device
- Four instances of the Multi-series Performance Widget that display the following metrics trended over the last 12 hours:
- Database Writes
- VXML Events
- IVR Events
- SIP Events
Cisco: CVP SIP
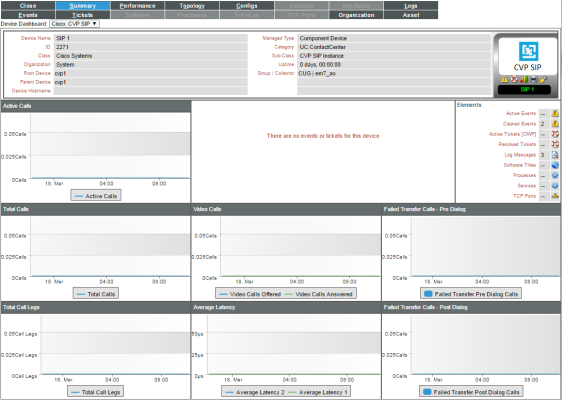
The Cisco: CVP SIP device dashboard displays the following information:
- The basic information about the device
- A list of active events and open tickets associated with the device
- A count of, and links to, the elements associated with the device
- Seven instances of the Multi-series Performance Widget that display the following metrics trended over the last 12 hours:
- Active Calls
- Total Calls
- Total Call Legs
- Video Calls
- Average Latency
- Failed Transfer Calls - Pre Dialog Calls
- Failed Transfer Calls - Post Dialog Calls
Cisco: CVP VXML
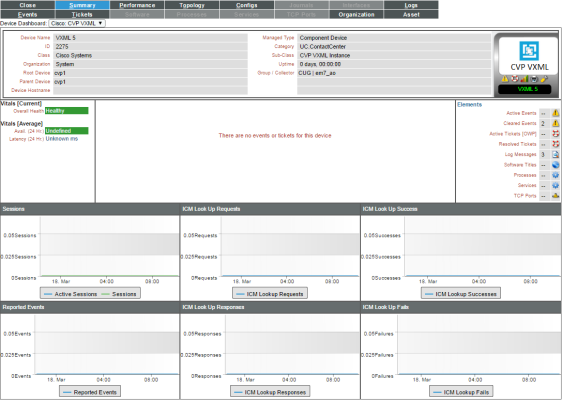
The Cisco: CVP VXML device dashboard displays the following information:
- The basic information about the device
- The current health, availability, and latency for the device
- A list of active events and open tickets associated with the device
- A count of, and links to, the elements associated with the device
- Six instances of the Multi-series Performance Widget that display the following metrics trended over the last 12 hours:
- Sessions
- Reported Events
- ICM Look Up Requests
- ICM Look Up Responses
- ICM Look Up Success
- ICM Look Up Fails
Host Resource and IF MIBS+Topology
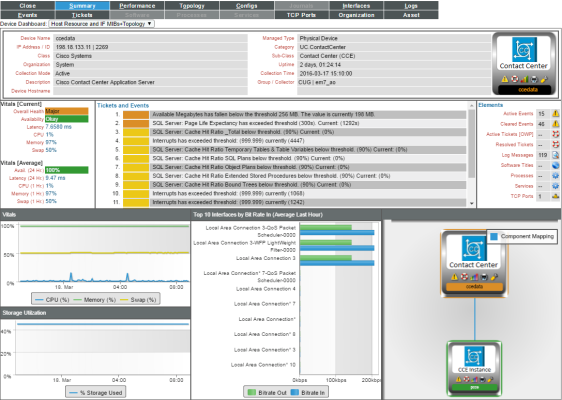
The Host Resource and IF MIBS device dashboard displays the following information:
- The basic information about the device
- The current health, availability, and latency for the device
- A list of active events and open tickets associated with the device
- A count of, and links to, the elements associated with the device
- Two instances of the Multi-series Performance Widget that display the following metrics trended over the last 12 hours:
- Vitals
- Storage Utilization
- Two additional widgets that display the following information:
- Top 10 Interfaces by Bit Rate (Average Last Hour)
