The following section describes the device dashboards that are included in the New Relic: APM PowerPack:
Device Dashboards
The New Relic: APM PowerPack includes device dashboards that provide summary information for New Relic applications and applications groups.
New Relic: APM Application
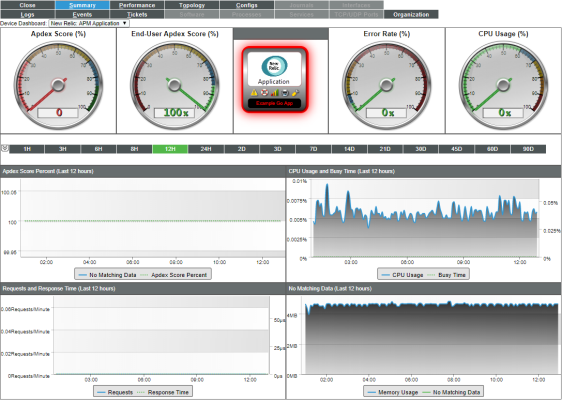
The New Relic: APM Application device dashboard displays the following information:
- Apdex Score
- End-User Apdex Score
- Error Rate
- CPU Usage
- Apdex Score Percent over a period of time
- CPU Usage and Busy Time over a period of time
- Requests and Response Time over a period of time
- Memory Usage over a period of time
New Relic: APM Applications Group
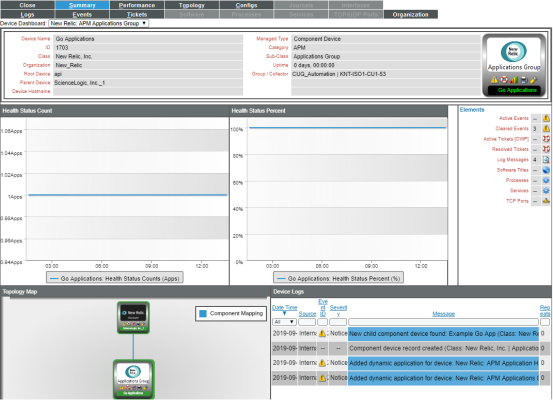
The New Relic: APM Applications Group device dashboard displays the following information:
- Health Status Count over a period of time
- Health Status Percent over a period of time
- Device Logs
New Relic: APM Server
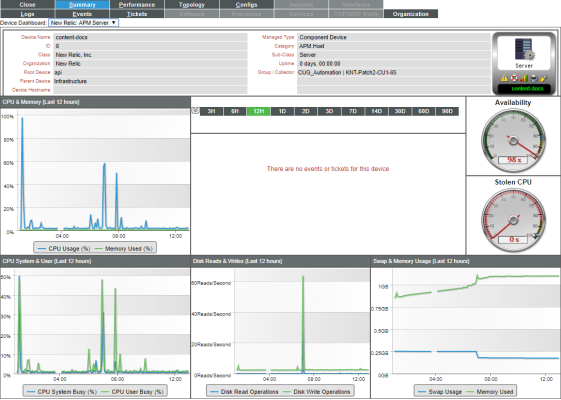
The New Relic: APM Server device dashboard displays the following information:
- CPU and Memory over a period of time
- Events associated with the server
- Availability
- Stolen CPU
- CPU System & User over a period of time
- Disk Reads & Writes over a period of time
- Swap & Memory Usage over a period of time


