![]()
This
Initial Troubleshooting Steps
The first step taken when troubleshooting should be to ensure that there are no issues with the data platforms with which Skylar Automation (formerly PowerFlow) is interacting. There might be additional configurations or actions enabled on Microsoft Teams or Skylar One that result in unexpected behavior. Perform the steps in the following sections to troubleshoot Skylar One Skylar Automation and Microsoft Teams. For detailed information about how to perform the steps below, see Resources for Troubleshooting.
Skylar Automation
- Run docker service ls on the Skylar Automation server.
- Note the Docker container version and verify that the Docker services are running.
- If a certain service is failing, make a note of the service name and version.
- Run docker service ps <service_name> to see the historical state of the failing service and make a note of this information. For example: docker service ps iservices_contentapi
- Make a note of any logs impacting the service by running docker service logs <service_name>. For example: docker service logs iservices_couchbase
Microsoft Teams
- Make a note of the Microsoft Teams version and SyncPack version, if applicable.
- Make a note of the Microsoft Teams application that is failing on Skylar Automation.
- Make a note of what step is failing in the application. Try running the application in debug mode, and capture any traceback or error messages that occur in the step log.
Troubleshooting the Microsoft Teams SyncPack
This section contains information and troubleshooting steps for common issues with the Microsoft Teams SyncPack.
System Requirements
Check to confirm you meet the minimum system requirements:
-
Skylar One Notifications Base SyncPack. Version 1.0.3 or later
-
Microsoft Teams Automation PowerPack. Version 2.0.0 or later
-
Base Step SyncPack. Version 1.5.6 or later
-
Skylar One (SL1) Platform. Version 2.7.0 or later
Authentication Failures
Skylar Automation fails during the MSAL authentication process in the "Create Channel For Event" application, specifically when acquiring an access token for the client. The error code "AADSTS700016" indicates that the Azure AD application with the specified identifier was not found in the ScienceLogic Dev directory. This issue may present in the following ways:
-
Skylar Automation logs may show an error related to the inability to acquire an access token or failed authentication.
-
If no explicit exception is raised, subsequent Teams API requests receive "HTTP 401 Unauthorized" responses.
To resolve this issue:
-
Ensure that the "client_id", "client_secret", and "authority_url" parameters are valid and correctly configured in Skylar Automation.
-
Confirm that the Teams application has proper API permissions in Azure AD, especially the Application permission for "https://graph.microsoft.com/.default".
Missing or Misconfigured Parameters
Failures occur when required parameters such as "team_id", "channel_id", or "client_id" are missing or misconfigured, leading to incorrect payloads or URLs in the API call. This issue may present in the following ways:
-
Skylar Automation logs will contain parameter errors such as "NoneType" errors.
-
The Microsoft Graph API might return HTTP 400 Bad Request errors if required parameters are missing or invalid.
To resolve this issue:
-
Double-check that all necessary parameters are correctly added in the Skylar Automation user interface or workflow.
-
Implement checks to validate the presence and validity of parameters in the "CreateChannel" class.
Resource Limit Exceeded Error
Microsoft Teams limits the number of channels per team to 200 standard channels and 30 private channels. To work around this issue:
-
Remove unused channels. Delete any old or unused channels to free up space for new ones.
-
Create a new team. If more channels are needed, and you cannot delete any old ones, consider creating a new team.
Check Microsoft's official documentation or the Teams Admin Center for exact channel limits, as they may vary based on licensing and updates.
Message Size Exceeded or Rate Limiting Throttling
Microsoft Teams limits messaging in the following ways:
-
Message Size Limit.All messages (including adaptive cards) have a maximum size limit of 28 KB.
-
Rate Limits. Avoid sending more than 30 messages per second to prevent throttling.
ScienceLogic recommends batching messages or cards when possible and to avoid spamming a channel with too many messages in a short period.
Premium License Required Error
The error message indicates that your workflow requires a premium license due to the use of "premium capabilities" in Microsoft Power Automate. This premium requirement applies to actions that connect to external APIs or require more advanced functionality within Power Automate. To resolve this issue:
-
Request a Premium License. Contact your organization’s admin to request a Power Automate premium license.
-
Trial Option. Microsoft often provides a 90-day free trial for premium connectors.
-
Explore Alternatives. If possible, consider using alternative, non-premium actions.
Unauthorized API Key was not found Error
The "Unauthorized, APIKey was not found" error occurs because the HTTP action in your workflow is missing an API key in the request headers. To resolve this issue:
-
Check that you have a valid API key for the external service being called in Skylar Automation.
-
Verify that the API key value is correct and hasn’t expired.
-
If the API key is correctly configured but still shows this error, verify the access permissions of the API key or any additional security configurations on the external service side.
Unable to Retrieve Cached Users
If you receive the "Unable to Retrieve Cached Users" error when clicking the "Acknowledge" button on an event notification, you must run the “Cache Skylar One Users” application in the “Base Steps SyncPack” to validate all user account details in Skylar One.
Missing Required Parameters
If required parameters such as "event_id", "action", or "user" are not provided, it may lead to a "KeyError" or similar exceptions. For example:
-
"Required parameter 'event_id' is missing."
-
"Required parameter 'action' is missing."
-
"Required parameter 'user' is missing."
Invalid Parameter Types
If parameters do not match expected types, it may cause runtime errors. For example:
-
"Invalid type for parameter 'event_id'. Expected String."
-
"Invalid type for parameter 'user'. Expected String."
Logging Errors
If the logger fails to log the information (e.g. if the logging system is misconfigured), it might not raise a fatal error, but it could lead to missing logs. The error message displayed will be "Logging failed for user ID: {user}. Check logging configuration."
Microsoft Teams Workflow Error: Adaptive Card Response Failure
If you receive the "Invalid application: sync_event_status_from_teams_to_sl1" error message, you need to supply the "event_id" variable in App Configuration in Microsoft Teams. If the "event_id" variable is not present, the workflow will not execute. To resolve this issue:
-
Open App Configuration in Microsoft Teams.
-
Locate the event_id variable and assign it a valid value.
-
Re-run the workflow and then check the workflow history to verify the workflow executes correctly.
Checking the Run History of a Workflow
You can view the Run History of a workflow to check workflow logs, review execution steps, and confirm successful syncing between Teams and Skylar Automation. To view the run history of a workflow:
- In Microsoft Teams, click the three dots icon on the left navigation bar to access additional apps.
- Click and then select Manage workflows.
- Select the workflow from the list that you want to view the history for.
- Scroll down until you see 28-day run history.
- Under 28-day run history you will see every time the workflow ran, with a timestamp, duration, and status.
- To view more detail about a specific time the workflow ran, click on the timestamp.

Additional Troubleshooting Tips
ScienceLogic recommends also checking the following items when troubleshooting issues with the Microsoft Teams SyncPack:
-
Authentication Issues (Incorrect Client ID, Secret, or URL). Verify that your credentials and authority URL are correct.
-
Authorization Problems (Token Issues). Confirm the token permissions and renew tokens as necessary.
-
Invalid or Missing User Information. Regularly check for the accuracy of user IDs.
-
Rate Limiting (Too Many Requests). Monitor and distribute requests to avoid hitting rate limits.
-
Troubleshooting Visibility. Review logs for detailed error messages.
Resources for Troubleshooting Skylar Automation
This section contains port information for Skylar Automation and troubleshooting commands for Docker, Couchbase, and the Skylar Automation API.
Useful Skylar Automation Ports
- https://<IP of Skylar Automation>:8091. Provides access to Couchbase, a NoSQL database for storage and data retrieval.
- https://<IP of Skylar Automation>:15672. Provides access to the RabbitMQ Dashboard, which you can use to monitor the service that distributes tasks to be executed by Skylar Automation workers. Use the following for login: guest guest for the login.
- Username: guest
- Password: guest
- https://<IP of Skylar Automation>/flower. Provides access to Flower, a tool for monitoring and administrating Celery clusters.
For version 2.0.0 and later of Skylar Automation, port 5556 must be open for both Skylar Automation and the client.
Helpful Docker Commands
Skylar Automation is a set of services that are containerized using Docker. For more information about Docker, see the Docker tutorial.
Use the following Docker commands for troubleshooting and diagnosing issues with Skylar Automation:
Viewing Container Versions and Status
To view the Skylar Automation version, SSH in to your Skylar Automation instance and run the following command:
docker service ls
In the results, you can see the container ID, name, mode, status (see the replicas column), and version (see the image column) for all the services that make up Skylar Automation.
Restarting a Service
Run the following command to restart a single service:
docker service update --force <service_name>
Stopping all Skylar Automation Services
Run the following command to stop all Skylar Automation services:
docker stack rm iservices
Restarting Docker
Run the following command to restart Docker:
systemctl restart docker
Restarting Docker does not clear the queue.
Viewing Logs for a Specific Service
You can use the Docker command line to view the logs of any currently-running service in the Skylar Automation cluster. To view the logs of a service, run the following command:
docker service logs -f iservices_<service_name>
Some common examples include the following:
docker service logs –f iservices_couchbase
docker service logs –f iservices_steprunner
docker service logs –f iservices_contentapi
Application logs are stored on the central database as well as on all Docker hosts in a clustered environment. These logs are stored at /var/log/iservices for both single-node or clustered environments. However, the logs on each Docker host relate only to the services running on that host. For this reason, using the Docker service logs is the best way to get logs from all hosts at once.
Clearing RabbitMQ Volume
RabbitMQ is a service that distributes tasks to be executed by Skylar Automation workers.
The following error message might appear if you try to run a Skylar Automation application via the API:
Internal error occurred: Traceback (most recent call last):\n File \"./content_api.py\", line 199, in kickoff_application\n task_status = ... line 623, in _on_close\n (class_id, method_id), ConnectionError)\nInternalError: Connection.open: (541) INTERNAL_ERROR - access to vhost '/' refused for user 'guest': vhost '/' is down
First, verify that your services are up. If there is an issue with your RabbitMQ volume, you can clear the volume with the following commands:
docker service rm iservices_rabbitmq
docker volume rm iservices_rabbitdb
If you get a message stating that the volume is in use, run the following command:
docker rm <id of container using volume>
Re-deploy Skylar Automation by running the following command:
docker stack deploy -c /opt/iservices/scripts/docker-compose.yml iservices
Restarting Docker does not clear the queue, because the queue is persistent. However, clearing the queue with the commands above might result in data loss due to the tasks being removed from the queue.
Viewing the Process Status of All Services
Run the following command:
docker ps
Deploying Services from a Defined Docker Compose File
Run the following command:
docker stack deploy -c <compose-file> iservices
Dynamically Scaling for More Workers
Run the following command:
docker service scale iservices_steprunner=10
Completely Removing Services from Running
Run the following command:
docker stack rm iservices
Diagnostic Tools
Multiple diagnostic tools exist to assist in troubleshooting issues with the Skylar Automation platform:
- Docker PowerPack. This PowerPack monitors your Linux-based Skylar Automation server with SSH (the Skylar Automation ISO is built on top of an Oracle Linux Operating System). This PowerPack provides key performance indicators about how your Skylar Automation server is performing. For more information on the Docker PowerPack and other PowerPacks that you can use to monitor Skylar Automation, see
- Flower. This web interface tool can be found at the /flower endpoint. It provides a dashboard displaying the number of tasks in various states as well as an overview of the state of each worker. This tool shows the current number of active, processed, failed, succeeded, and retried tasks on the Skylar Automation platform. This tool also shows detailed information about each of the tasks that have been executed on the platform. This data includes the UUID, the state, the arguments that were passed to it, as well as the worker and the time of execution. Flower also provides a performance chart that shows the number of tasks running on each individual worker.
- Debug Mode. All applications can be run in "debug" mode via the Skylar Automation API. Running applications in debug mode may slow down the platform, but they will result in much more detailed logging information that is helpful for troubleshooting issues. For more information on running applications in Debug Mode, see Retrieving Additional Debug Information.
- Application Logs. All applications generate a log file specific to that application. These log files can be found at /var/log/iservices and each log file will match the ID of the application. These log files combine all the log messages of all previous runs of an application up to a certain point. These log files roll over and will get auto-cleared after a certain point.
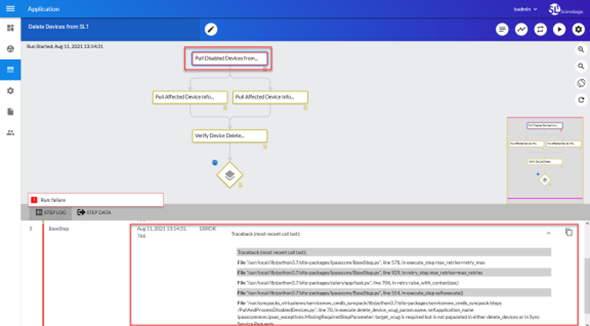
- Step Logs. Step logs display the log output for a specific step in the application. These step logs can be accessed via the Skylar Automation user interface by clicking on a step in an application and bringing up the Step Log tab. These step logs display just the log output for the latest run of that step.
- Service Logs. Each Docker service has its own log. These can be accessed via SSH by running the following command:
docker service logs -f <service_name>
Retrieving Additional Debug Information (Debug Mode)
The logs in Skylar Automation use the following loglevel settings, from most verbose to least verbose:
- 10. Debug Mode.
- 20. Informational.
- 30. Warning. This is the default settings if you do not specify a loglevel.
- 40. Error.
If you run applications with "loglevel": 10, those applications will take longer to run because of increased I/O requirements. Enabling debug logging using the following process is the only recommended method. ScienceLogic does not recommend setting "loglevel": 10 for the whole stack with the docker-compose file.
To run an application in Debug Mode using the Skylar Automation user interface:
- Select the Skylar Automation application from the Applications page.
- Hover over from and select Debug Run from the pop-up menu. Skylar Automation executes the application in Debug Mode with a log level of 10.
To run an application in Debug Mode using the API:
-
POST the following to the API endpoint:
https://<Skylar Automation>/api/v1/applications/run
-
Include the following in the request body:
{
"name": "<application_name>",
"params": {
"loglevel": 10
}
}
After running the application in Debug Mode, review the step logs in the Skylar Automation user interface to see detailed debug output for each step in the application. This information is especially helpful when trying to understand why an application or step failed:
You can also run an application in debug using curl via SSH:
-
SSH in to the Skylar Automation instance.
-
Run the following command:
curl -v -k -u isadmin:em7admin -X POST "https://<your_hostname>/api/v1/applications/run" -H 'Content-Type: application/json' -H 'cache-control: no-cache' -d '{"name": "interface_sync_sciencelogic_to_servicenow","params": {"loglevel": 10}}'