![]()
This
What is the MongoDB PowerPack?
The "MongoDB" PowerPack is an extension of the Snippet Framework created to monitor MongoDB Configuration and Performance metrics on Linux, Windows, and any SSH-enabled device. The PowerPack monitors MongoDB instances of v3, v4, v5,and v6. This is also a Python 3 only release.
What Does the MongoDB PowerPack Include?
The "MongoDB" PowerPack includes:
-
Dynamic Applications that collect data from MongoDB installed on Linux or any SSH enabled device. The PowerPack will collect data from Windows devices as long as the port running MongoDB is accessible to the collector or the Windows device has SSH enabled.
-
Event Policies and corresponding alerts that are triggered when a threshold meets the certain status criteria.
-
A device class that classifies a MongoDB server.
Prerequisites
Before you can monitor this pack using the PowerPack, you must have the following:
-
IP address of the systems where MongoDB is running.
-
If using SSH, the username and password (or pkey) for your machine that has MongoDB installed.
-
The username and password for MongoDB database, if applicable.
-
For MongoDB Replication information, replication should be configured in primary and secondary servers.
-
Skylar One version 11.3.0.x and higher
-
You must have permissions to run the following database commands:
-
serverStatus -
listDatabases(can only be run on ‘admin’ database) -
dbStats -
replSetGetStatus -
getCmdLineOpts -
{"collstats": "oplog.rs"} -
{"listDatabases": 1, "nameOnly": 1}
-
Any database command is at the user’s disposal so long as their MongoDB user has the permission to run it. The list of usable database commands can be found here: https://www.mongodb.com/docs/manual/reference/command/
Installing the MongoDB PowerPack
Before you can use this PowerPack, you must import and install the latest version of the "MongoDB" PowerPack.
To download and install a PowerPack:
- Search for and download the PowerPack from the PowerPacks page at the ScienceLogic Support Center (Skylar One > PowerPacks, login required).
- Go to the PowerPack Manager page (System > Manage > PowerPacks).
- In the PowerPack Manager page, click the button, then select Import PowerPack.
- The Import PowerPack dialog box appears.
- Click the [Browse] button and navigate to the PowerPack file.
- When the PowerPack Installer modal appears, click the button to install the PowerPack.
If you exit the PowerPack Installer without installing the imported PowerPack, the imported PowerPack will not appear in the PowerPack Manager page. However, the imported PowerPack will appear in the Imported PowerPacks page. This page appears when you click the menu and select Install PowerPack.
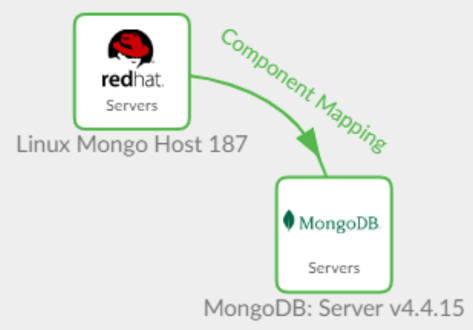
DCM Tree
The DCM tree shows the host server as the physical device and then models the MongoDB server as a child component of the Linux Server.
If the Linux server was not discovered, then the root device would be a Pingable Device Class.
Configuring MongoDB Servers to Collect Data
These tables list the Collection Objects included in the Dynamic Applications created in the PowerPack. The commands that the apps run to collect the data are shown also.
| Dynamic Application | Collection Objects | MongoDB Commands | Alerts and Events |
|---|---|---|---|
|
MongoDB: Server Stats |
Active Connections Availability Available Connections Command Operations Current Connections Delete Operations FS Total Size FS Used Size Insert Operations Network Bytes Received |
|
Contains 2 alerts and events configured.
If the number of Current Connections is greater than the given threshold value, then the Major event is triggered. The Healthy event is triggered when the number of Current Connections returns back less than the given threshold. |
| MongDB: Database Stats |
Average Object Size Database Name Database Size Index Size Indexes Number of Collections Number of Objects Number of Views |
dbStats
|
Contains 2 alerts and events configured.
If the Database Size is greater than the given threshold value, then the Major event is triggered. The Healthy event is triggered when the Database Size value returns back less than the given threshold. |
| MongoDB: Configuration |
Number of Replica Set Members Replica Set Host Names Database Names Host Port MongoDB Version Self State Status Uptime |
|
Contains 2 alerts and events configured.
If a Replica's Set Member's Status is 'DOWN', the Major event is triggered. The Healthy event is triggered when the Set Member's Status returns back an 'UP' value. |
Expiry Delay for Major event is set to 90 minutes and the Healthy event is set to 15 minutes. Threshold for Alerts can be set based on requirement on the ‘Threshold’ page of the Dynamic Application.
Sample Outputs of Dynamic Applications
There are four Dynamic Applications that ship with this pack and these are their sample outputs.
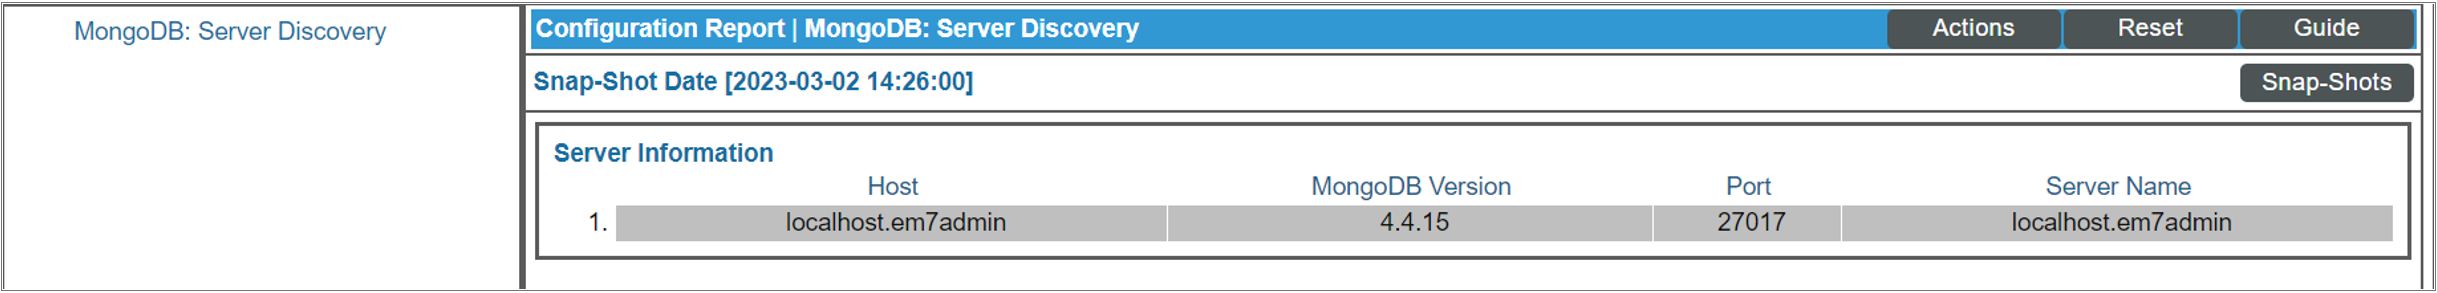
MongoDB: Server Discovery
This Dynamic Application is manually aligned to the physical device (any server that has SSH enabled), but if the underlying server is not discovered, then it is aligned to a pingable device class. This Dynamic Application then discovers the MongoDB server.
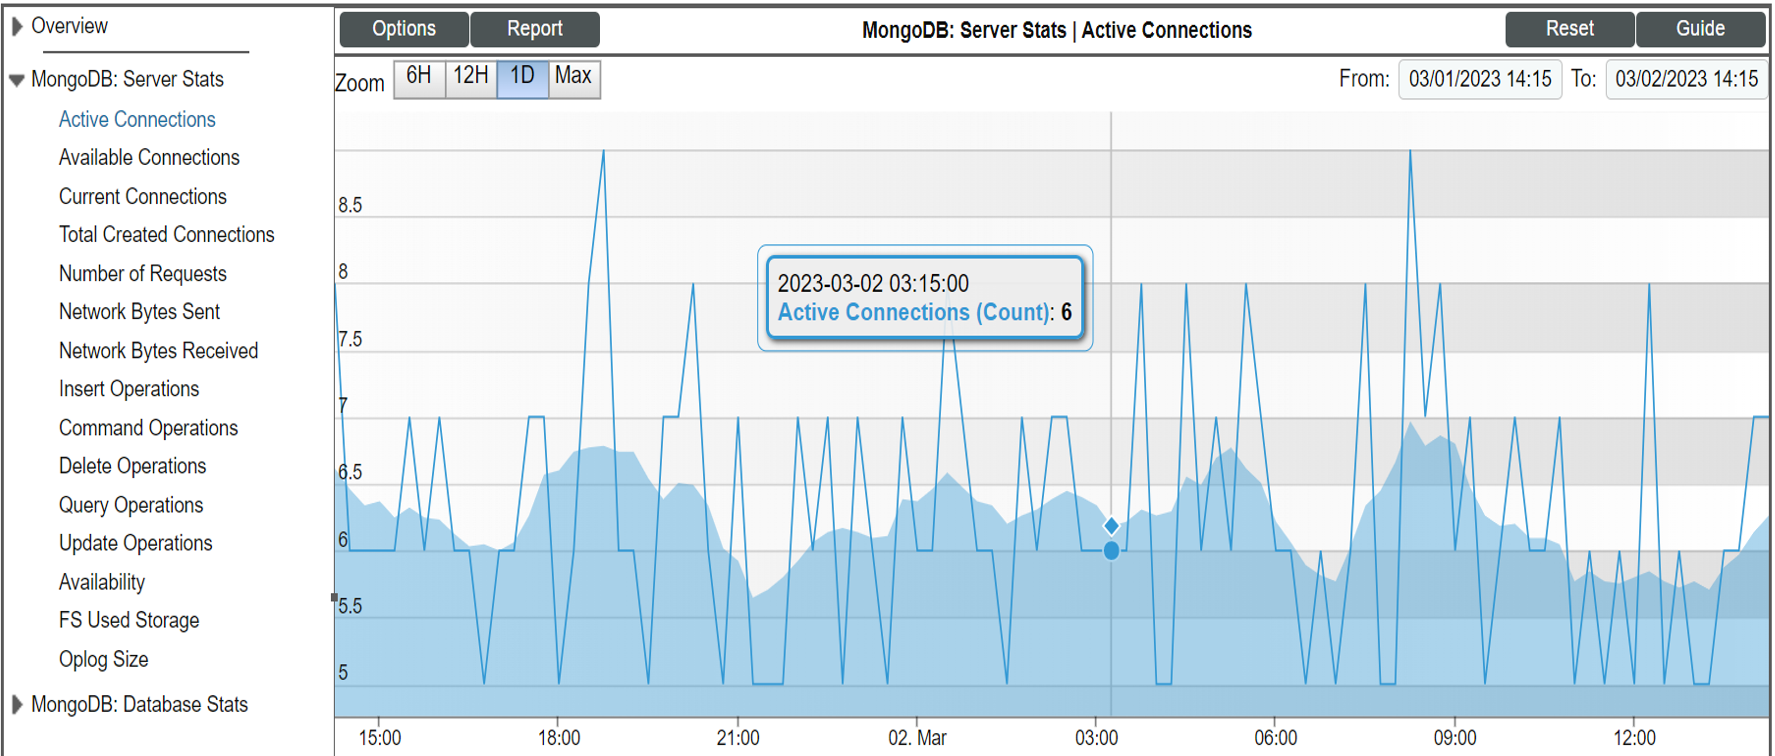
MongoDB: Server Stats
This Dynamic Application collects KPIs related to the servers.
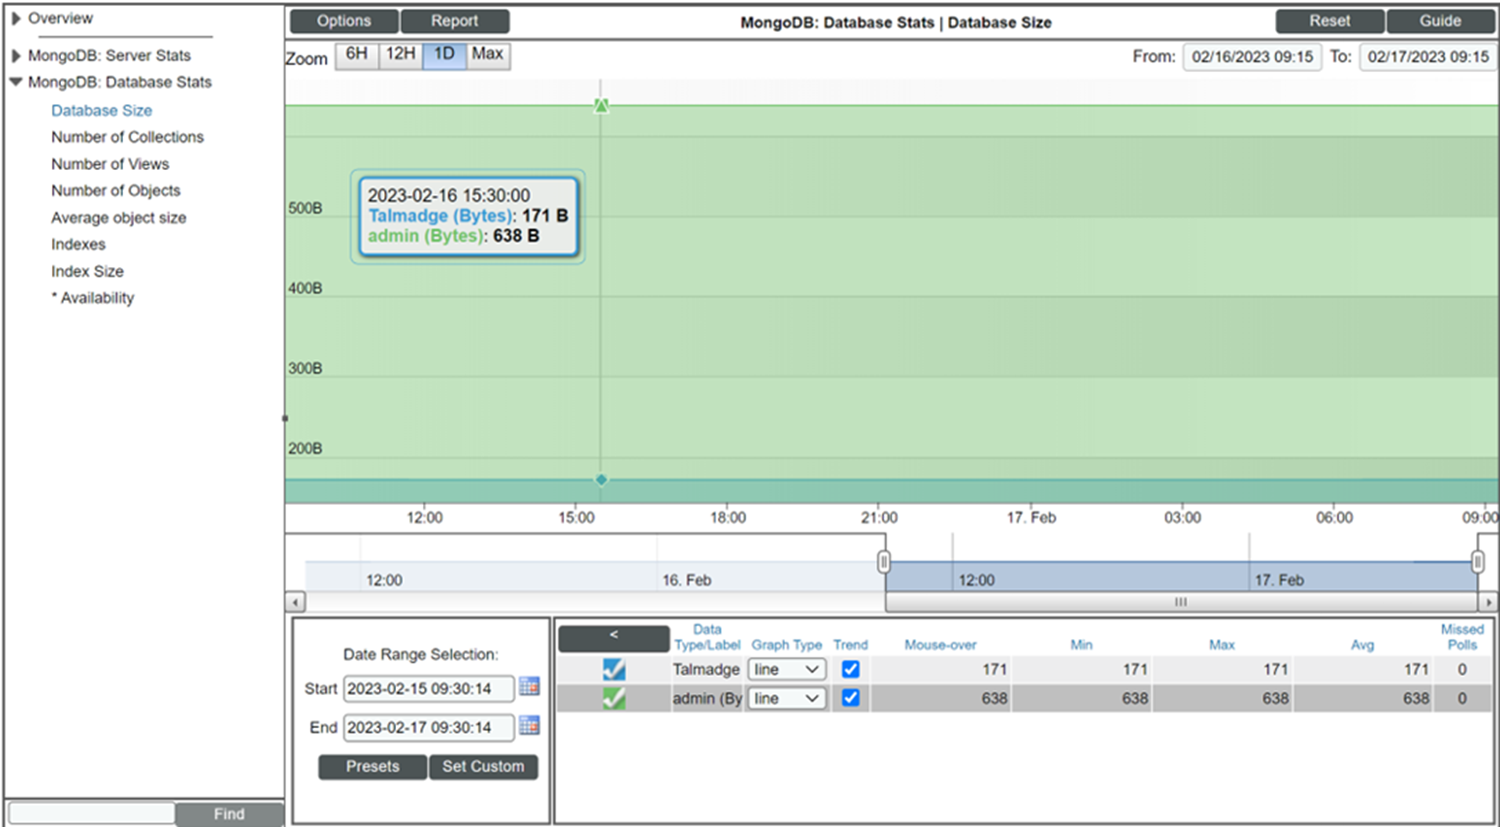
MongoDB: Database Stats
This Dynamic Application collects MongoDB Database statistical information. "MongoDB: Database Stats" graphs output for every database listed in the credential's "Database Names" field. It collects information on multiple instances.
In the example below, there are two databases shown.
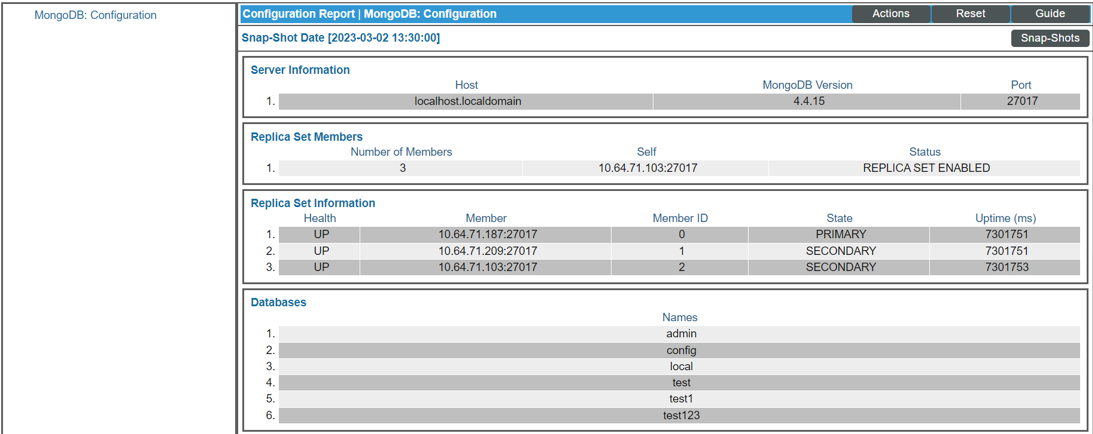
MongoDB: Configuration
This Dynamic Application is a configuration report that shows Server Information, Replica Set Members, Replica Set Information, and Database names.
Configuring a UCF Credential
To configure Skylar One to monitor MongoDB Dynamic Apps, you must first create a new MongoDB credential. This credential allows the Dynamic Applications in the Powerpack to communicate with the device.
This PowerPack supports two credentials to connect to MongoDB.
These credentials include:
-
The port to MongoDB must be accessible to the collector. The default port for this is 27017. In this case, both MongoDB (on Linux ) and MongoDB (on Windows) can be supported.
-
The port to MongoDB must be accessible via SSH. In this case, MongoDB is supported on any server where SSH is enabled.
Connecting to the MongoDB Server
These steps are required to directly connect to the MongoDB port. This set of steps does not use SSH settings. This workflow can be used to monitor MongoDB on Linux and Windows.
-
Go to the Credential Management page ().
-
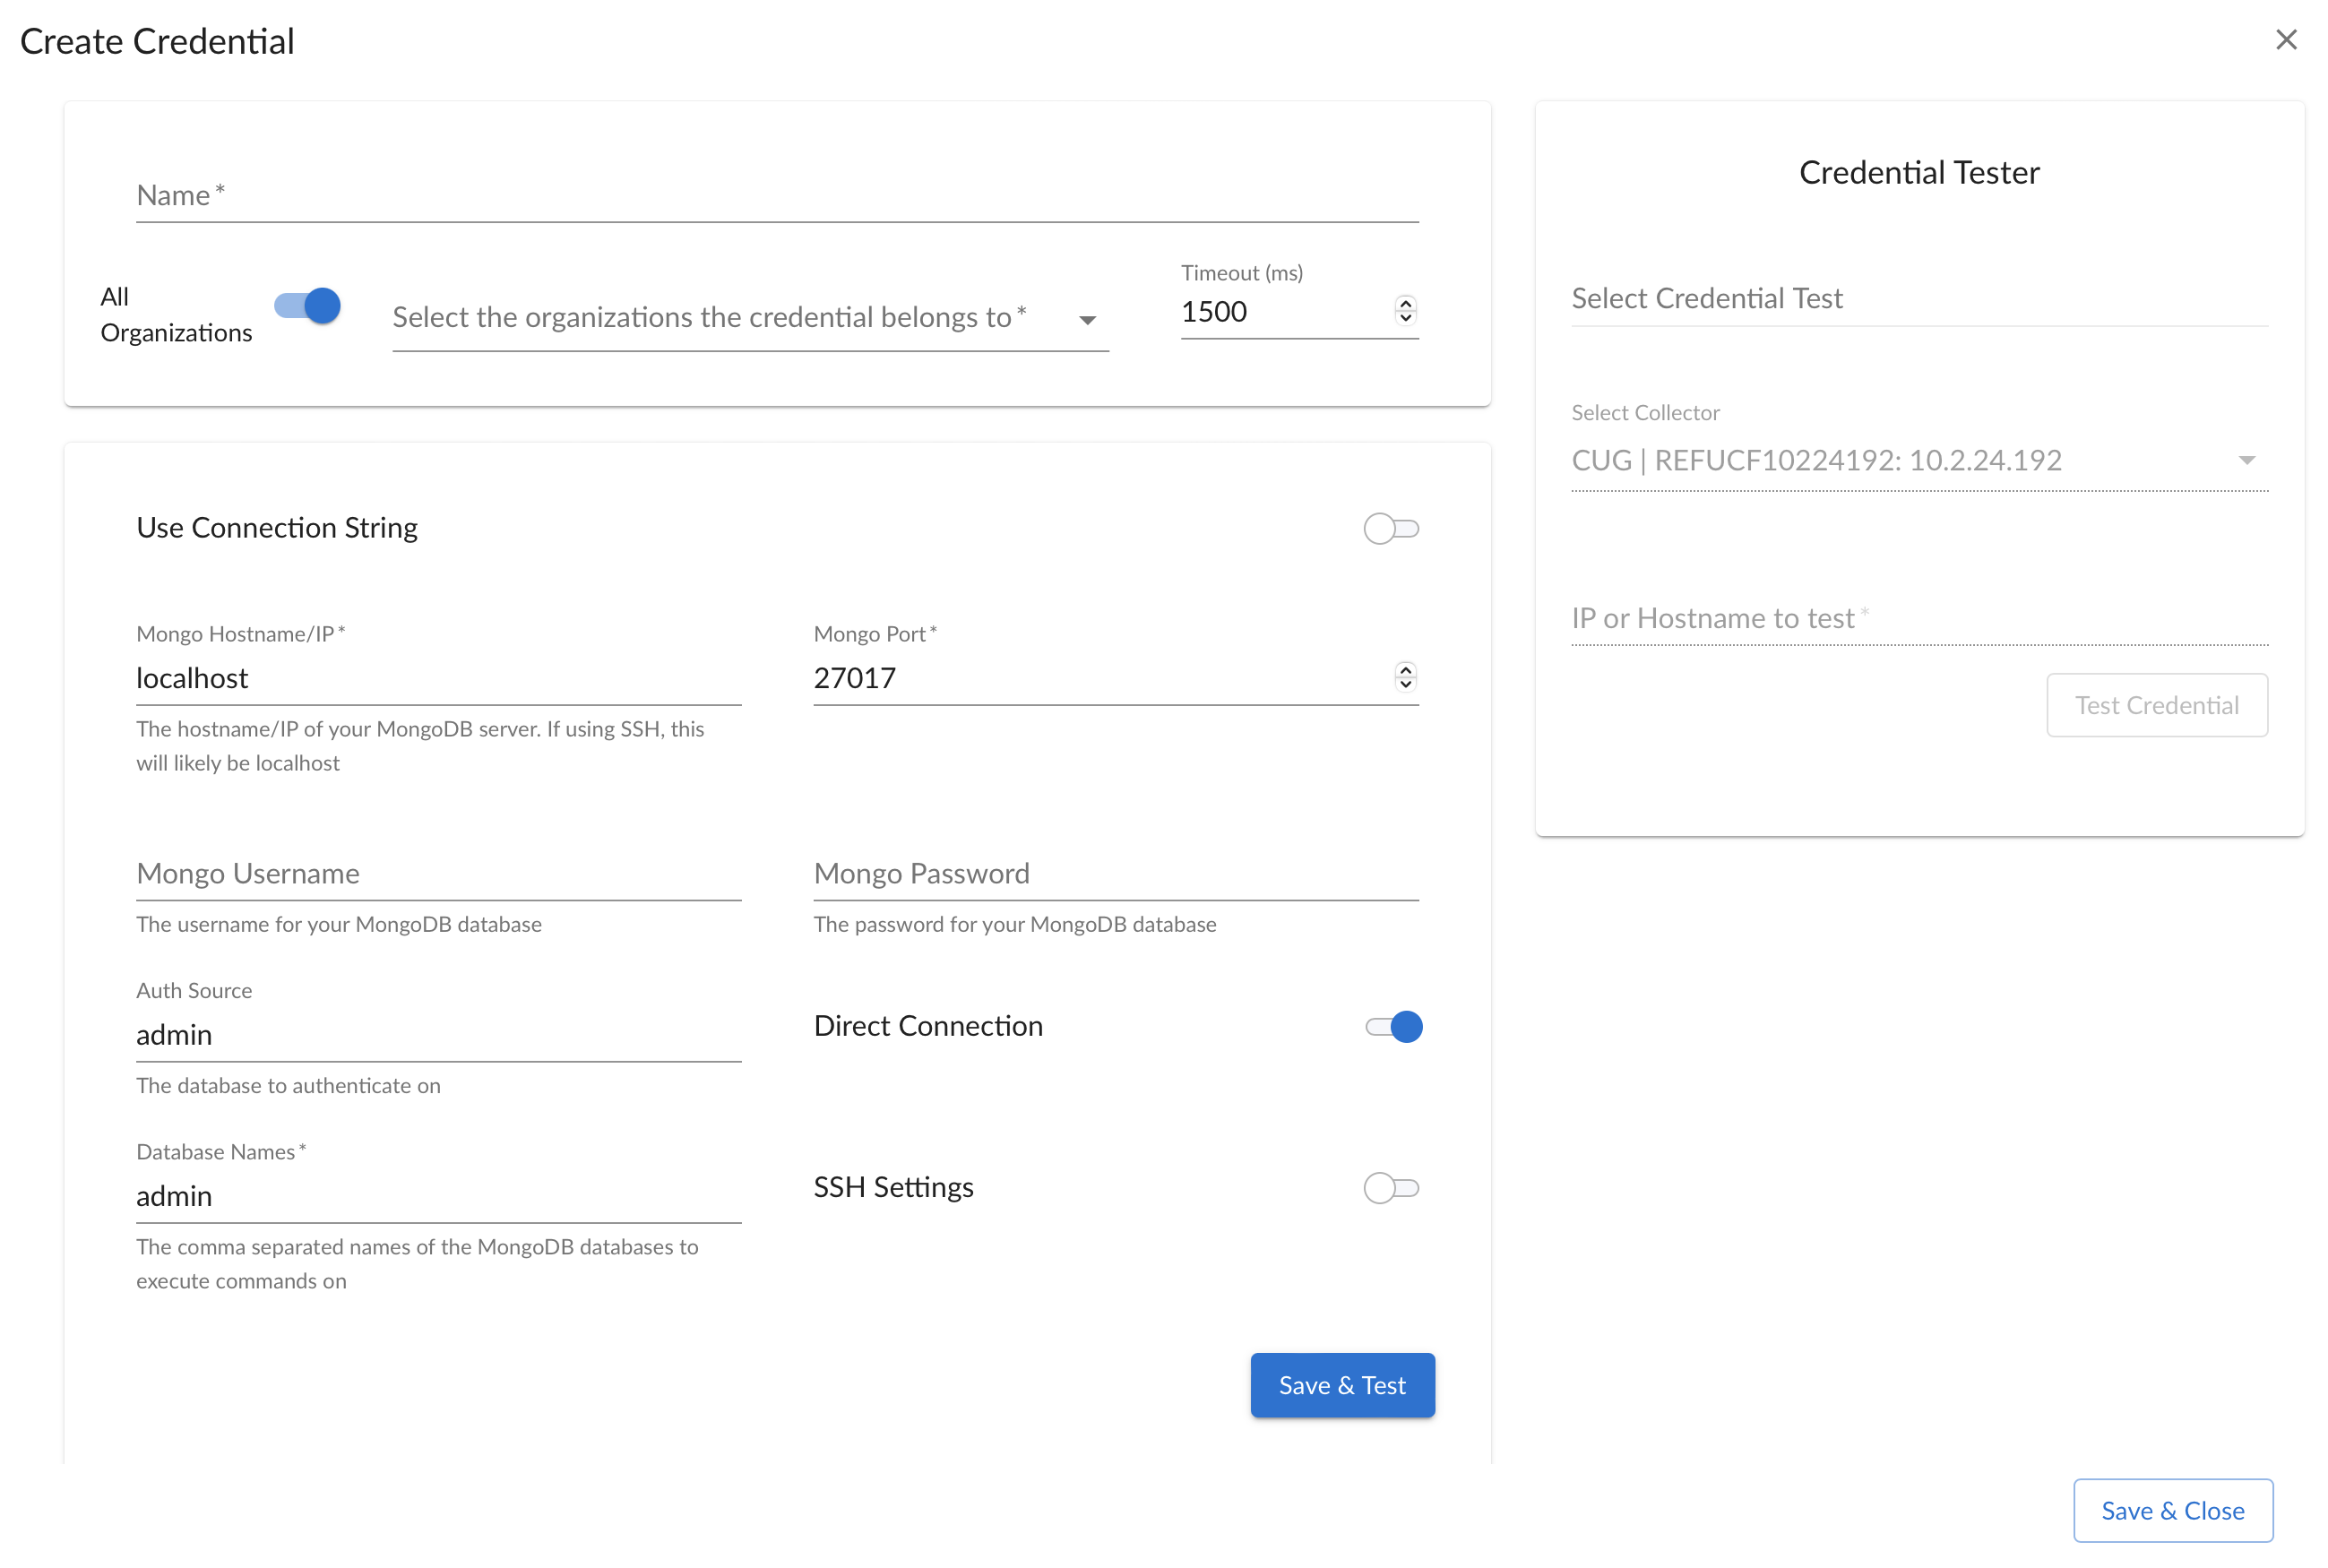
Click the button and then select the . The Credential Editor page appears.

-
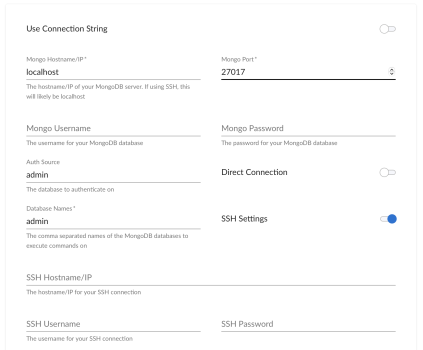
In the Name field, type a name for the credential and provide the IP address or host name of the server in the Mongo Hostname/IP field.
-
When using SSH, this value is typically ‘localhost’. If not 'localhost', it appears as an IP address or host name.
-
To connect to multiple hosts in a replica set, you can specify a comma separated list of hosts here. The Mongo Port field will then be ignored. For example, ‘10.23.42.41:27017, 192.432.55.31:27018, 43.543.354.12:27017’ will connect to any of the listed hosts that are available (typically the primary node).
-
-
Complete the Mongo Port, Mongo Username, and Mongo Password fields.
-
Enter the Database Names that you want to monitor. This is a comma-separated list and you must include the ‘admin’ database in the list for proper collection.
-
Enter the Authentication source (default admin).
-
Toggle the Direct Connection ability of MongoDB. Consider these following scenarios:
-
If enabled, the connection being made will always connect directly to the host and port specified. Otherwise, in a replica set environment, the connection will be made to any of the hosts in the set, typically the primary node.
-
If specifying multiple hosts to connect to a replica set, you must the Direct Connection option.
-
Monitoring MongoDB with SSH
These steps are required to monitor with MongoDB port using SSH settings.
-
Go to the Credential Management page ().
-
Click the button and then select the . The Credential Editor page appears.
-
Complete the required fields (covered above in the "Direct Connect to MongoDB Port" section).
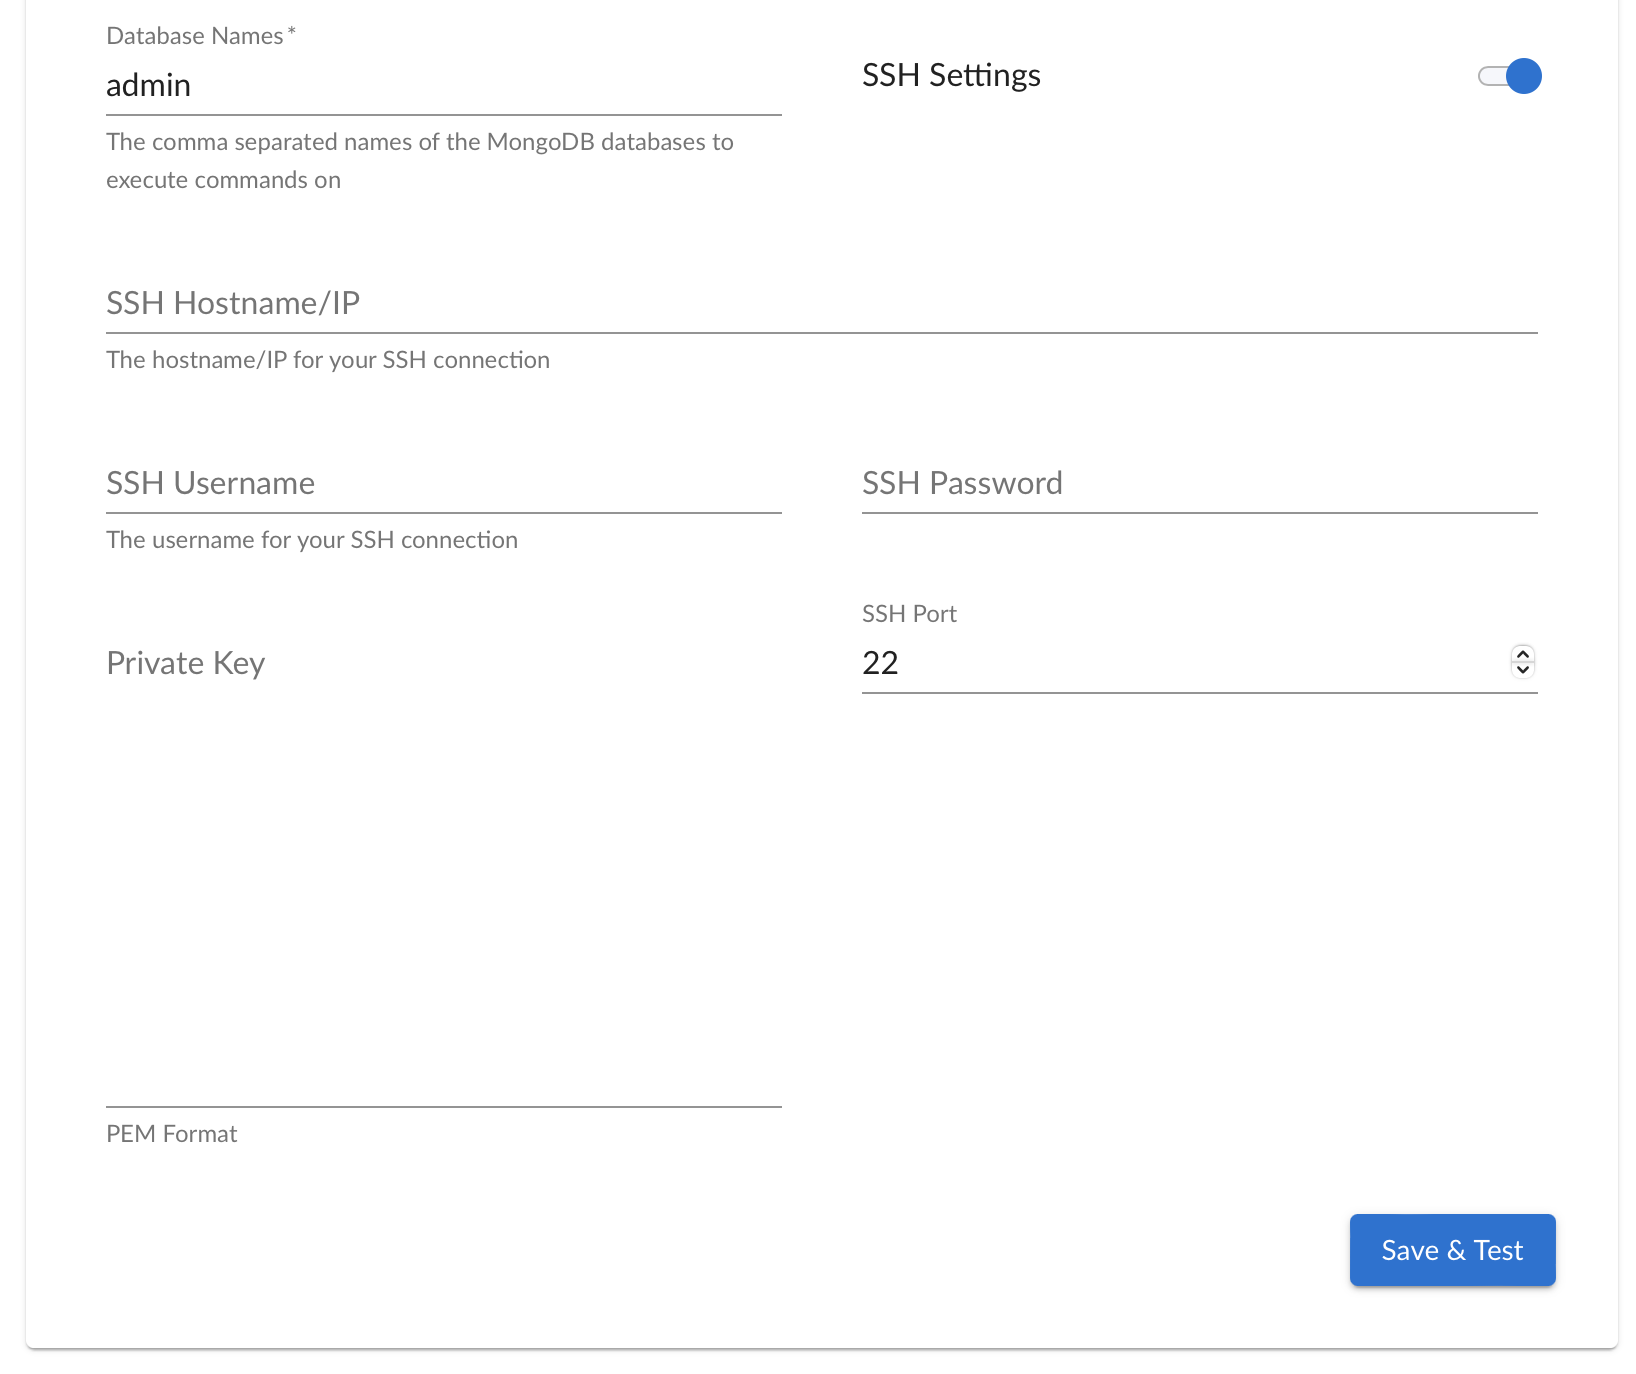
Enter the Database Names that you want to monitor. This is a comma-separated list and you must include the ‘admin’ database in the list for proper collection.
-
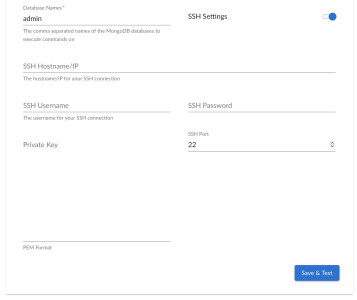
Enable the and complete the fields associated.
-
Click .

If using a PEM key, a password is not required, but it will be the fallback option if there is an error using the PEM key.
Advanced Credential Features/Benefits
There are additional features and benefits included in this PowerPack to consider.
Using the Connection String Option
A MongoDB connection URI is a universal connection method and can be used to connect to any type of MongoDB deployment: standalone, atlas, replica set, or a sharded cluster. If using a connection string, all other MongoDB related credential fields will be ignored. The SSH settings will still be used if enabled.
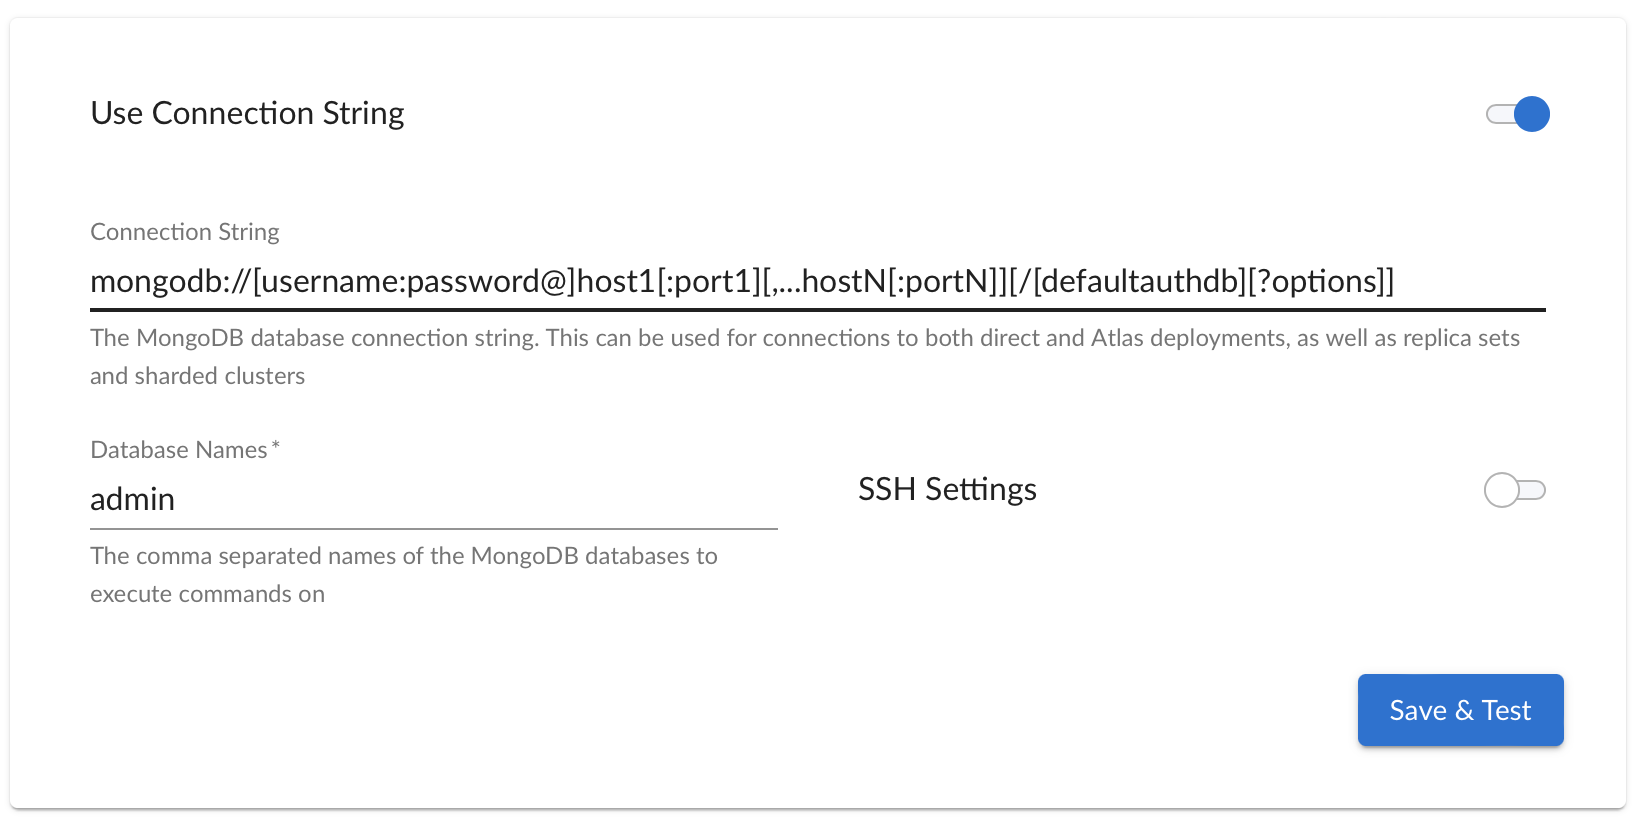
Similar to the other connection methods, enter the Database Names that you want to monitor. This is a comma-separated list and you must include the ‘admin’ database in the list for proper collection.
For more information regarding how to use the connection string, check out the MongoDB documentation, found here https://www.mongodb.com/docs/manual/reference/connection-string/
Discovering MongoDB Servers
It is expected that a MongoDB server will be discovered first as a physical device. After it is discovered, then the MongoDB app can be aligned to the device.
This PowerPack can be aligned to either a physical device or a virtual device.
To align the Dynamic Application:
-
Select and enter the name(s) of the device.
-
Click on the and select .
-
Click and then select .
-
Click and choose the MongoDB: Server Discovery application.
-
Deselect the and select .
-
Select the UCF credential that was created above and click .
If the MongoDB server is not already discovered as a Linux or SNMP device, then it can be discovered as a pingable device. The above procedures can be followed to align the dynamic app.
Onboarding Tips
This PowerPack is brand new and it is highly recommended that you understand the following onboarding tips.
These include:
-
This PowerPack can't be used in backwards compatibility with the SLCOE pack. The device will have to be deleted and rediscovered to use the PowerPack.
-
The MongoDB server is accessible via an IP address; this address must be discovered in Skylar One as a "pingable device". Meaning, you must select the “discover non-SNMP” flag in the Discovery panel or make sure it exists already as a discovered Linux or Windows server.
-
The Linux server or Windows server must be discovered first. Then, the MongoDB Dynamic Application can be aligned to discover the MongoDB database. It will be a component under any device it is aligned to.
-
The PowerPack and the Device Class for MongoDB, when shipped, will automatically classify the component device under the root device.
-
It is expected that every server in the Mongo Cluster has the MongoDB Server Discovery App aligned. That is, every Replica Member should have the Mongo Server Discovery app aligned.
Troubleshooting
If collection/configs are unable to collect data, consider the following actions:
-
Run the appropriate Dynamic Application in Debug mode for more error messages (incorrect credentials, timeout, etc.).
-
Run the MongoDB commands provided above directly on your MongoDB server to see if the commands are responding correctly.
-
If the Dynamic Apps are collecting data in Debug mode but not during regular operations, check for sigterms and/or collector load. Then, open a support case after reviewing the knowledge base articles.