This
You can use these policies to enrich Skylar One network connectivity events, such as availability and latency issues, by automatically running common network diagnostic commands and adding the output to the Skylar One event log or an associated incident. The available policies includes Network Connectivity user-initiated automation policies.
This PowerPack includes custom run book action types for running ping, traceroute, nslookup, and nmap commands with parameters that you specify. The PowerPack also includes two dynamic device groups for IPv4 devices and IPv6 devices.
Network Connectivity Run Book Automation Policies
The Network Connectivity run book automation policies in this PowerPack run automatically in response to network availability events.
To use these run book automation policies, you will need to enable each policy, as the policies are disabled by default.
The "IPv4 Devices" and "IPv6 Devices" device groups in Skylar One are aligned to all of the Network Connectivity automation policies. You will need to align your devices to those device groups for the policies to be run by default. For more information, see Editing an Existing Device Group.
The following table lists the Network Connectivity run book automation policies included in the "Datacenter Automation Utilities" PowerPack:
| Automation Policy Name | Aligned Events | Run Book Action |
|---|---|---|
|
Network Connectivity: Run IPv6 NMAP on Affected Port
|
|
|
|
Network Connectivity: Run IPv6 NMAP on Common Ports
|
|
|
|
Network Connectivity: Run IPv6 NMAP on Monitored Ports
|
|
|
|
Network Connectivity: Run NMAP on Affected Port
|
|
|
|
Network Connectivity: Run NMAP on Common Ports
|
|
|
|
Network Connectivity: Run NMAP on Monitored Ports
|
|
|
|
Network Connectivity: Run Nslookup (IPv4)
|
|
|
|
Network Connectivity: Run Ping (IPv4)
|
|
|
|
Network Connectivity: Run Ping (IPv6)
|
|
|
|
Network Connectivity: Run Traceroute (IPv4)
|
|
|
|
Network Connectivity: Run Traceroute (IPv6)
|
|
|
If your Skylar One system is on version 12.1.0 or earlier, the IPv6 Network Connectivity run book actions will not work, as IPv6 is not supported on those versions. Skylar One must be at version 12.1.2 or later to use IPv6 and the IPv6 Network Connectivity actions.
Enabling Automation Policies
Before you can use the Network Connectivity run book automation policies, you will need to enable the policies. The automation policies are disabled by default. You do not have to do any additional configuration after enabling the policies.
To enable the automation policies:
- In Skylar One, go to the Automation page (Registry > Run Book > Automation) and open the run book automation policy. The Automation Policy Editor page appears.
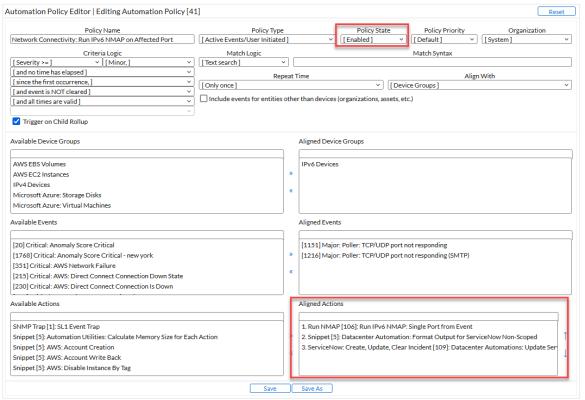
- Set the Policy State to Enabled.
- In the Aligned Actions field, select a run book action (if needed) in the Available Actions field and click the right arrow (>>). Add more actions as needed. To re-order the actions in the Aligned Actions field, select an action and use the up arrow or down arrow buttons to change that action's position in the sequence.
- Click .
- For the run book action or actions you selected in step 3, go to the Actions page (Registry > Run Book > Actions), click the wrench icon (
 ), and make sure the Action State for that action is set to Enabled. Repeat for all actions you selected in step 3.
 - Click . The automation policy is now enabled.
Configuring Network Connectivity Actions to Send Output to ServiceNow
To send output to ServiceNow for the Network Connectivity automation policies, you can add one of the following run book actions in the Aligned Actions field for the automation policy:
- Datacenter Automation: Format HTML Output for ServiceNow Scoped
- Datacenter Automation: Format Output for ServiceNow Non-Scoped
- Datacenter Automation: Format Output for ServiceNow Scoped
The ServiceNow action should be the second action in the Aligned Actions field, with the "Datacenter Automations: Update ServiceNow Incident" as the last action in the automation policy.
For example, if you want to send output to ServiceNow from the "Network Connectivity: Run IPv6 NMAP on Affected Port" automation policy, you would arrange the run book actions in the automation policy in this order:
- Run IPv6 NMAP: Single Port from Event Actions Log
- Datacenter Automation: Format Output for ServiceNow Non-Scoped (add this action after you remove the default "Datacenter Automation: Format Output as HTML" action )
- Datacenter Automations: Update ServiceNow Incident (for more information about configuring this run book action, see Configuring Skylar One in the ServiceNow Incident SyncPack manual)
Be sure to select Enabled in the Policy State field for the automation policy before you click or .
Network Connectivity User-initiated Automation Policies
All of the Network Connectivity run book automation policies listed above have a Policy Type of Active Events/User Initiated. The automation policy enables all of the features of the "Active Events" and the "User Initiated" Policy Types. As a result, this automation policy can be triggered by active events that meet the criteria in the policy, or a user can manually trigger the automation.
You can run these automation policies as needed from the Devices page, the Events page, and the Service Investigator page. If there is an event policy specified in the automation policy, that event must be active for the policy to be run manually, and the policy can only be run on that event type. The same applies for the device groups list.
For these automation policies to be visible from the Tools panel in the Device Summary modal , the following three things must be true between the event and the automation policy configuration:
- Organization. The organization associated with the event must match the organization configured in the automation policy. Policies in the "System" organization match all organizations.
- Aligned Devices. The device for which the event is triggered must be configured as an Aligned Device in the automation policy.
- Aligned Event. The event must match one of the Aligned Events configured in the automation policy.
In most situations, you would run a user-initiated automation in response to an event that just occurred. If you have Automation PowerPacks installed on your Skylar One system, the Event Actions Log window for that event might contain diagnostic information from other automations that have already run, including information that helps you determine which user-initiated automation you should run next to address the cause of the event.
To run a user-initiated automation policy, click the open icon (![]() ) to open the Device Summary modal for the event and click in the Tools section. Any available user-initiated automation policy will be listed there, available to run on-demand.
) to open the Device Summary modal for the event and click in the Tools section. Any available user-initiated automation policy will be listed there, available to run on-demand.
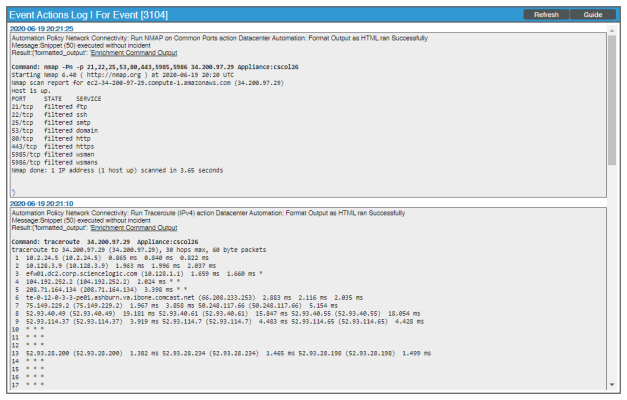
To view the run book automation actions available for an event, click the [Actions] button (![]() ) for the event and select View Automation Actions to see the automation actions triggered by the events. The results for the event display in the Event Actions Log, include the automation policy that ran, along with the collected data. The following figure shows an example of this output:
) for the event and select View Automation Actions to see the automation actions triggered by the events. The results for the event display in the Event Actions Log, include the automation policy that ran, along with the collected data. The following figure shows an example of this output:
Network Connectivity Run Book Action Policies
You can use the following run book action policies to perform specific actions as part of the run book automations in the "Datacenter Automation Utilities" PowerPack:
- Run IPv6 NMAP: Common Port List. Runs a standard NMAP command on ports 21, 22, 25, 53, 80, 443, 5985, and 5986 on the monitored IPv6 device.
- Run IPv6 NMAP: Monitored Ports. Runs a standard NMAP command on any ports that are currently monitored with a port monitoring policy on the triggering IPv6 device.
- Run IPv6 NMAP: Single Port from Event. Runs a standard NMAP command on the port provided in the event triggering the associated automation policy on the monitored IPv6 device.
- Run IPv6 Traceroute: Default Options. Runs a standard traceroute command on the triggering IPv6 device.
- Run NMAP: Common Port List. Runs a standard NMAP command on ports 21, 22, 25, 53, 80, 443, 5985, and 5986 on the monitored IPv4 device.
- Run NMAP: Monitored Ports. Runs a standard NMAP command on any ports that are currently monitored with a port monitoring policy on the triggering IPv4 device.
- Run NMAP: Single Port from Event. Runs a standard NMAP command on the port provided in the event triggering the associated automation policy on the monitored IPv4 device.
- Run Nslookup: Default Options. Runs a standard NSLOOKUP (IPv4) command on the triggering IPv4 device.
- Run Ping6: Default Options. Runs a standard ping command on the triggering IPv6 device.
- Run Ping: Default Options. Runs a standard ping command on the triggering IPv4 device.
- Run Traceroute: Default Options. Runs a standard traceroute command on the triggering IPv4 device.
If your Skylar One system is on version 12.1.0 or earlier, the IPv6 Network Connectivity run book actions will not work, as IPv6 is not supported on those versions. Skylar One must be at version 12.1.2 or later to use IPv6 and the IPv6 Network Connectivity actions.
Using the Network Connectivity Automation Policies
For every device that has an IP address, Skylar One monitors availability every five minutes. If you have enabled Critical Ping for a device and enabled the event "Poller: Device not responding to ping (high frequency)", you can monitor availability at a higher frequency than five minutes. The automation policies respond to events from Critical Ping as well.
To see the automation actions triggered by an event on the Events page, click the [Actions] button (![]() ) and select View Automation Actions. The Event Actions Log page appears.
) and select View Automation Actions. The Event Actions Log page appears.
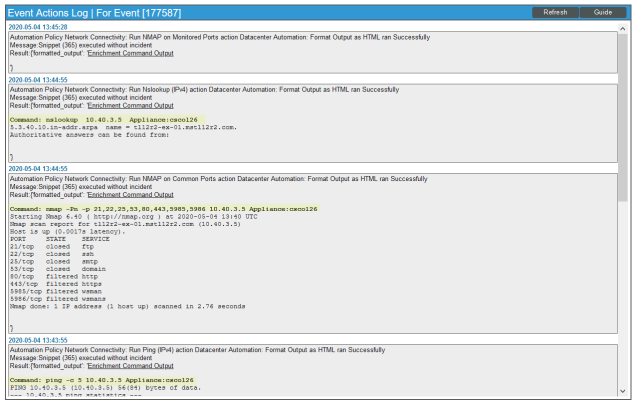
Notice the highlighted NMAP, Ping, and Nslookup information in the following image. The log indicates that the following actions ran successfully and indicates which Skylar One appliance ran the action:
- "Run Nslookup (IPv4): Default Options" and "Datacenter Automation: Format Command Output as HTML"
- "Run NMAP on Common Ports" and "Datacenter Automation: Format Command Output as HTML"
- "Run Ping (IPv4): Default Options" and "Datacenter Automation: Format Command Output as HTML"
Although you can edit the run book actions described in this section, the best practice is to "Save As" to create a new, renamed run book action.
Prerequisites for Creating a Network Connectivity Automation Policy
Before you create a run book automation policy using the Network Connectivity run book automation and action policies in this PowerPack, you must determine the following:
- Which commands (Ping, Traceroute, NSLOOKUP, or NMAP) you want to run on a device when an event occurs. There are 11 run book actions in the PowerPack that run these commands with different options. You can also create your own run book actions using the custom action types supplied in the PowerPack.
- What event criteria you want to use to determine when the automation actions will trigger, or the set of rules that an event must match before the automation is executed. This can include matching only specific event policies, event severity, associated devices, and so on. For a description of all the options that are available in automation policies, see Run Book Automation.
For more information about creating an automation policy, see Creating and Customizing Run Book Automation Policies.


