This
This
Use the following menu options to navigate the Skylar One user interface:
- To view a pop-out list of menu options, click the menu icon (
 ).
). - To view a page containing all of the menu options, click the Advanced menu icon (
 ).
).
The Skylar One Agent
The Skylar One agent is a program that you can install on a device monitored by Skylar One (formerly SL1). There is a Windows agent, an AIX agent, a Solaris agent, and a Linux agent. The agent collects data from the device and pushes that data back to Skylar One.
Similar to a Data Collector or Message Collector, the agent collects data about infrastructure and applications.
You can configure an agent to communicate with either the Message Collector or the Compute Cluster.
The following minimum agent versions are required for Skylar One 12.5.1 and later:
-
Windows version 154
-
Linux version 196
-
AIX version 196
-
Solaris version 196
Users who require agent-based log collection on a device with a Windows agent or a Linux agent must have the minimum Windows agent or Linux agent version. If you do not have the minimum required agent versions, ScienceLogic recommends that you upgrade using the button on the Agents page (Devices > Agents), or by downloading and upgrading the agent manually. For more information, see the section on Upgrading an Agent.
In the Skylar One Extended Architecture (which includes Compute Nodes, Storage Nodes, and a Management Node), the Gen 3 agent collects the following data:
- Device Availability. Skylar One can determine the availability state of a device (available or unavailable) and generate trended availability graphs based on uptime data collected by the agent.
- Logs. The Skylar One agent can be configured to push logs to Skylar One that match specific criteria from a log file or the Windows Event Log. You can view logs collected by the Skylar One agent on the Logs pane of the Device Investigator page. The same logs also appear on the tab in the Device Properties and Device Summary pages for that device. You can define event policies that specify how logs collected by an agent will trigger events.
- Host Performance Metrics. Using Dynamic Applications, Skylar One translates data provided by a Skylar One agent to trend the following metrics:
- Overall CPU Utilization
- CPU Utilization Breakdown
- Disk Average Queue Length
- Disk IO Utilization
- Memory Utilization
- Network Bytes Read
- Network Bytes Written
- Storage Available
- Storage Total
- Storage Utilization
- Swap Utilization
- Host Configuration. Using a Dynamic Application, Skylar One collects the following configuration data based on data provided by the Skylar One Agent:
- The number and speed of the installed CPUs
- The amount of installed memory
- The overall and per-disk storage size
- The total swap capacity (Skylar One Extended Architecture only)
- Network Interface. The Skylar One agent collects a list of the network interfaces running on the device. You can view the list of interfaces on the tab of the Device Investigator page and the Device Summary page. This list includes attributes such as the interface MAC address, IP address, position, and speed as well as inbound and outbound utilization, number of errors, and discard and usage percentage.
- File System. The Skylar One agent collects data about the of configuration of the file systems found within a device, such as name, size and, type as well as utilization data such as free space, size, and usage percentage. You can view the file system data on the tab of the Device Investigator page and the Device Summary page.
- System Processes. The Skylar One agent collects a list of all processes running on the device, such as name, process ID (PID), and state. You can view the list of processes on the tab of the Device Investigator page and the tab of the Device Summary page. Monitoring policies can be configured to trend and alert on process availability, process CPU usage, and process memory usage.
- Windows Services. The Skylar One agent collects a list of all Windows services enabled on the device. This list includes attributes such as the service name and run state. You can view the list of Windows Services on the tab of the Device Investigator page and the Device Summary page.
- Installed Software. The Skylar One agent collects a list of the software running on the device. This list includes attributes such as software name, version, and installation date. You can view the list of software on the tab of the Device Investigator page and the Device Summary page.
You can view these metrics on the Device Investigator page and the tab of the Device Summary panel for a specific device.
You can view the collected configuration data on the tab of the Device Investigator page and the Device Summary panel.
For more information about monitoring devices with the agent, see the
Skylar One Distributed Architecture with a Skylar One Agent
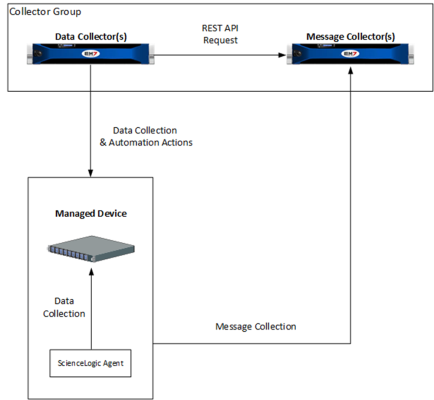
In a Skylar One Distributed Architecture, the Skylar One Agent collects data from the device on which it is installed and transfers that data to a Message Collector in a Skylar One system using the HTTPS protocol. The Data Collector on which the Dynamic Applications and collection processes run then poll the Message Collector using the HTTPS protocol to transfer data to Skylar One.
TCP port 443 must be open between the Message Collector and the device on which an agent is installed.
In a Distributed Architecture, the Skylar One agent requires a standalone, dedicated Message Collector. The Message Collector does not need to be dedicated to agent usage, but the Message Collector cannot be a Data Collector that also performs message collection
NOTE: Message Collectors that process data from the agent have different system requirements than Message Collectors that do not process data from the agent. For more information about the system requirements when running agents in a Distributed Architecture, see the System Requirements page at the ScienceLogic Support Site.
The diagram below shows the collection layer of a Distributed System containing both Data Collectors and Message Collectors in which the Skylar One Agent is installed on a managed device.
Skylar One Extended with an Agent
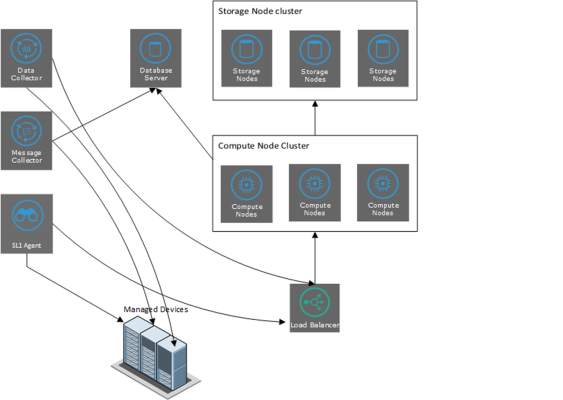
In the Skylar One Extended Architecture, an Skylar One agent collects data from the device on which it is installed and sends that data to a Load Balancer in front of a Compute Cluster. The Compute Cluster transforms the data and stores high-volume performance data in the Storage Cluster and other performance and configuration data in the Database Server.
If required, agents can use an HTTP proxy server as an intermediate step in sending data to Skylar One.
In the diagram below:
- The Skylar One agent collects data from managed devices and sends the data to the Load Balancer and Compute Node cluster for processing.
- The optional Message Collector collects asynchronous traps and syslog messages and sends them to the Database Server.
- The Data Collector collects data from managed devices and sends the data to the Load Balancer and Compute Node cluster for processing and then storage.
Using an agent in the Skylar One Extended Architecture provides more configuration and performance data than using an agent in a Distributed Architecture. This additional data includes system vitals, log data, and extensible collection.
Uploads that occur in 20-second intervals, sometimes called "snapshot uploads", are no longer supported. These 20-second uploads were replaced with the 1-minute upload default in Skylar One version 11.2. ScienceLogic highly recommends that you ensure your agents are uploading in 1-minute summarized uploads prior to upgrading. You can verify your uploads from the tab in the current Skylar One user interface.
NOTE: For more information about the system requirements when running agents in an Extended Architecture, see the System Requirements page at the ScienceLogic Support Site.

