![]()
In this example, we will define a policy to monitor web content, define an IT Service policy that uses the web-content monitor, define an SLA Definition, and then generate a dashboard report and a quick report for the IT Service policy and the SLA Definition.
In our example:
- We will create an IT Service policy that monitors a web server. We want to ensure that the web server will return a request within 8 seconds. We want to see this type of performance 99.99% of the time.
- We will first create a web-content monitoring policy. This policy will be aligned with the web server we want to monitor. We will search a web site for a string and monitor the time it takes to send the request and receive a reply.
- We will create an IT Service policy. This policy will monitor the web server that we aligned with the web content monitoring policy.
- The IT Service policy will include a metric that is based on the web content monitoring policy.
- The IT Service policy will use the metric (based on the web content monitoring policy) to define availability of the IT Service.
- We will define an SLA that says "the web server should return a request within 8 seconds. We want to see this type of performance 99.99% of the time".
- 99.99% uptime allows for 432 minutes of downtime per month.
- Because our IT Service policy has a polling frequency of 5 minutes, the web servers can be unavailable (transaction time is greater than 8 seconds) no more than 86 polling periods per month (and still meet 99.99% uptime).
- We will define a dashboard widget and generate a report that shows whether the IT Service policy is complying with the SLA.
- We will define and generate a spreadsheet that shows whether the IT Service policy is complying with the SLA.
Use the following menu options to navigate the Skylar One user interface:
- To view a pop-out list of menu options, click the menu icon (
 ).
). - To view a page containing all of the menu options, click the Advanced menu icon (
 ).
).
Creating the Web-Content Monitoring Policy
Skylar One allows users to create policies that monitor a web site for specific content. This is helpful:
- To determine if a web site is up and running.
- To determine if the connection between a webserver and a database is up and running.
- To monitor system tools that can be accessed through a browser.
- To monitor content on a web site.
If Skylar One cannot match the expression in the content policy with the text on the web site, Skylar One generates an event.
Skylar One uses cURL to send and receive data from the web site.
There are two places in Skylar One from which you can define a policy for monitoring web content:
- From the Device Manager page (Devices > Classic Devices, or Registry > Devices > Device Manager in the classic SL1 user interface):
- In the Device Manager page, find the device that you want to associate with the monitoring policy. Select the wrench icon (
 ) for the device.
 - In the Device Administration panel, select the tab.
- From the menu in the upper right, select Create Web Content Policy.
Or:
- From the Web Content Monitoring page (Registry > Monitors > Web Content):
- In the Web Content Monitoring page, select the button.
- The Web Content Policy modal page appears.
- In the Web Content Policy modal page, supply a value in the following fields:
- Select Device. From this drop-down list, select a device to align with this policy. By default, the current device is selected in this field. We selected the web server "hq-w2k3-jump01".
NOTE: Before you can define a content policy, you must decide which managed device you want to associate with the policy. You might want to associate the policy with the device where the referenced web server resides, but you aren't required to do so. Alternately, you might want to create a virtual device to associate with a content policy (for details on defining a virtual device,
- Policy Name. Name of the new policy. Can be any combination of letters and numbers. We entered "website_response_policy".
- State. Specifies whether Skylar One should start collecting data specified in this policy from the device. We selected Enabled.
- Port. Port on web server to which Skylar One will send queries. We left this blank.
- Timeout. After a specified number of seconds, Skylar One should stop trying to connect to the server. We accepted the default value.
- Error Codes. Specify the HTTP status code you expect to receive in the response. We accepted the default value.
- Proxy Server:Port. For companies or organizations that use proxy servers, enter the URL and port for the proxy server in this field. We left this field blank.
- Proxy Username:Password. For companies or organizations that use proxy servers, enter the username and password for the proxy server in this field. we left this field blank.
- Uniform Resource Locator (URL). URL or URI of the server to send the transaction to. For this example, we wanted to use a web site we knew we could always reach and that would always have content. We entered "http://www.cnn.com/US".
- Post String. If the URL is very long or requires data that cannot be transferred with a standard "GET" request (that is, data that cannot be included in the URL), you can enter a POST string in this field. We left this field blank.
- Cookie Value. For pages that require a cookie value to be set, enter the cookie value in this field. We left this field blank.
- Browser Emulation. Specifies how to format the query. Select the agent that is compatible with the web server. We accepted the default value.
- HTTP Auth Username:Password. For web sites that pop up a dialog box asking for username and password, use this field. We left this field blank.
- SSL Encryption. Specifies whether Skylar One should use SSL when communicating with the web site. If login for the web site is forms-based, enable this option. We accepted the default value.
- Expression Check #1. Regular expression to search for. For this example, we wanted to search for a word that would appear within a news web site. We entered "Obama"
- Expression Check #2. Another regular expression to search for. We left this field blank.
- Referrer String. URL of the web site. Some load-balanced configurations will not allow a request for a specific IP address. If you entered a specific IP address in the URL field, you can spoof a URL in this field. We left this field blank.
- Host Resolution. Host name of the web site. Some load-balanced configurations will not allow a request for a specific IP address. If you entered a specific IP address in the URL field, you can spoof a fully-qualified host name in this field. We left this field blank.
- Min Page size (Kb). Page size means the size of the page, in Kb, specified in the URL of the policy. If the returned page is not at least the size specified in this field, Skylar One generates an event. This threshold triggers the event "Page size below minimum threshold." We left this field blank.
- Max Page size (Kb). Page size means the size of the page, in Kb, specified in the URL of the policy. If the returned page is larger than the size specified in this field, Skylar One generates an event. This threshold triggers the event "Page size above maximum threshold." We left this field blank.
- Min Download speed (kb/s). Download speed is the speed, measured in Kb/s, at which data was downloaded from the server (specified in the policy) to Skylar One. If the download speed is not at least the speed specified in this field, Skylar One generates an event. This threshold triggers the event "Download speed below threshold."
- Max nslookup time (msec). NSlookup speed is the speed at which your DNS system was able to resolve the name of the server specified in the policy. If the lookup time exceeds the value in this field, Skylar One generates an event. This threshold triggers the event "DNS hostname resolution time above threshold." We left this field blank.
- Max TCP connect time (msec). TCP connect time is the time it takes for Skylar One to establish communication with the external server. In other words, the time it takes from the beginning of the HTTP request to the TCP/IP connection. If the connection time exceeds the value in this field, Skylar One generates an event. This threshold triggers the event "TCP connection time above threshold." We left this field blank.
- Max Overall transaction time (msec). Overall transaction time is the total time it takes to make a connection to the external server, send the HTTP request, wait for the server to parse the request, receive the requested data from the server, and close the connection. If the overall transaction time exceeds the value in this field, Skylar One generates an event. This threshold triggers the event "Total transaction time above threshold." Because our SLA requires that the home page respond within 8 seconds, we entered "8000".
- Select the button to save the new policy.
Creating the IT Service Policy
To define an IT Service policy, you must:
- Define a service name and basic properties. This example monitors a single web server . The name of the IT Service policy will be "web_hosting_home".
- Define a list of devices (model) for the IT Service that includes the web server we want to monitor.. This example includes the web server that is also associated with the web-content monitoring policy we created in the previous section.
- Optionally, define service sets. A service set is a sub-group of devices. This example does not use service sets.
- Define metrics. A metric is based on your business processes and examines all devices or one or more service sets to evaluate the state of the IT Service. For each IT Service, Skylar One provides a default metric called Average Device Availability, based on the availability of all devices in the IT Service. You can define additional metrics, based on default data collected by Skylar One (availability, latency, CPU usage, memory usage, swap usage, device state, and device count), data collected by a Dynamic Application, and data about network interfaces, TCP/IP ports, system processes, Windows services, Email round-trip time, web content, SOAP/XML transactions, and DNS availability. Our example will use data collected by a web-content monitoring policy.
NOTE: When Skylar One evaluates a metric, it performs an aggregation, that is, Skylar One evaluates the data for all devices specified in the definition of the metric, over a specified time period (the Aggregation Frequency). Depending on the definition of the metric, Skylar One calculates the average, maximum, minimum, sum, standard deviation, or count value for all devices specified in the definition of the metric.
- Define Key Metrics. Key Metrics are the standard method for describing the status of an IT Service. Key Metrics allow you to quickly gauge the status of multiple IT Services, even if those IT Services require very different metrics that aggregate very different performance data.The Key Metrics are Health, Availability, and Risk. When you define a Key Metric, you are specifying how the value for a metric you created in step 4 translates to one of the standard Key Metric values. By default, all three Key Metrics are based on the default Average Device Availability metric.
- Define alerts and associated events. This example does not include alerts and events.
Defining the Name of the IT Service Policy and its Basic Properties
To define the basic parameters of our example IT Service policy:
- Go to the IT Service Manager page (Registry > IT Services > IT Service Manager).
- Select the button. The IT Service Editor page appears, with the tab and sub-tab selected:
- Supply the following values in the following fields:
- IT Service Name. Name of the IT Service policy. We entered "web_hosting_home".
- IT Service Owner. Automatically populated with your username.
- Configuration Mode. We selected Basic Interface. The Basic Interface allows you to quickly setup an IT Service policy.
- Sharing Permissions. Specifies whether other users can view and use the IT Service policy, in both the IT Service Manager page, IT Service Editor page, and in the pages in Skylar One where the IT Service is visible. We selected Shared with users in your organization. The IT Service policy can be viewed and used by other users who belong to the same organization as the creator.
- Permission Keys. We did not select any permission keys.
- Operational Status. We selected Aggregation enabled.
- Aggregation Frequency. Frequency at which Skylar One will collect data from all devices in the IT Service and "crunch" the data for each metric into a single value. We specified Every 5 Minutes.
- Raw Data Retention. Specifies how long Skylar One should store the raw data for the IT Service policy. We accepted the default value.
- Frequent Rollup Retention. Deprecated field no longer used by Skylar One.
- Hourly Rollup Retention. Specifies how long Skylar One should store the "hourly" normalized data for the IT Service policy. We accepted the default value.
- Daily Rollup Retention. Specifies how long Skylar One should store the "daily" normalized data for the IT Service policy. We accepted the default value.
- Description. We did not enter a description.
- Select the button to save the values in the tab.
Defining a List of Devices for the IT Service Policy
After defining the name and basic properties of an IT Service policy, you must next determine the devices to include in your IT Service policy. You do this in the sub-tab.
For example, if you want to monitor Email service, you could create a list of devices that includes Exchange servers, DNS servers, and devices that run Email round-trip policies.
You can manually assign devices and device groups to the IT Service device group, or you can use membership rules, like you would for a dynamic device group.
When you define the list of devices to include in your IT Service policy, that list of devices appears as a device group throughout Skylar One.
There are three ways to add a device to the list of devices for the IT Service policy.
- Add a device group to the list of devices for the IT Service policy.
- Add a static list of one or more devices to the list of devices for the IT Service policy.
- Add a dynamic list of one or more devices to the list of devices for the IT Service policy.
In our example, we will add a static list of devices that includes a single web server to the IT Service policy.
To create the list of devices for the IT Service policy.
- After performing the tasks in the previous section, select the sub-tab.
- To add a static list of one or more devices to the list of devices for the IT Service policy, go to the Static Devices pane.
- Select the button. The Device Alignment modal page appears and displays a list of all devices in Skylar One.
- In the Device Alignment modal page, we selected the checkbox for devices "HQ-W2K3-JUMP01".
- Select the button in the lower right.
- The selected devices appear in the Static Devices pane.
- Select the button to save the list of devices.
Defining Metrics for the IT Service Policy
A metric is a measurement that helps determine the status of an IT Service.
Skylar One automatically includes a default metric with each IT Service policy. The default metric is called Average Device Availability. The Average Device Availability metric aggregates the current availability value (0 or 1) of all devices in the IT Service and calculates the average value. The aggregation is performed at the frequency specified in the Aggregation Frequency setting in the basic properties for the IT Service policy. The availability of a device is determined every 5 minutes.
Before you can define a metric, you must determine what parameters you want to monitor for the IT Service policy. In our example, we will create a single custom metric. We will use data from the following sources to monitor the IT Service:
- Web Content Monitor
Our custom metric is:
- website_response (based on a Web Content Monitor created in a previous section)
We will create our metric in Basic mode. We will leave the default metric unchanged and create an additional metric.
- After performing the tasks in the previous section, select the sub-tab.
- Ensure that you are in Basic mode. If you see the sub-tab, you are not in Basic mode. Click on the button to toggle to Basic mode.
- Next, we will define a new metric that examines the response time of a web-content policy. The web content policy is associated with the web server we added in the tab. Go to Service Metric Definitions pane and select the button.
- The Service Metric Editor modal page appears. In this page, we will define a metric that measures the latency of the two devices in our IT Service policy. We will also define an alert that will trigger an event if the average latency of the two devices is greater than 30 milliseconds.
- To create the new metric, supply the following values in the fields:
- Service Metric Name. We entered "website_response".
- Metric Type. We selected Web Content Monitor.
- Device Metric. We entered "website_response_policy". This is the policy we created in a previous section.
- Metric. We selected Transaction Time.
- For all other fields in the top pane, you can accept the default values.
Defining Key Metrics for the IT Service Policy
Key Metrics are the standard method for describing the status of an IT Service. Key Metrics allow you to quickly gauge the status of multiple IT Services, even if those IT Services require very different metrics that aggregate very different performance data. For example, you can define "health" for a remote backup service and also define "health" for an Internet bandwidth service, even though you would use different criteria to measure the health of those two services.
All IT Service policies define how Skylar One should calculate the following Key Metrics for the IT Service:
NOTE: Skylar One automatically includes a default metric with each IT Service policy. The default metric is called Average Device Availability. The Average Device Availability metric specifies that Skylar One should aggregate the availability data for all the devices in the policy and calculate the average availability.
- Service Health. The health of an IT Service can be one of the five standard severity values: Healthy, Notice, Minor, Major, or Critical. By default, the Service Health metric is aligned with the Average Device Availability metric.
- Service Availability. The availability of an IT Service can be either Available or Unavailable. By default, the Service Availability metric is aligned with the same metric as Service Health, converting Critical Service Health to Unavailable and all other Service Health values to Available.
- Service Risk. The risk of an IT Service is a percentage value that indicates how close an IT Service is to being in an undesirable state. By default, the Service Risk metric is aligned with the same metric as Service Health, converting the threshold between Healthyand Notice Service Health to 100% and the healthiest possible value to 0%.
Skylar One generates an event if the Service Health Key Metric has a value of Notice, Minor, Major, or Critical, and/or if the System Availability Key Metric has a value of unavailable.
For more details on Key Metrics, see the main section on Key Metrics.
Using the metric we created in the previous section, we'll define the Key Metrics for our IT Service policy:
- Select the sub-tab.
- In the top pane, you will see the default metric, Average Device Availability. If you have already defined additional custom metrics, they will also appear in the top pane.
- In the bottom pane, you will see the three Key Metrics.
- To edit each metric, supply the following values:
- Service Health. Appears in the Health column in the IT Service Manager page (Registry > IT Services > IT Service Manager). Possible values are Healthy, Notice, Minor, Major, and Critical. Accept the default values for this Key Metric.
- Service Availability. Appears in the Availability column in IT Service Manager page (Registry > IT Services > IT Service Manager). Possible values are Available and Unavailable.
- In the drop-down list that appears above the Service Availability Key Metric, select website_response.
- Select Increasing.
- Set the bottom of the range to "0". Set the top of the range to "9000".
- Enter the threshold 8000.
- If the website_response metric has a transaction time greater than 8000 ms, the IT Service policy will have an Availability value of Unavailable.
- Service Risk. Appears as a percentage in the Risk column in the IT Service Manager page (Registry > IT Services > IT Service Manager). Possible values are 0% - 100%. Accept the default values for this Key Metric.
- Select the button to save your changes to the Key Metrics.
Creating an SLA Definition
In Skylar One, you can create an SLA Definition. The SLA Definition is a threshold. The threshold is applied to the Availability Key Metric of an IT Service policy.
To create an SLA Definition:
- Go to the Service Level Agreement Definitions page (Registry > IT Services > SLA Definitions).
- In the Service Level Agreement Definitions page, select the button.
- The SLA Definition Editor page is displayed.
- In the SLA Definition Editor page, supply values in the following fields:
- SLA Definition Name. The name of the SLA Definition. Can be any combination of numbers, letters, and symbols. We entered "website_response_sla".
- SLA Availability. The threshold that will be evaluated using this SLA Definition. You can select from six predefined percentage values or specify a custom value. If you select Custom in the drop-down list, enter a percentage value in the text field. You can evaluate an IT Service policy using this threshold; you can do this in a dashboard widget or in an SLA report. We selected Custom and then entered "99.99%".
- Select the button to save your new SLA Definition.
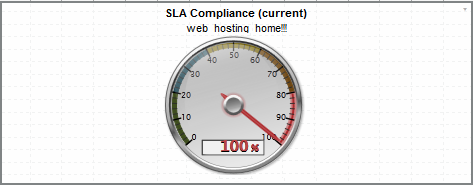
Generating the SLA Widget
To add the SLA widget to your dashboard:
- In the Dashboards tab page ( tab), in the selection field in the upper left of the page, select the dashboard to which you want to add a widget.
- Select the button, and then select Add Widget.
- The New Widget Configuration modal page is displayed:
- In the NavBar, expand the Single Point icon. Expand the SLA category. Select (base) SLA Gauge.
- Enter values in the following fields:
- Widget Name. Enter a title for the widget. This title is displayed in the header that appears at the top of the widget. If you leave the default value of "{auto}" in this field, Skylar One will automatically generate a title for the widget based on what is currently being displayed in the widget. We left this field blank.
- Widget Refresh Rate. Specify how frequently the widget will be automatically updated with new data. We selected 5 minutes.
- SLA Definition. Select the SLA you want to use as a threshold and monitor with this widget. We selected website_response_sla.
- Service. Select the IT service you want to monitor with this widget. We selected web_hosting_home.
- Compliance Period. Specify the time period you want to monitor with this widget. We selected Last (most recently ended).
- Display Type. Select how the metric will be displayed in the widget. We selected Gauge.
- You should see a widget like the following:
Generating the SLA Report
You can use a Quick Report to evaluate an existing IT Service policy using an existing SLA definition. The Quick Report will then display the results. To do this:
- Go the Run Quick Report page (Reports > Run Report).
- In the Run Quick Report drop-down list, select the report SLA Report.
- Enter a value in each of the following fields:
- Report Span. Specify a Daily, Weekly, or Monthly span to include in the report. We selected Monthly.
- Starting. This field allows you to choose a start date. Selecting a different Report Span will change the options in this drop-down list. We selected Last Month.
- Duration. This field allows you to specify the duration for the report. Selecting a different Report Span will change the options in this drop-down list. We selected 1 month.
- Timezone. Specify the time zone to display in the report. We accepted the default value (UTC).
- IT Service. Select the IT Service you want to monitor with this report. We selected web_hosting_home.
- SLA. Select the SLA you want to use as a threshold and monitor with this report. We selected website_response_sla.
- Output Format. Specify an output format for the report.
- Select the button to generate the report.
- The generated SLA report displays the target threshold and the percentage of polls that were successful. The report displays the days violations occurred and the number of minutes each violation lasted.