The Dashboards page is the default page that displays when you open Skylar Advisor. This page contains a list of all your interactions and notices related to Skylar Advisor,
These activities include "Advisories", "Investigations", and "Predictions", which will be explained in this chapter.
This page also includes links to your conversations with Skylar Advisor and any artifacts that you or Skylar Advisor generated.
What is an Advisory?
Advisories are events that Skylar Advisor considers to be the most important issues for you. They help uncover and provide resolution guidance for critical problems. Advisories are automatically generated in Skylar Advisor by looking for meaningful patterns across events instead of reacting to every alert in isolation.
Advisories are designed to help you focus your attention so you can take informed action instead of chasing event noise. An Advisory is a synthesized insight, not a raw alert. An Advisory represents a pattern of related issues (an "event group") that is impacting multiple devices or components and is persisting long enough to indicate real operational impact. Correlation is based on event severity, event message patterns, and metadata, such as entity, status, or service.
When you click an Advisory on the Dashboards page, you can view additional details about it, including a summary of the issue, root cause analysis, troubleshooting information, and more. You can also use the Ask Skylar feature when you have an Advisory open to do more research on the Advisory. To help you with your questions, Skylar Advisor will generate a set of Quick Prompts, which are additional prompts related to the event.
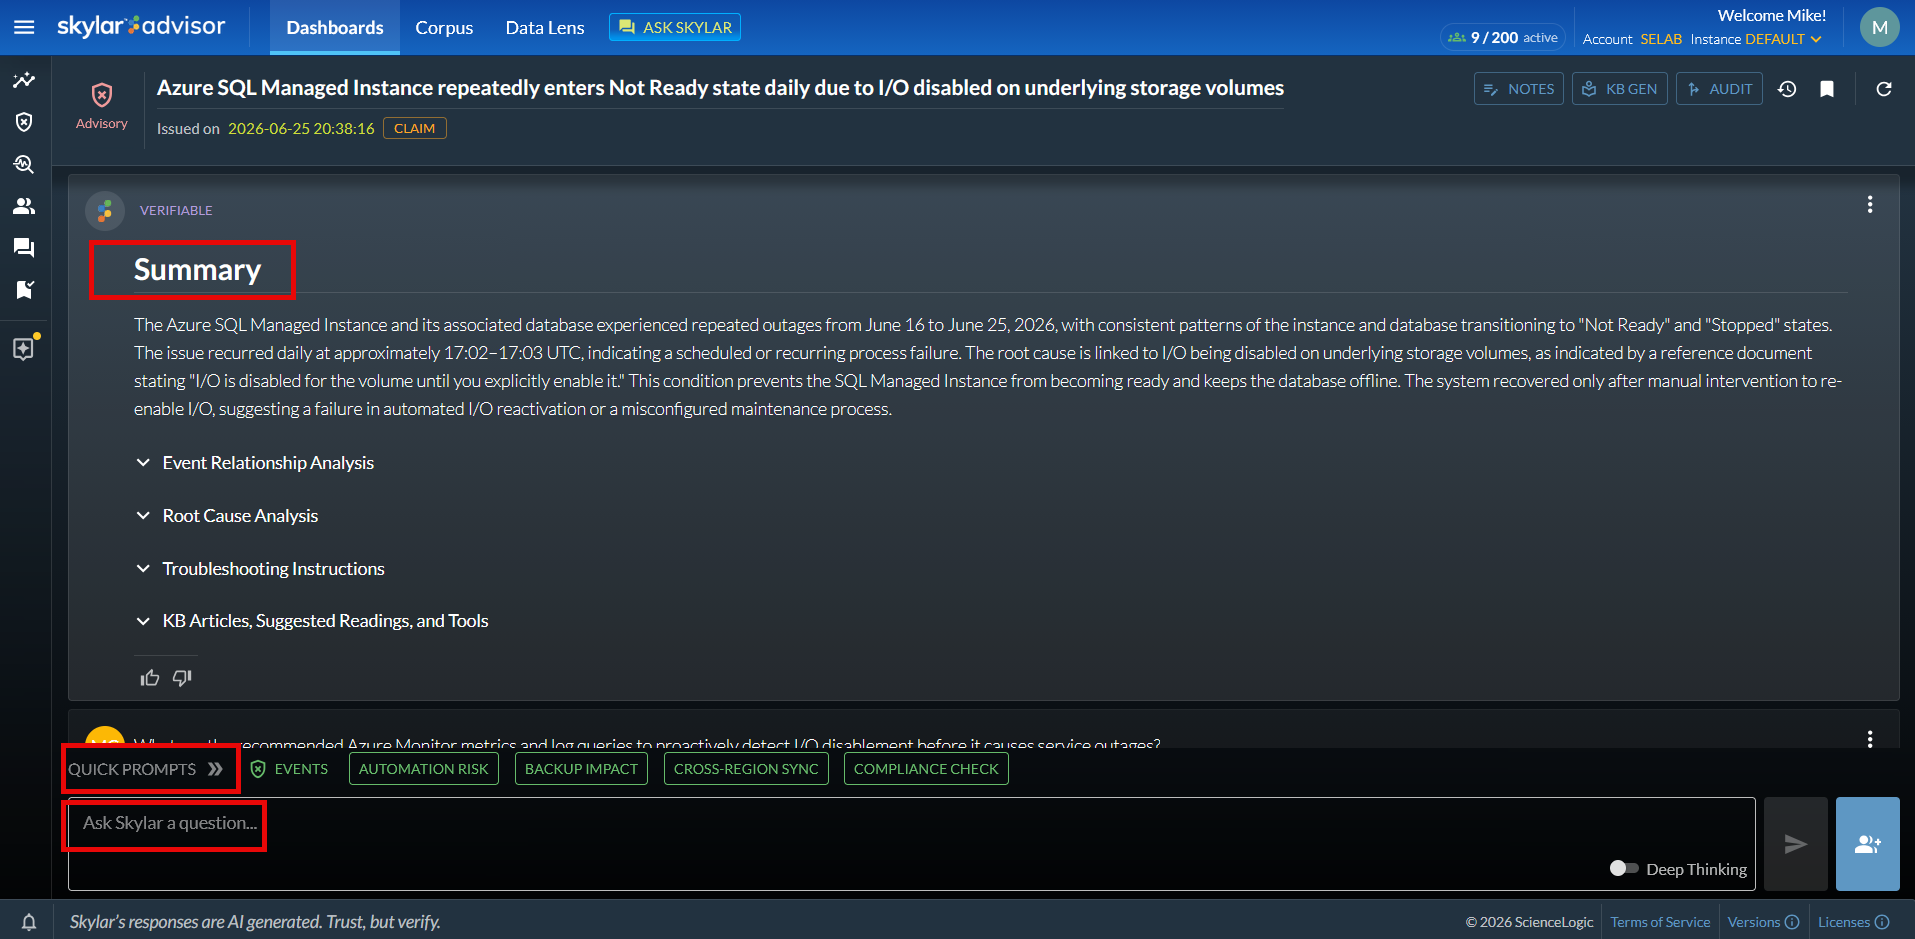
At the top of an Advisory, you can click the tag to open the Related Events panel. This panel lists additional information about all of the devices and events related to this Advisory, including root cause. You can click View graph on the panel to view the flow of the events leading to the Advisory.
Under the tag, you can click the button to assign this Advisory to yourself. For more information, see Working an Advisory From Claim to Close.
When Skylar Advisor creates an Advisory, it also sends data about that Advisory to Skylar One as an alert. If you have an event policy set up to handle these kinds of alerts, Skylar Advisor will generate an event that includes the Advisory title, summary, and a direct link to the Advisory in Skylar Advisor for streamlined investigation.
When you close an Advisory, Skylar Advisor sends a "Healthy" alert to Skylar One to enable automated event clearing.
What is an Investigation?
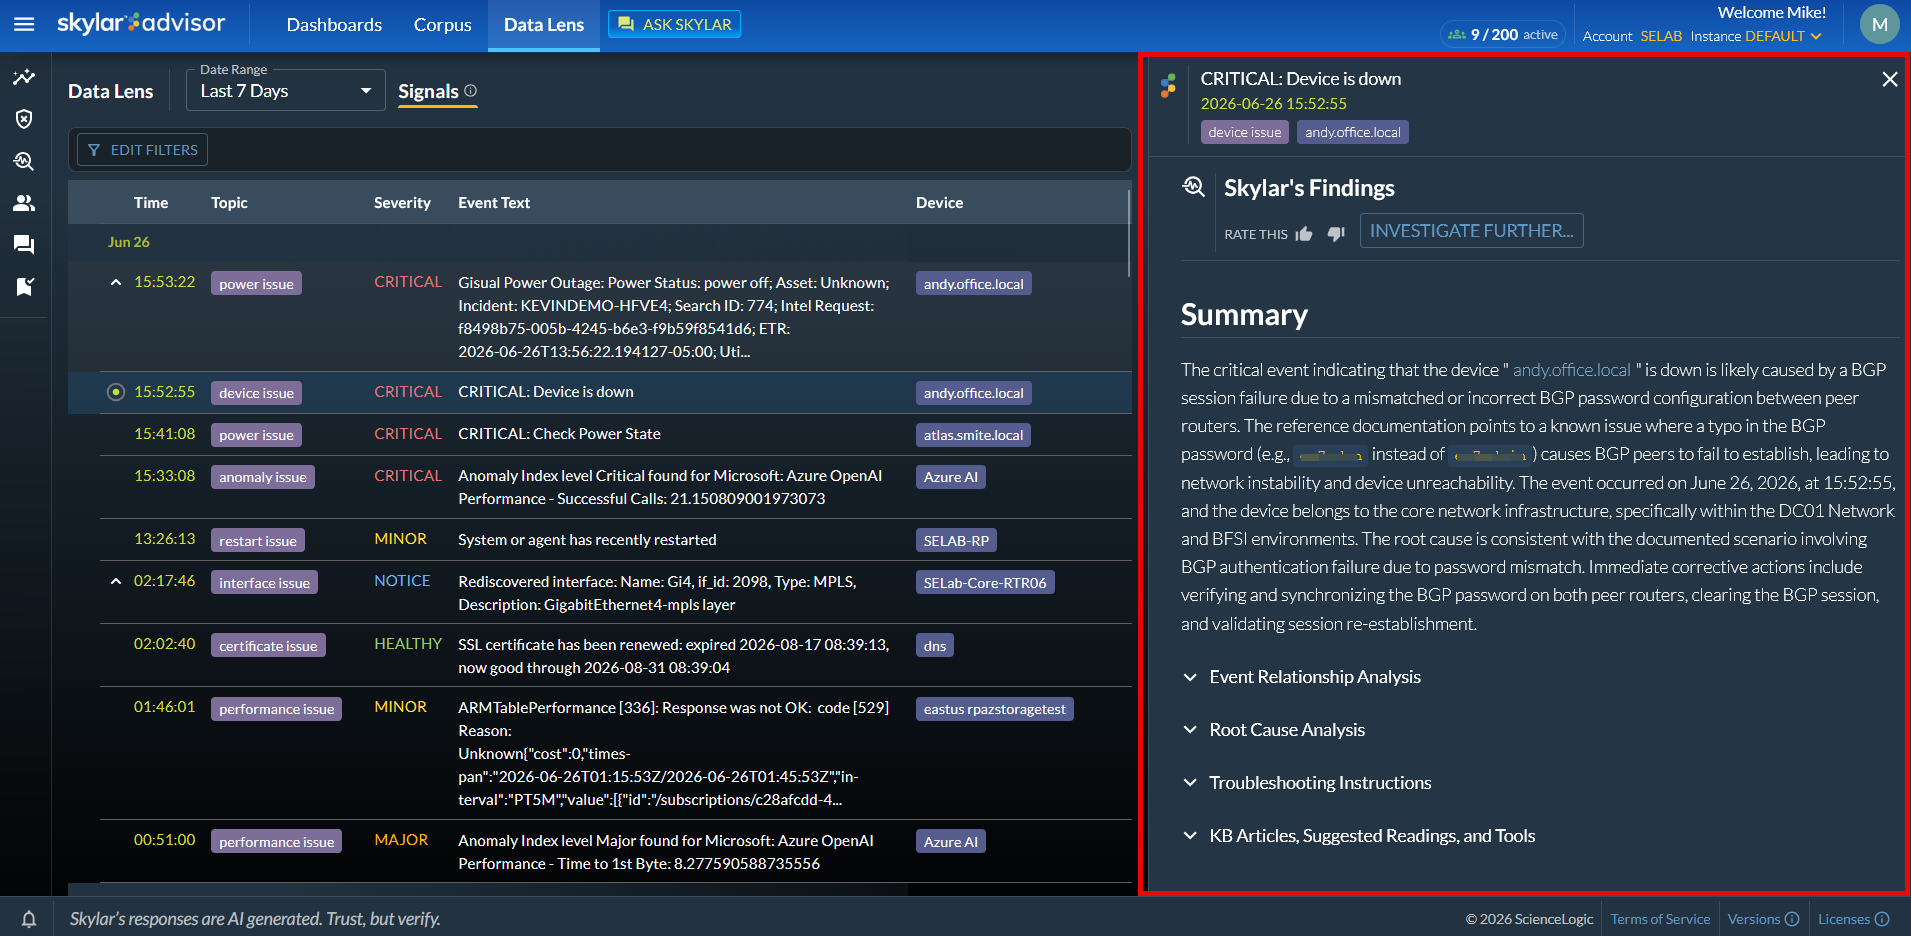
An Investigation is an on-demand event analysis that you can choose to generate for an event or event group.
You can create an Investigation by clicking the button or the button for an Advisory or an event from the Data Lens page. Skylar Advisor will then run an analysis on that event. The Investigation detail page lists the devices involved with the issue, along with any impacted device groups and business services.
What is a Prediction?
In Skylar Advisor, a Prediction is a potential event that might occur in the near future if no action is taken. Predictions in Skylar Advisor are based on data from Skylar One and Skylar Analytics.
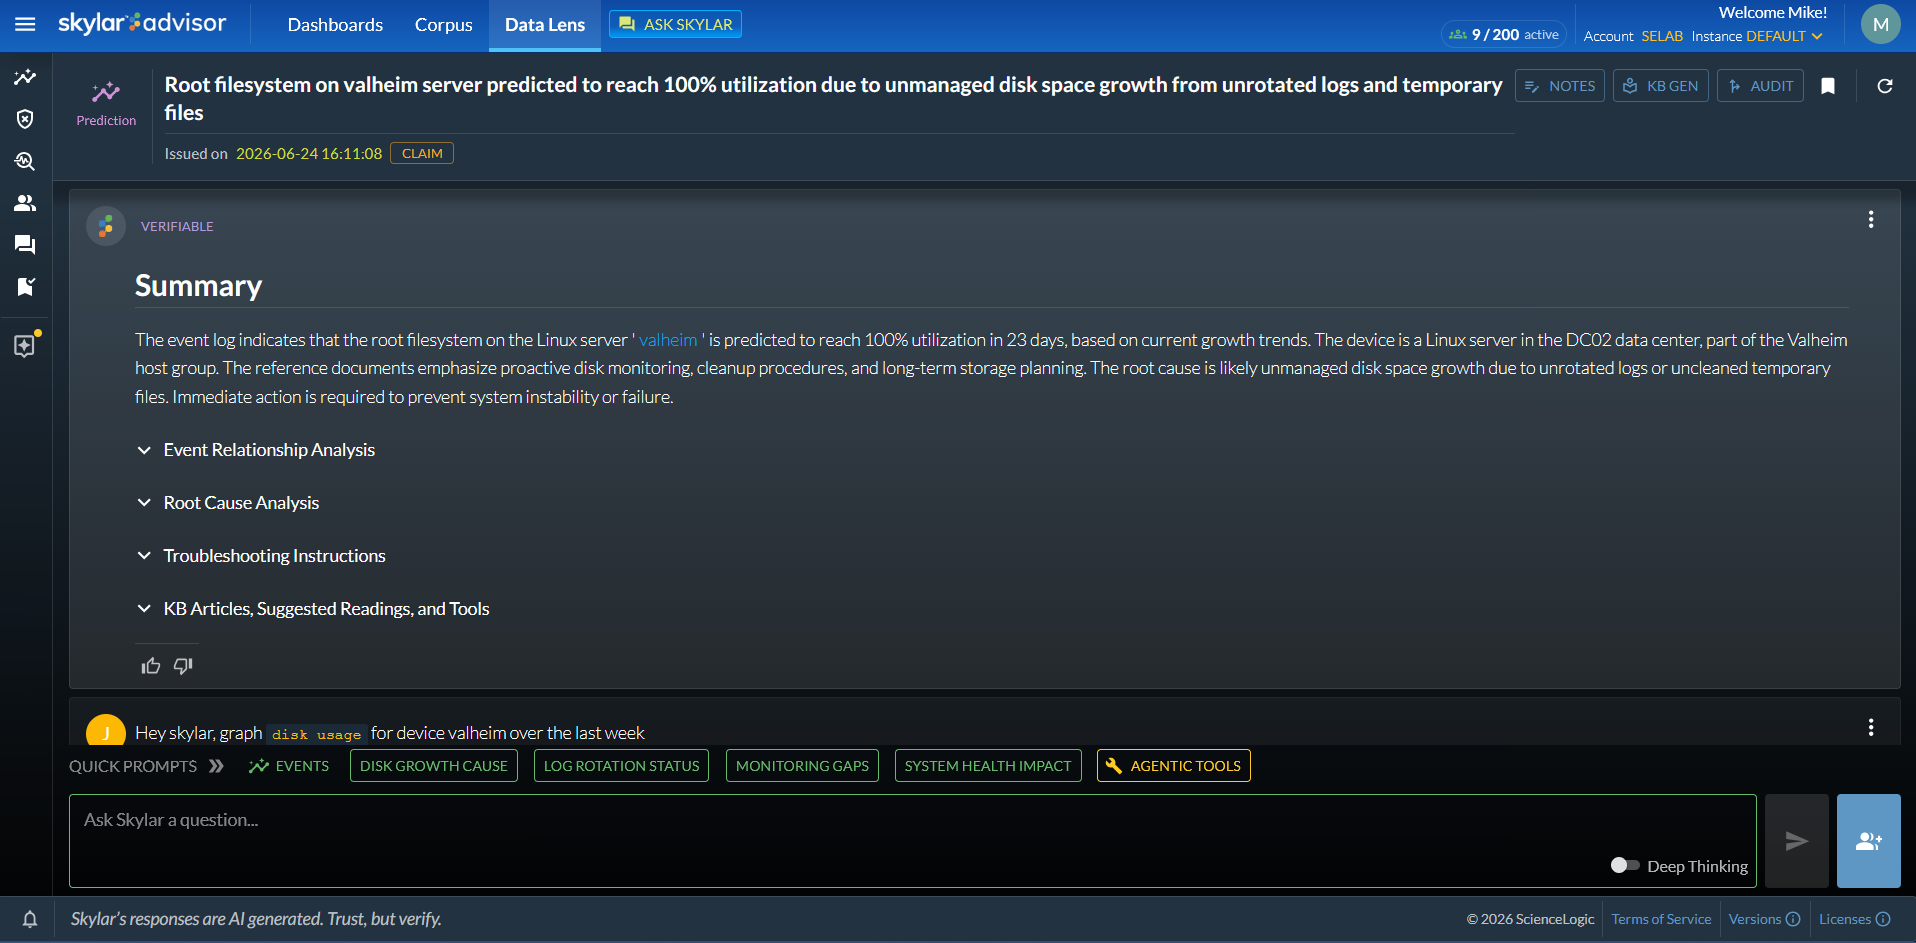
Skylar Advisor will label an Advisory as a "Prediction" if that Advisory was based on Predictive Alerting. Currently, Skylar Advisor generates predictions only from file system data.
The Dashboards Page
The Dashboards page contains a list of all your interactions related to Skylar Advisor, including Predictions, Advisories, Investigations, and conversations with Skylar Advisor.
This page provides access to filtered lists of alerts and events, organized by business service, device group, issue type, or organization. You can also access reports on this page.

Filters
You can use the filters at the top of the tab on the Dashboards page to focus on the information displayed on this page:
-
All. Shows all activities that occurred during the current time frame. On the left, a set of buttons display a numbered list of your activities, organized by type.
-
My Work. Shows all activities that you investigated, claimed, closed, asked, shared, or were shared with you. This filter always displays your Ask Skylar questions and answers. On the left, a set of clickable views display a numbered list of your activities and a numbered list of any artifacts you have generated, such as Knowledge Base (KB) articles, shared conversations, and bookmarked activities.
-
Time frame. Click the dates on this field to update the time frame of the data display. lets you move week-by-week through your past activities. You can update the time range, from six hours to 14 days, or you can select a custom range.
-
Search. Type search information into this text box to display activities that match your search text, or click the button to select additional filters.
All of the tabs on the Dashboards page have a button at top right. Click this button to open a pane with short training videos that walk you through the various features of Skylar Advisor, including a short video of the latest features for this version of Skylar Advisor.
Trend Analysis
The tab on the Dashboards page contains a trend analysis pane that charts conversation volume, outcomes, and trends over time for a quick summary of your Skylar Advisor activities. The pane contains a list of commonly used terms and most active users. It also charts conversation volume, outcomes, and trends over time, so you can see how Skylar Advisor is being used at a glance.
The Trends section contains quick filters that you can use to find similar, related activities. Based on the filter that you selected, the graph and other data below this section update with the filtered data.
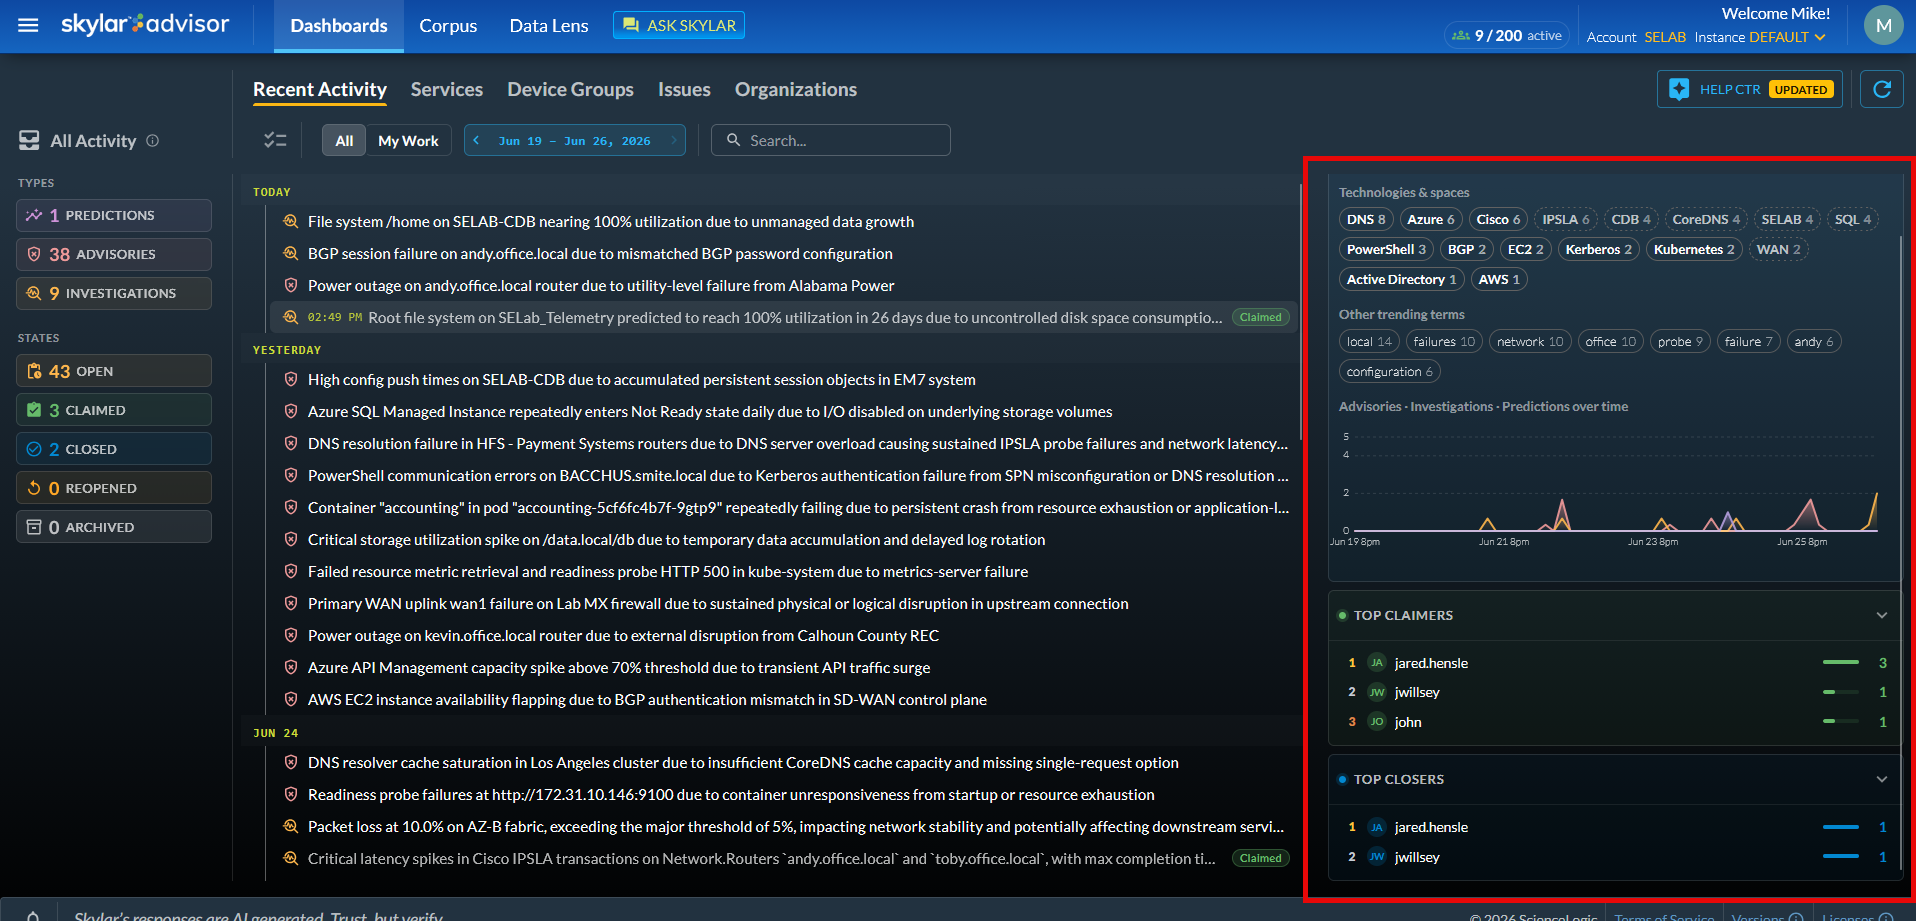
Activities and Options on the Recent Activity Tab
The tab on the Dashboards page displays the following activities and options in the All Activity/My Work pane on the left:
-
Predictions (
 ). Events that could potentially occur soon if nothing is done about them, based on data from Skylar One and Skylar Analytics. Currently, Skylar Advisor generates predictions only from file system data.
 -
Advisories (
 ). Events that Skylar Advisor considers to be the most important issues for you. They help uncover and provide resolution guidance for critical problems. Advisories are automatically generated by Skylar Advisor, and they directly correlate to alerts and events from Skylar One.
 -
Investigations (
 ). Ad-hoc event analyses that you can choose to generate for an event or event group. You create an Investigation by clicking the button for an Advisory on the Data Lens page.
 -
Shared Conversions (
 ). A list of interactions with Skylar Advisor using the Ask Skylar feature that have been shared with you by other Skylar Advisor users.
 -
Ask Skylar (
 ) The Ask Skylar text box includes the questions you asked Skylar Advisor using the Ask Skylar feature. You can ask Skylar Advisor "plain English" questions just like you would for any other large-language model (LLM) like ChatGPT or Claude. To continue a conversation from the list, click a question.
The pane includes a States section that lists activities that are Open, Claimed, or Closed, for example, and an Approval section for activities that are being reviewed. The My Work pane also includes an Artifacts section for any items that you have created, like KB articles or bookmarks, and any shared items.
Archiving an Activity
You can archive an activity to remove it from the list on the tab. Please note that Skylar Advisor never deletes activities or conversations.
To archive or remove one or more activities that you no longer want to see on this tab:
- On the tab, click the enter selection mode icon (
 ) to enable it (turn it blue).
 - Click the check box for any activity that you want to remove from the list. To select all activities, click the check all icon (
 ).
). - Click the archive selected icon (
 ). After you confirm your action, the activities are removed from the tab.
 - To view your archived activities, click the button and select Archived. On this page you can also "unarchive" an activity that was archived.
Bookmarking an Activity
You might want to bookmark an activity that has important data so you can find them quickly. This can be especially helpful for activities that are more than three months in the past, because you would need to use filters to find activities that are over three months old.
To bookmark one or more activities:
- On the tab, click the enter selection mode icon () to enable it (turn it blue).
- Click the check box next to any activity that you want to bookmark. To select all activities, click the check all icon ().
- Click the bookmark selected icon (
 ). The activities are removed from the tab.
 - To view your archived activities, click the button and select Archived.
On an activity detail page, you can also click the bookmark icon () at top right to add or remove a bookmark.
Creating a Knowledge Base Article Based on an Activity
On an activity detail page for an Advisory, Investigation, Prediction, or a Conversation, you can click the button to have Skylar Advisor create a draft Knowledge Base (KB) article based on that activity.
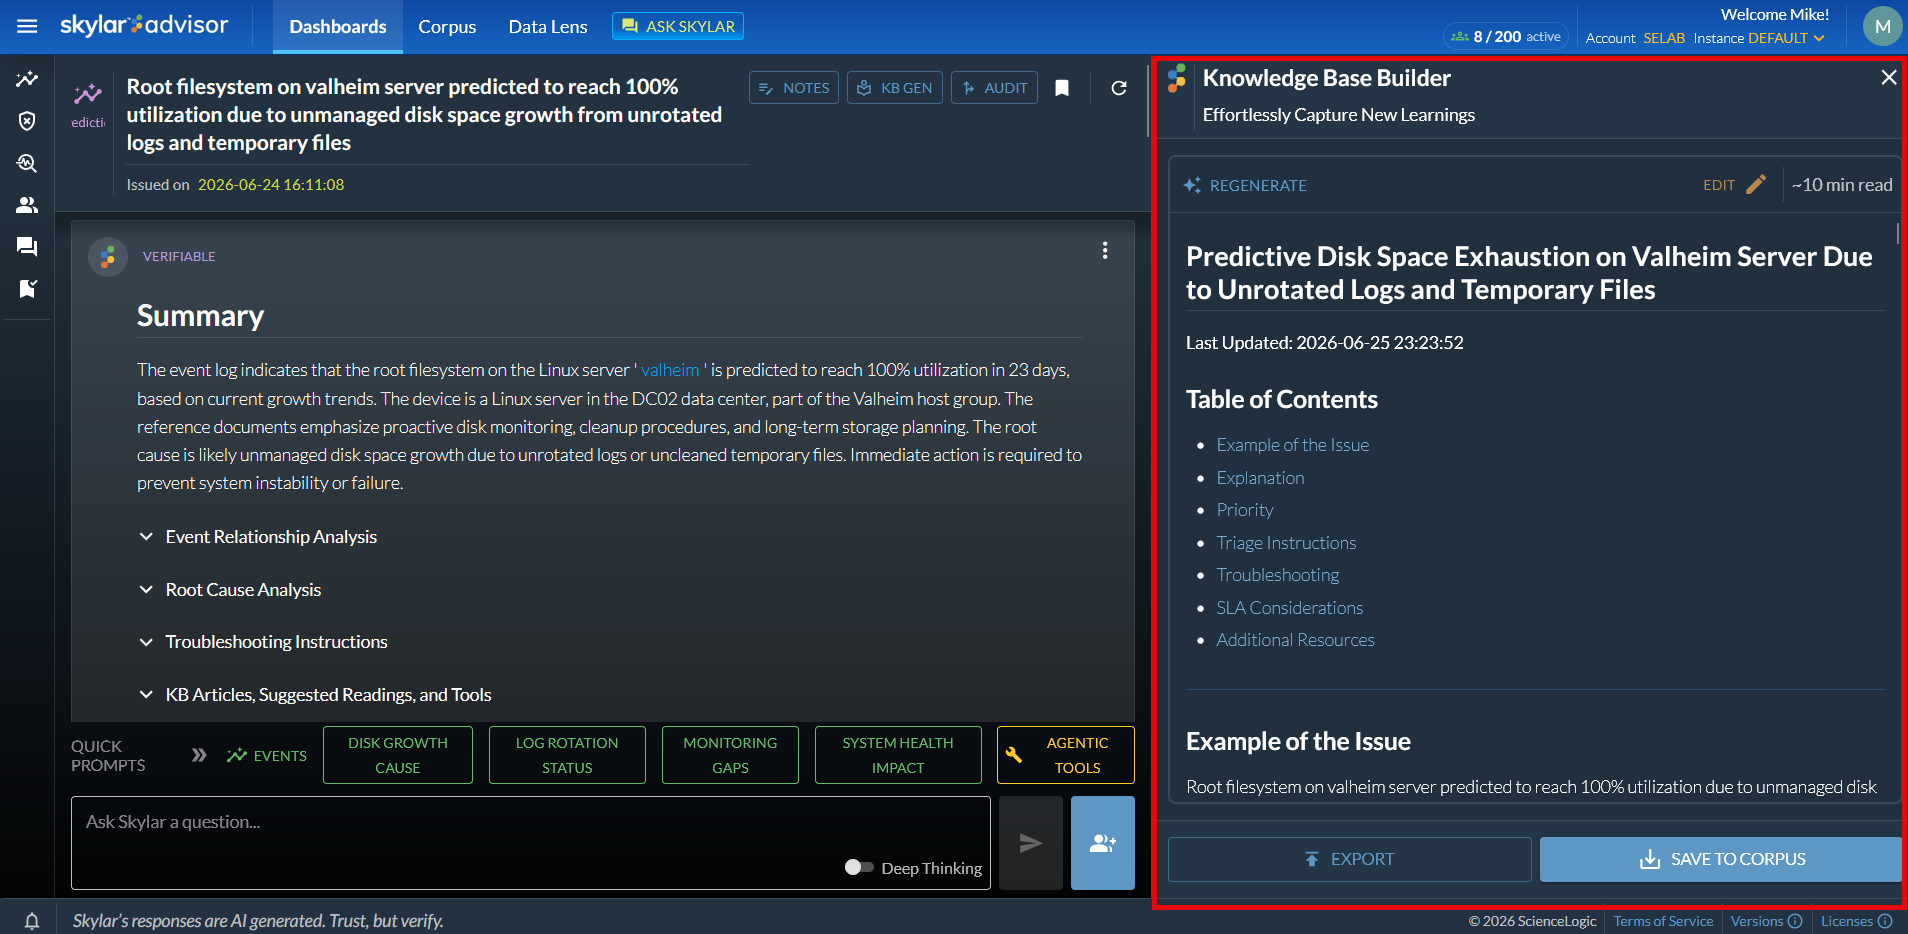
After Skylar Advisor creates the KB article, you can:
- Click to create the article again. You might want to regenerate an article if you asked Skylar Advisor additional questions or added a comment.
- Click to edit the article in Markdown format. In edit mode, you can click to see how your text looks with formatting, and you can click for a list of basic Markdown commands.
- Click to download the article as a PDF.
- Click to save the article to the Corpus page.
All KB articles created by Skylar Advisor include a "[Generated by Skylar AI]" tag at the end of the article.
Using the Notes Feature
On an activity detail page for an Advisory, Investigation, Prediction, or Conversation, you can click the button to open the Scratch Pad pane, where you can add notes in plain text or Markdown format.
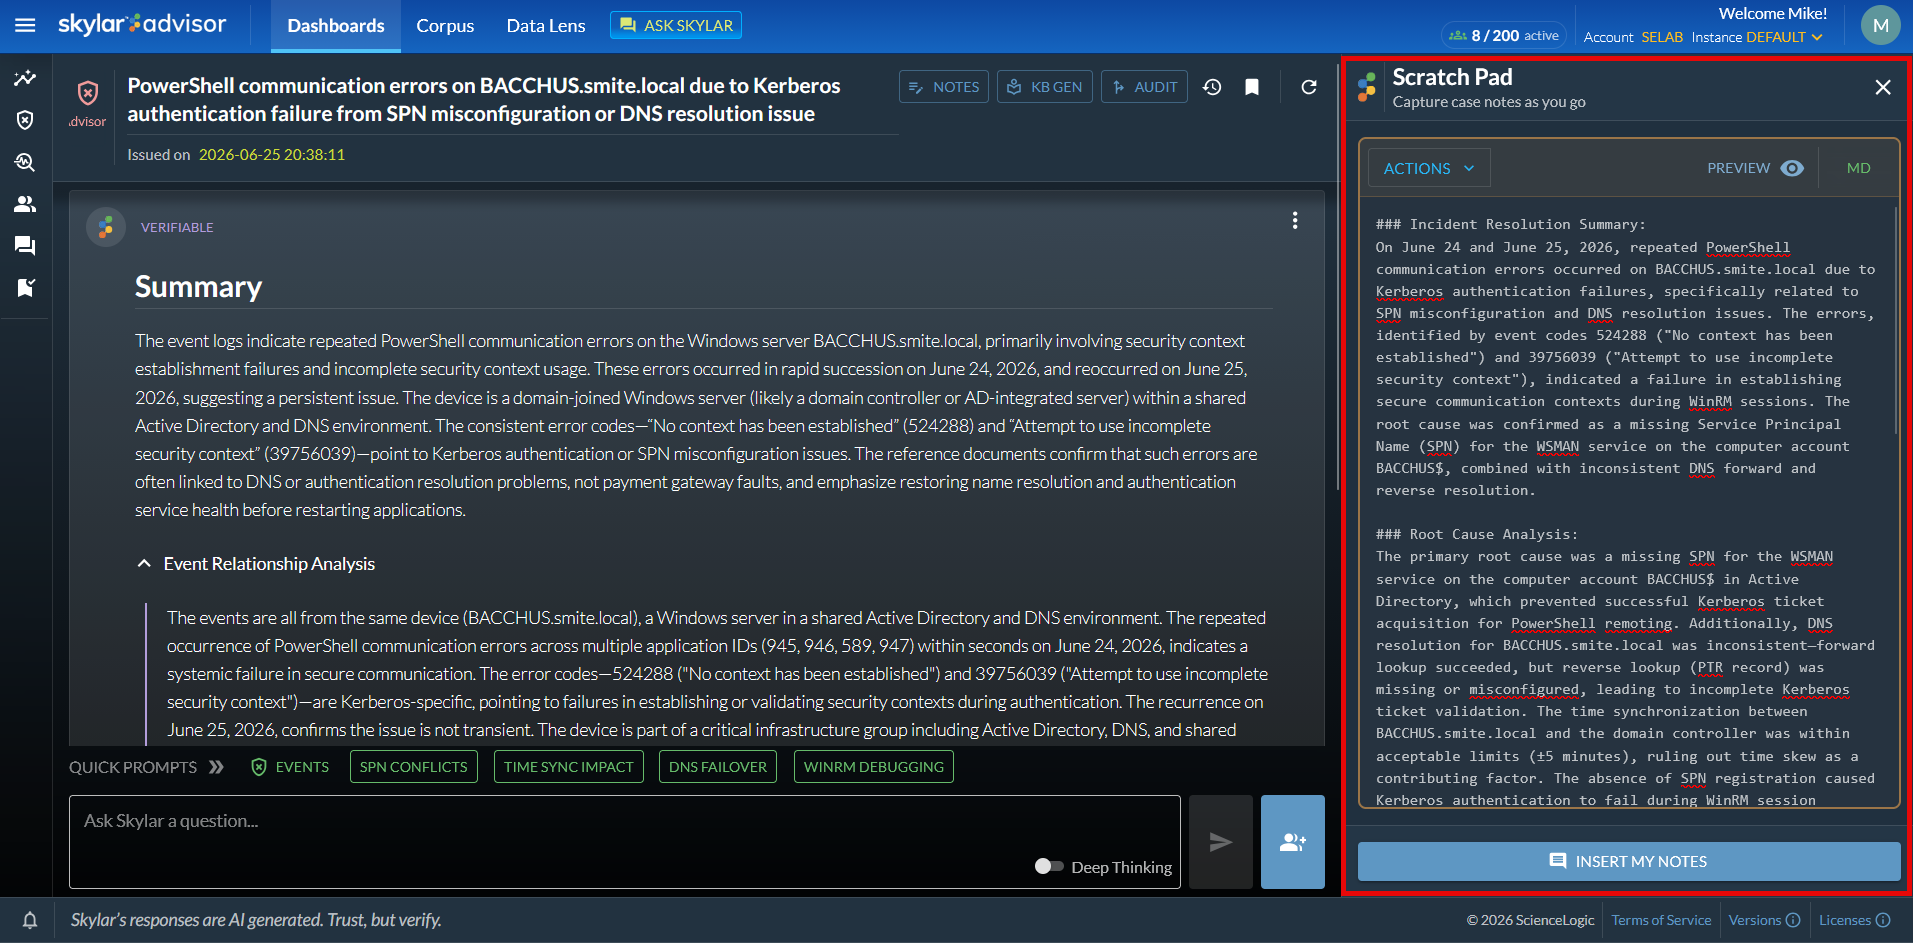
On the Actions menu, you can:
- Click Task List to generate a checklist of actions based on the selected activity.
- Click Incident Resolution to generate an Incident Resolution Summary document, which contains Root Cause Analysis, Impact, and other notes.
Click to see how your text looks with formatting. Click for a list of basic Markdown commands.
When you are done, you can click to add the contents of the Scratch Pad to the selected activity. Your notes will appear as a comment in the conversation.
The Services, Device Groups, Issues, and Organizations Tabs
The remaining tabs the Dashboards page display event information in different ways, but the various icons and buttons on those tabs work in the same way. There are four tabs:
- The tab displays a list of events for Skylar One business services.
- The tab of displays a list of events organized by Skylar One device group.
- The tab displays a list of events organized by issue type.
- The tab of the Dashboards page displays a list of events organized by Skylar One organizations.
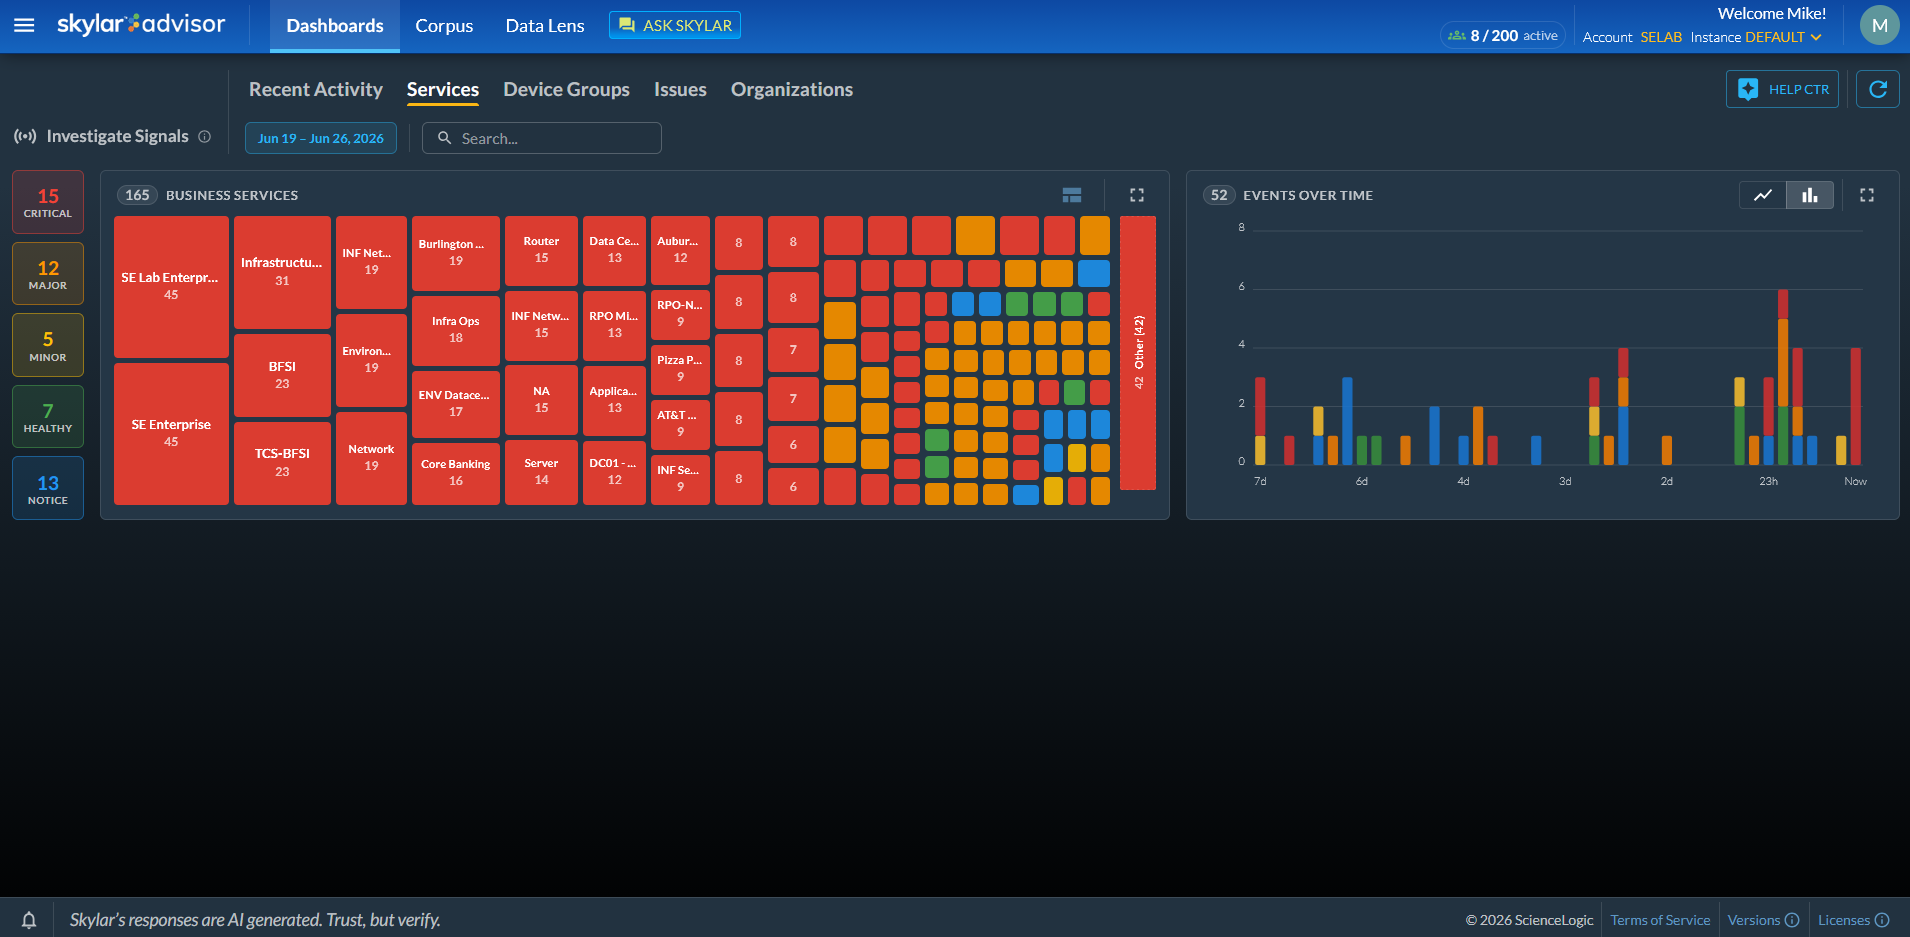
If you do not have any events for a specific tab, that tab will not display on the Dashboards page.
Viewing Basic Event Details on a Tab
You can use the icons on the left of the , , , and tabs to filter the list of events on these tabs to only show one type of severity, such as all Critical events for your organizations or customers. You can click multiple buttons as needed. Click the button or buttons again to view all the events again.
These tabs display a "heatmap" view ( ) that shows the events organized by severity in a color-coded graph, with Critical events displaying in red, Major events in orange, and so on. Click the "show treemap" view icon (
 ) to view the events without the heatmap colors.
When you mouse over a set of events organized by device group, issue, or organization, a pop-up displays a summary of the events for that set of events.
The Events Over Time pane displays events on a timeline based on either severity ( ) or by volume (
 ).
).
For any of the panes on these tabs, you can click the "expand to fullscreen" icon ( ) to make that pane full-screen. Click the "exit fullscreen" icon (
 ) to return the pane to its default size again.
Viewing More Event Details on a Tab
When you select one or more sets of services, device groups, issues, or organizations (based on the tab you selected), the Recent Events pane and the Skylar Analysis pane appear at the bottom of the page. Also, the Events Over Time pane updates to display date only for the selected items.
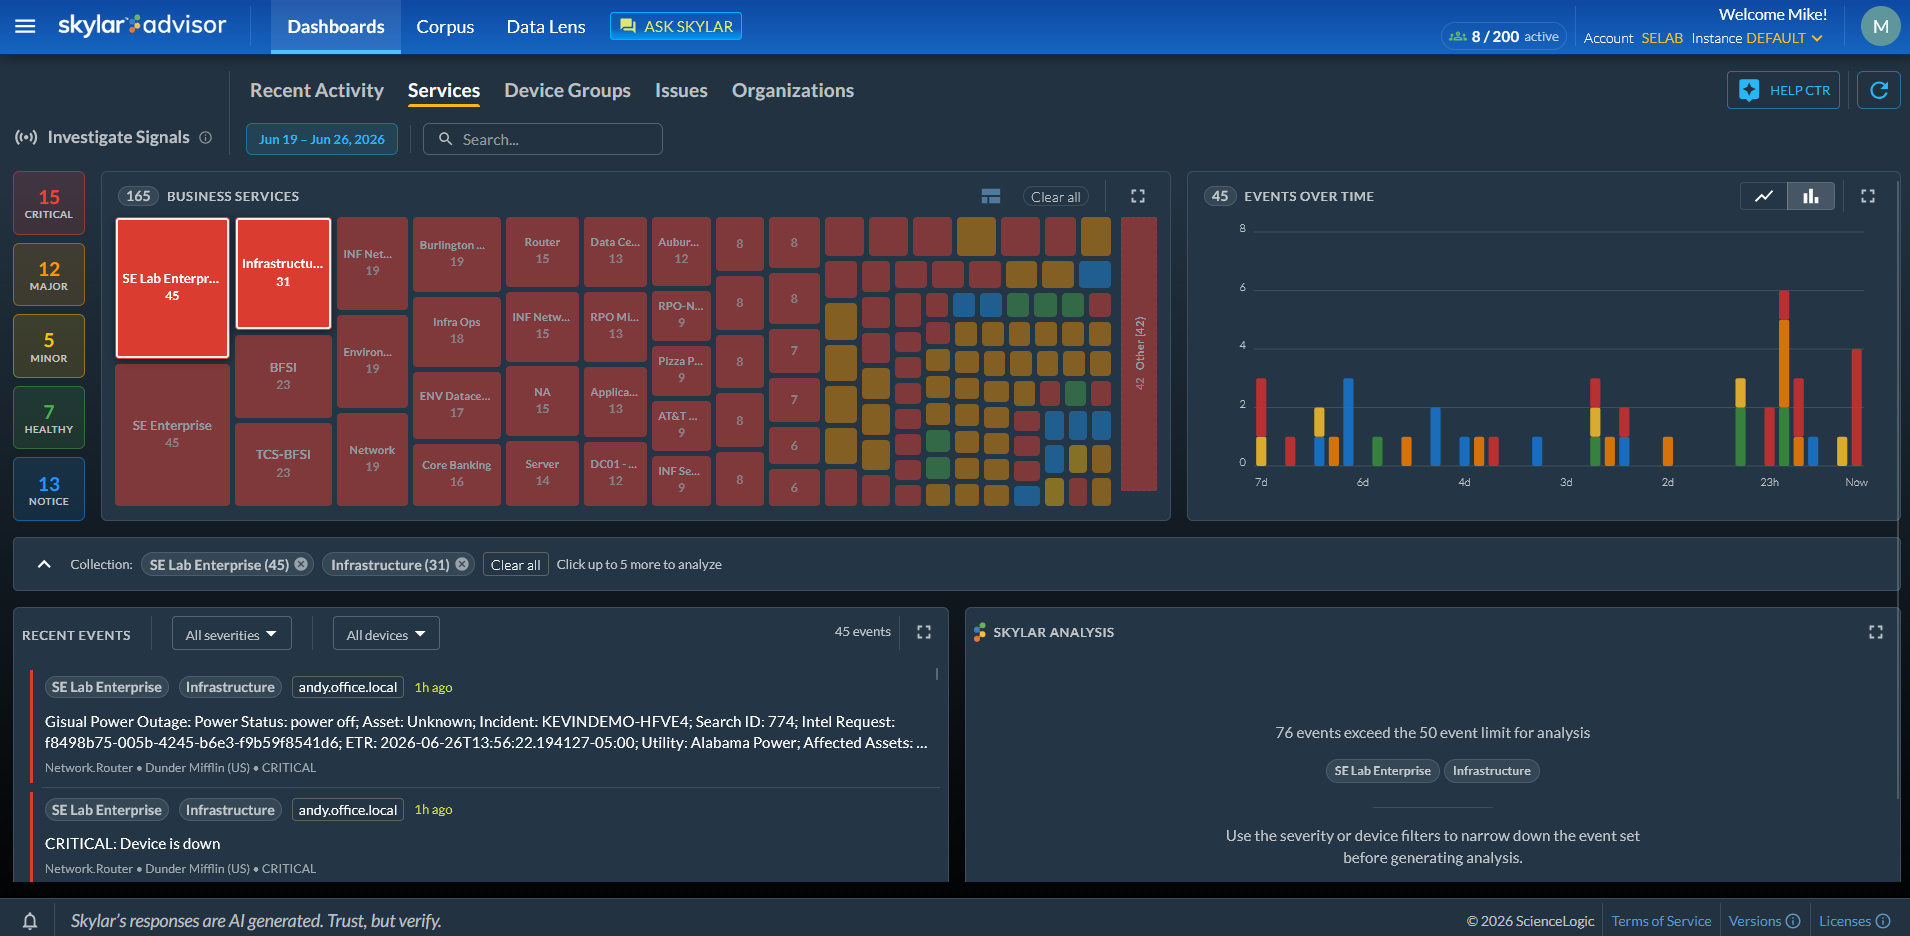
On the Recent Events pane, you can:
- Review the events from the item you selected above (in this example, all the "Server" events and the "Test-kgc" events).
- Click a device IP or device name to show only events for that device.
On the Skylar Analysis pane, you can:
- Click to have Skylar Advisor create a new analysis of the items you selected above.
- When the analysis is done, if you need more information, you can click to do a deeper investigation of the issue and create a new Investigation. The new Investigation is added to the tab of the Dashboards page.
Viewing User Activity on the Customer Insights Page
In the Skylar Advisor user interface, the Customer Insights page ( > Advisor > Customer Insights) is an interactive, read-only page that displays data about the activities of all users on that system and instance.
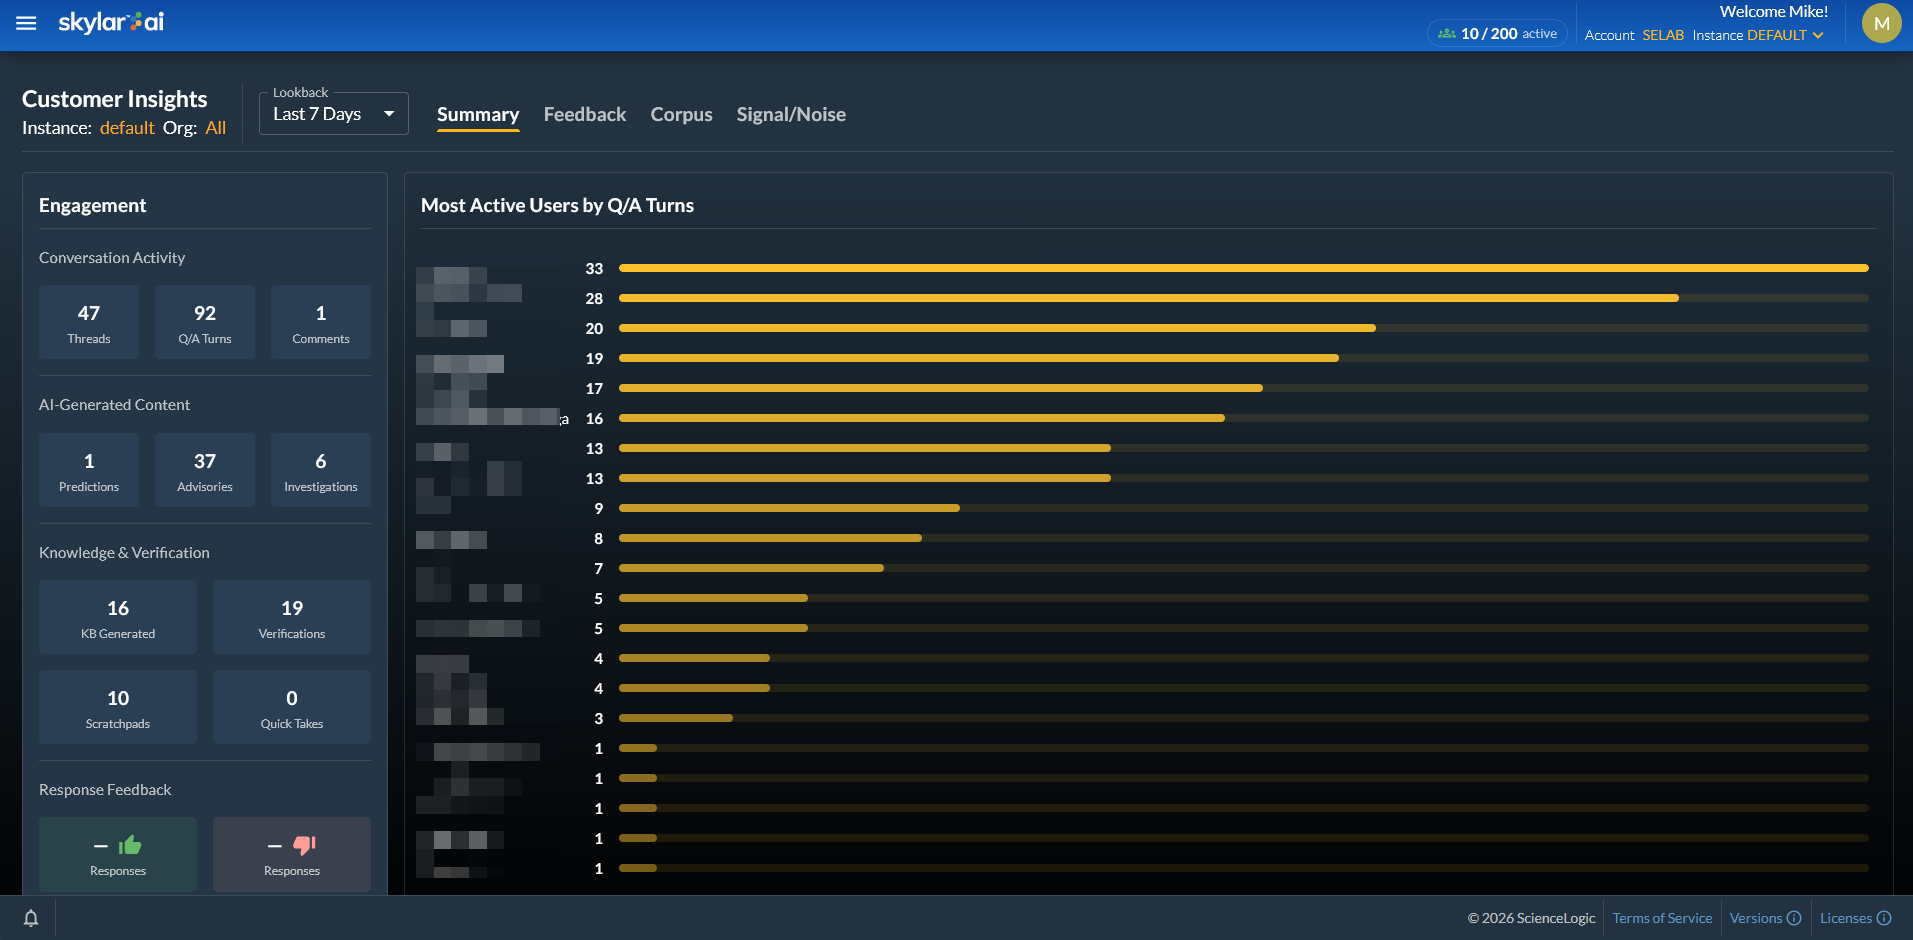
Currently, this page displays up to 50 users at a time.
The following tabs on the Team Analytics page let you view how all users are interacting with Skylar Advisor:
-
. In the Engagement section, displays the number of conversations, question-and-answer turns, and comments by users, as well as AI-generated content like Advisories, Investigations, and Quick Takes, and the number of thumbs-up and thumbs-down votes. The right panel lists the most active users, along with the number of conversations each user had.
-
. Charts all of the various user activities, such as Predictions, Advisories, Investigations, Question-Answer Turns, Agentic Turns, and more. The graph displays the value delivered by each activity type. You can click a metric in the table on the left to filter the chart.
-
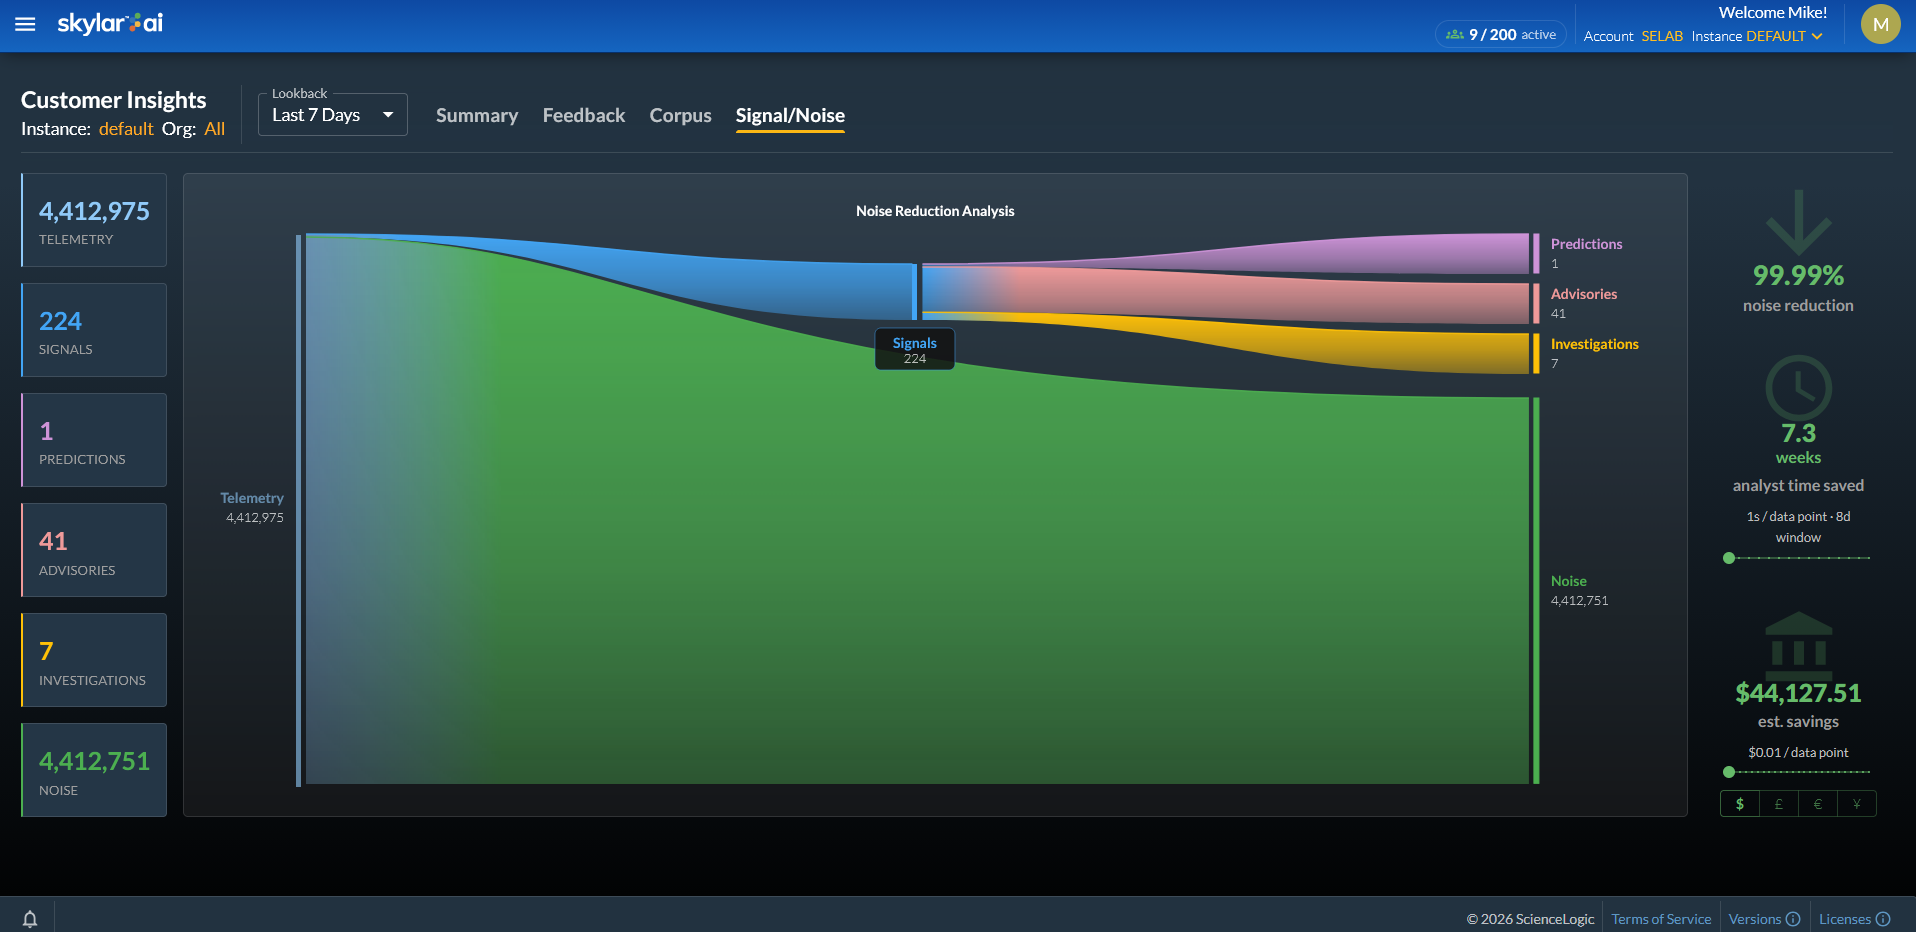
. Displays a variety of data about the "signal" (useful data) and the "noise" (unhelpful data) generated in this account by Skylar Advisor. Signals can become Advisories, Investigations, or Predictions.
The middle of the tab includes a visual Sankey chart that displays the useful signal versus the noise generated. You can also track the estimated savings as a result of the noise reduction in Skylar Advisor.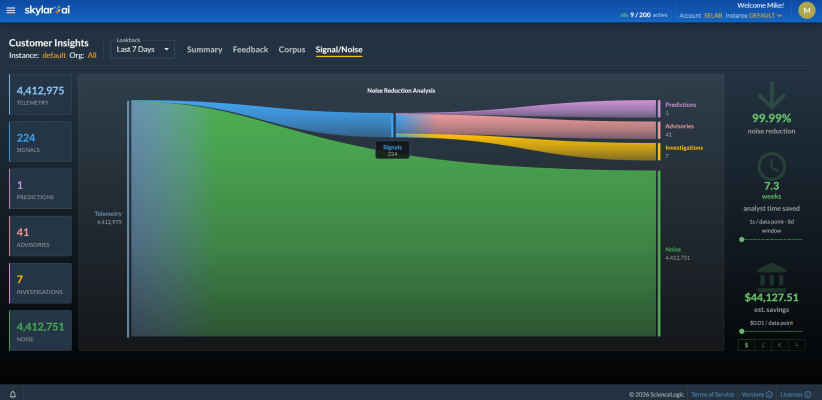
-
. Displays the specific feedback users added when they clicked the thumbs-up and thumbs-down votes.
-
. Displays the number of active, queued, and failed documents on the Corpus page in various time frames, with line graphs to show trends.