
The Data Lens page in Skylar Advisor lets you view details about the Skylar One events that have been received by Skylar Advisor. These inbound events are grouped together by relevance and listed on the tab.
When grouping events for the tab, Skylar Advisor performs semantic event correlation to group together related events based on how it understood the events. Skylar Advisor also considers related attributes like device groups.
The Data Lens Page
The Data Lens page lets you view details about groups of events that have been received by Skylar Advisor. Skylar Advisor performs semantic event correlation to group together related events based on how it understood the events.
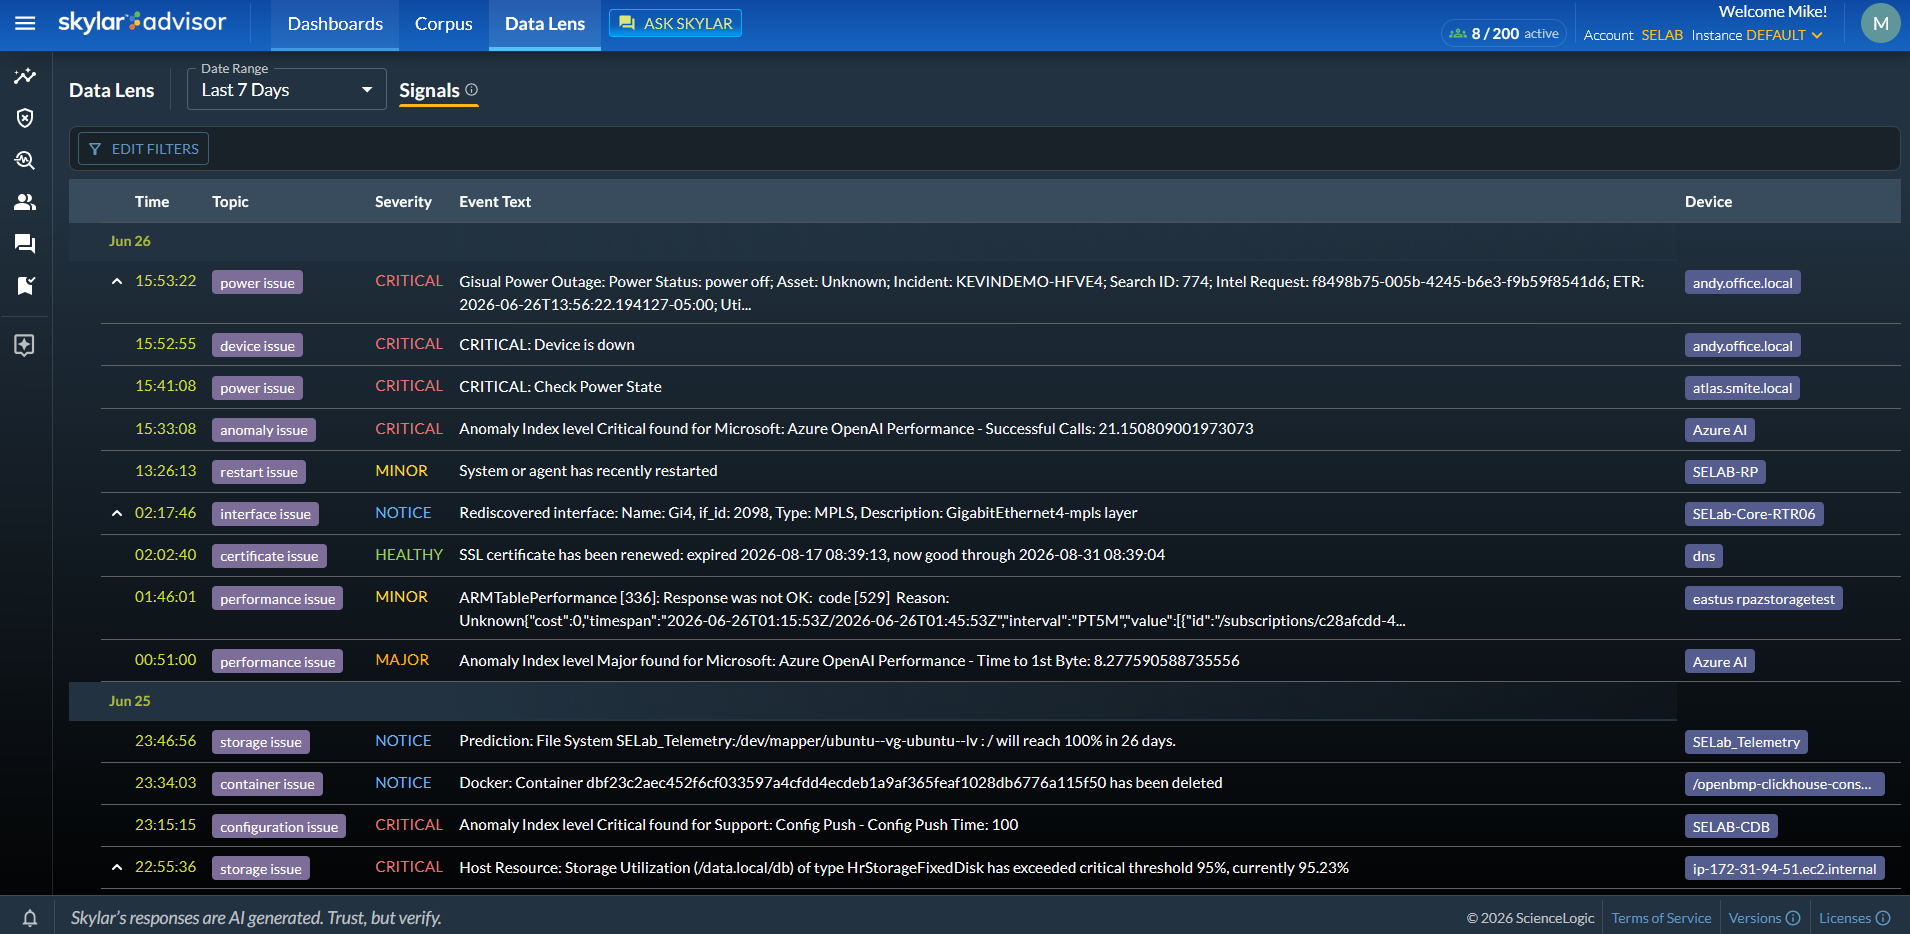
Not all events are listed on this page, but just related events organized and grouped by Skylar Advisor.
The Signals Tab
By default, the Data Lens page displays the tab, which contains a list of signals: a group of correlated events from your monitored environment that need you to review or triage. These signals can be rolled up into an Investigation.
You can also look at the tab on the Customer Insights page ( > Advisor > Customer Insights > Signal/Noise) to view the ratio of "signal to noise," or the amount of useful data versus the amount of unhelpful data generated in this account by Skylar Advisor. Signals can become Advisories, Investigations, or Predictions. The middle of the tab includes a visual Sankey chart that displays the different types of useful signals versus the noise generated. You can also track the estimated savings as a result of the noise reduction in Skylar Advisor.
Events are listed on the Data Lens page with the most recent events at the top. You can adjust the Date Filter drop down to change the time frame of the events. For more information, see Filtering the Data Lens Page .
In the list of events, the up arrow icon ( ) to the left of a event indicates the event is part of a group. Click the up arrow icon () to view the related events that make up the group.
Click an event on the Data Lens page to open a Summary pane on the right with more information. If you want to dig deeper into that event, click the button on the pane to generate a new Investigation activity. You will then be able to interact with and share the Investigation.
The Events Tab
If you enable the Data Lens Events option from the Preview Features page ( > Account Settings > Preview Features), the Data Lens page will include an [Events] tab that displays a table of all events.
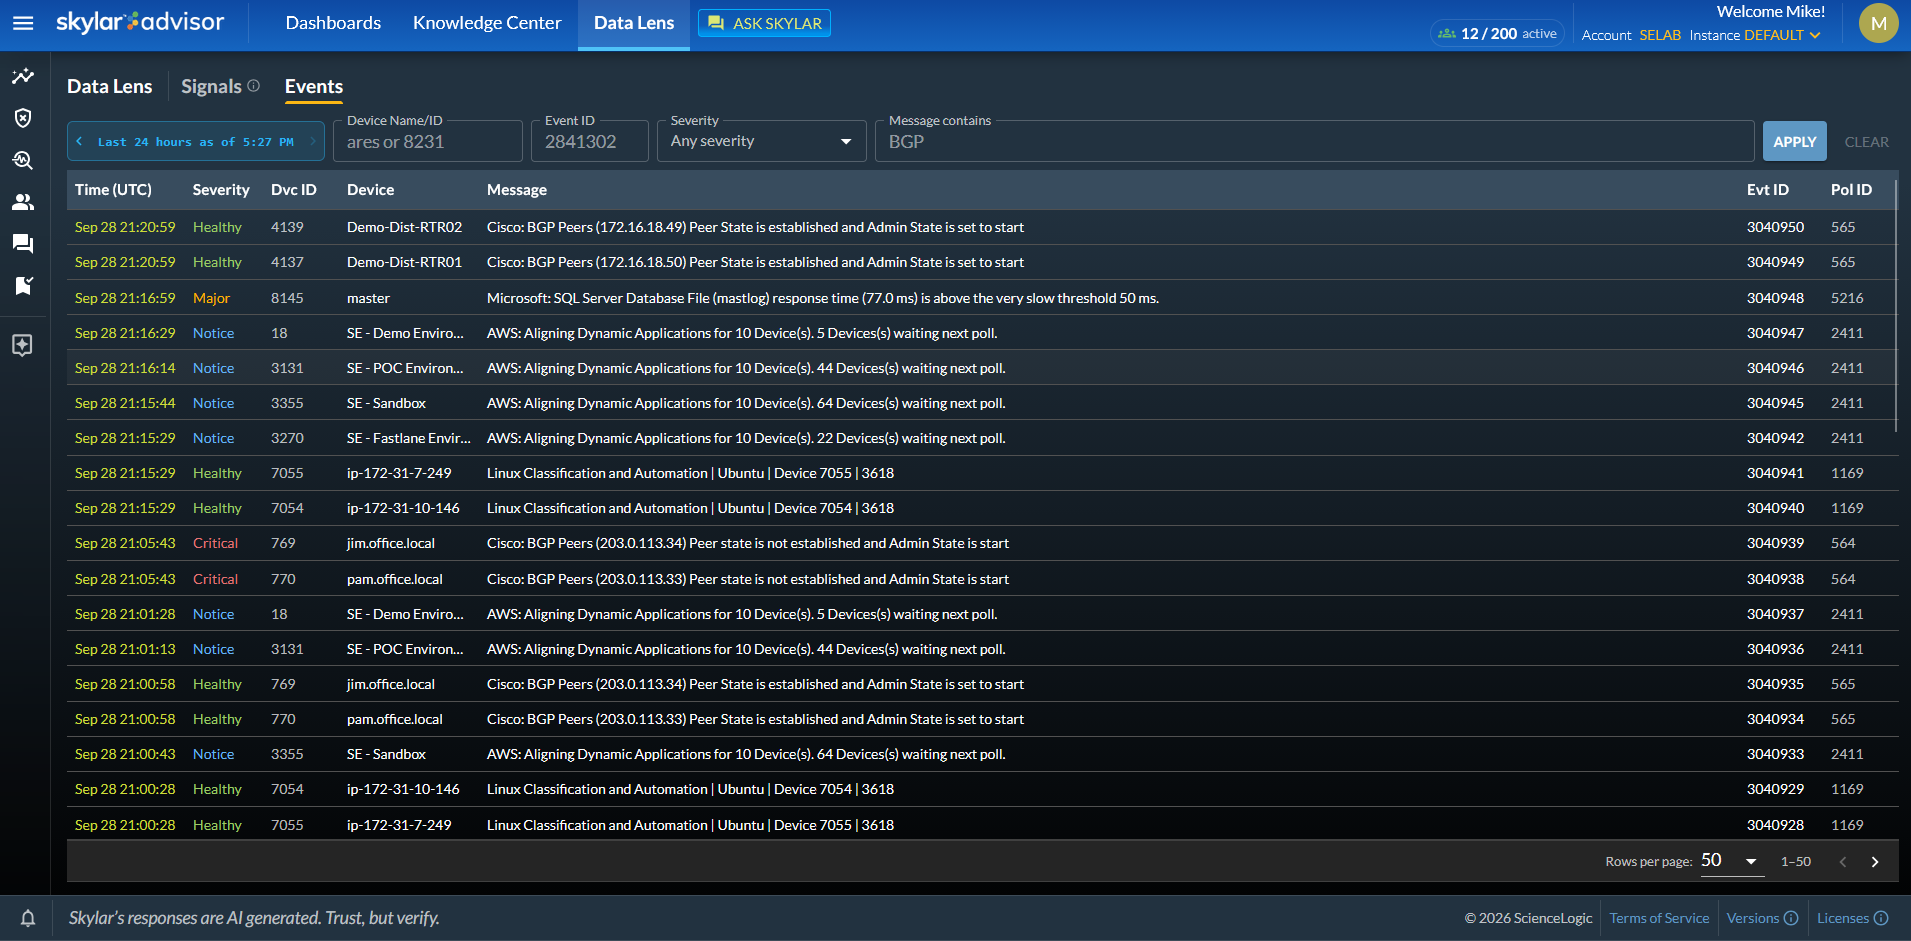
Click an event to view more information about that event.
You can use the filter boxes at the top of the table to sort the list of events. For more information, see Filtering the Data Lens Page.
Filtering the Data Lens Page
On the Data Lens page, events are shown with the most recent event at the top. You can use the filter boxes at the top of the table to view more or less information on this page.

To filter this page, click in one or more of the filter boxes at the top:
- Change the time frame by clicking the date range at the top left.
- Under Severity, select one or more severities to show on the Data Lens page.
- Narrow down the selections by typing in the "Any" text boxes at the top of each column.
- Enable cross filtering with the Cross Filter toggle at the top right. When enabled (blue), filter options are constrained based on your current selections.
- Click to save your filters.
After you save your filter setup, the filters that are currently in use display at the top of the page.