
Services are long-running applications. These applications typically do not have a user interface or produce any visual output. Any messages associated with the service are typically written to logs. Services can be configured to start automatically when the computer is booted. Services do not require a logged in user in order to execute.
During discovery, Skylar One retrieves information about services from discovered devices. When Skylar One assigns a device class to a discovered device, Skylar One examines the definition of that device class to determine how to retrieve information about services.
Service Monitoring Policies
Skylar One allows you to create policies that monitor services. A service policy tells Skylar One to monitor the device and look for the service. You can define a service policy so that:
- Skylar One generates an event if the service is not running or if the service is running.
- Skylar One starts, pauses, or restarts the service.
- Skylar One reboots or shuts down the device.
- Skylar One triggers the execution of a script (script must reside on the device).
Viewing the List of Service Monitoring Policies
You can view the list of service monitoring policies from the Service Monitoring page (Registry > Monitors > Windows Services).
The Service Monitoring page displays the following information about each service monitoring policy:
- Service Name. Name of the service that is monitored by the policy.
- Service Action. Displays Enabled if Skylar One generates an event when a required service is not found or when an illicit service is found. Otherwise, displays Disabled.
- Policy ID. Unique, numeric ID, assigned to the policy automatically by .
- State. Whether the policy is enabled or disabled.
- Device Name. Name of the device associated with the policy.
- IP Address. IP address of the device associated with the policy. This is the IP address Skylar One uses to communicate with the device.
- Device Category. Device category of the device associated with the policy.
- Organization. Organization for the device associated with the policy.
You can sort the list by a column's values by clicking on its column heading. You can also filter the items on the page by typing or selecting filter options in one or more of the filters found above the columns. For more information, see the topic on Filtering Inventory Pages.
From the list of policies, you can select the checkbox for one or more policies and choose one of the following bulk actions from the Select Action drop-down at the bottom right of the page:
- Delete Monitors. Deletes the selected policies from Skylar One. The associated reports (from the Device Reports > Performance tab) are also deleted.
- Enable Monitors. Enables the selected policies so that Skylar One can collect the data for these policies.
- Disable Monitors. Disables the selected policies. Skylar One will not collect the data specified in these policies.
Prerequisites and Configuration for Service Monitoring Policies
Before you can define a service monitoring policy that performs actions on the external device, you must perform some required configuration in Skylar One and on the external server.
Optional Settings in Skylar One
If you do not define a service monitoring policy, Skylar One will still detect the services that are running on your devices. You can configure Skylar One to automatically monitor all services of type "automatic" and restart those services if they fail, without creating a service monitoring policy.
On the Behavior Settings page, you can define the following options in the Restart Windows Services (Agent required) field to specify whether Skylar One will automatically restart failed services:
- 0. Disabled. Skylar One will not automatically restart failed services that have been defined on the device with a startup type of "automatic".
- 1. Enabled. Skylar One will automatically restart failed services that have been defined on the device with a startup type of "automatic".
NOTE: The following services have a startup type of "automatic", but run only when explicitly called. Therefore, these services will not be restarted automatically if they are not found running: ATI HotKey Poller, Distributed Transaction Coordinator, Performance Logs and Alerts, Removable Storage, TPM Base Services, Windows Service Pack Installer update service, and VSS. If you would like to include additional services in this exclusion list, contact ScienceLogic Support.
Defining a Monitoring Policy for Services
You can define a service monitoring policy for a device on the tab of the Device Investigator.
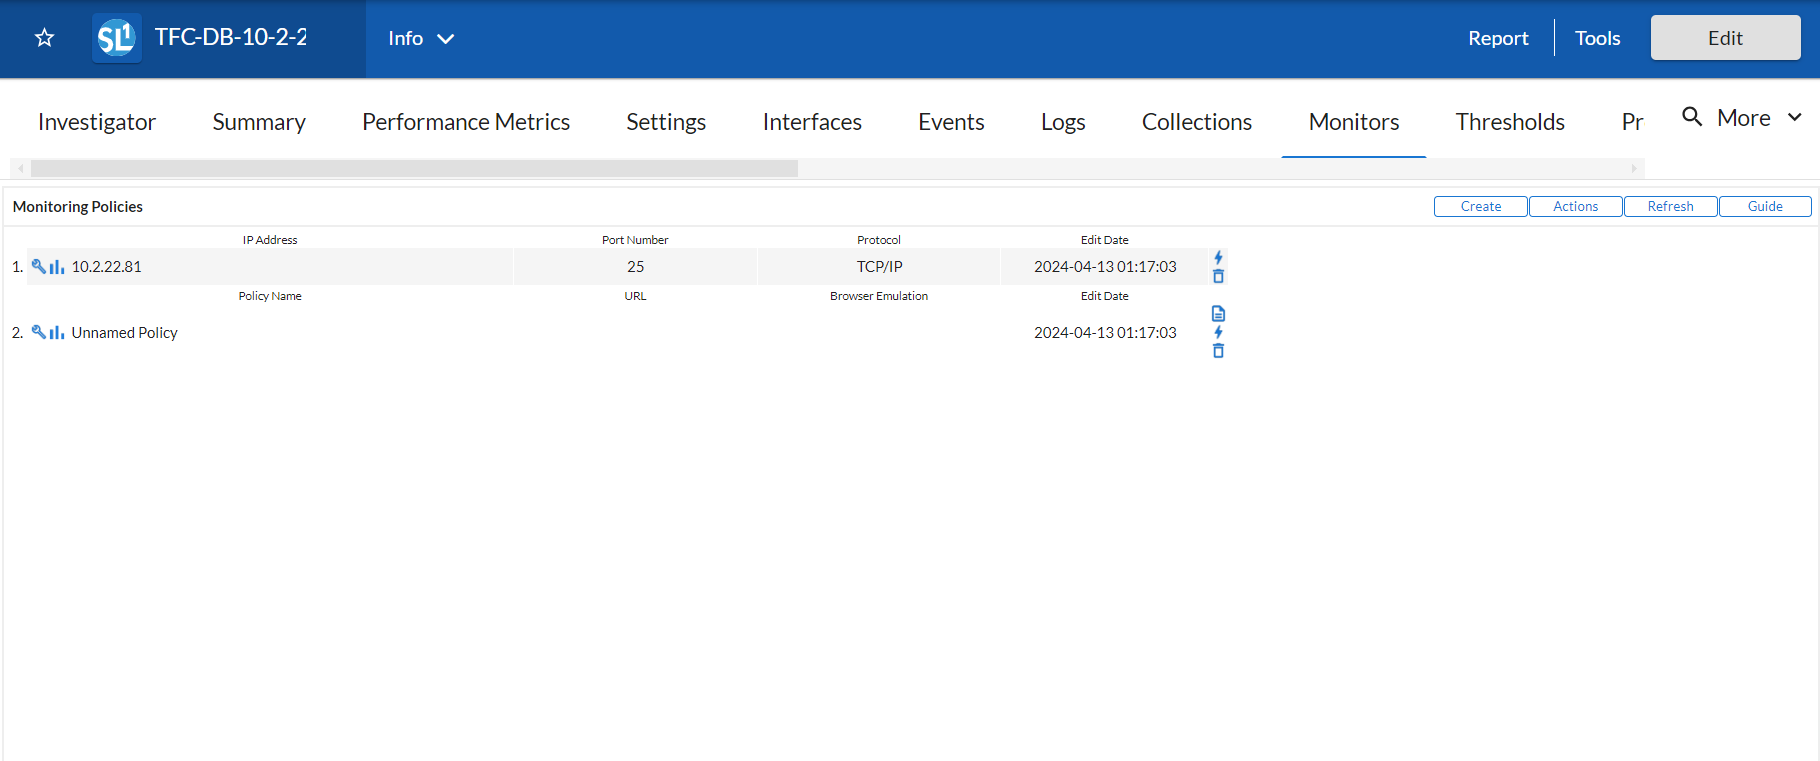
To define a service monitoring policy:
- Go to the Devices page and click the Device Name of the device for which you want to define a service monitoring policy. The Device Investigator displays.
- Click the tab.
- Click , and then select Create Service Policy. The Service Policy modal appears.
- In the Service Policy modal, supply a value in each of the following fields:
- Select Device. Select a device to align with this policy. If you accessed this page through the Device Administration panel, the current device is selected in this field by default. This field displays only devices that belong to a device class where the Service Collection field contains either Windows Basic or WMI Informant.
- Service Name. Service to be monitored by the policy. Select from a list of all services discovered in the network by Skylar One.
- Alert if Found. You can use this field in one of two ways: Generate an event when a required service is not found or generate an event when an illicit service is found. Your choices are:
- Enabled. Use this setting to look for an illicit service.
- If Skylar One finds the illicit service (specified in the Service Name field), Skylar One will generate an event.
- If Skylar One does not find the illicit service, Skylar One will not generate an event.
- Disabled. Use this setting to ensure that a required service is running.
- If Skylar One finds the required service, (specified in the Service Name field, Skylar One does not generate an event.
- If Skylar One does not find the required service, Skylar One generates an event.
- State. Specifies whether Skylar One should start collecting data specified in this policy from the device. Choices are:
- Enabled. Skylar One will collect the data specified in this policy at the frequency specified in the Process Manager page (System > Settings > Admin Processes) for the Data Collection: OS Service Check process.
- Disabled. Skylar One will not collect the data specified in this policy until the State field is set to Enabled.
- Click .
Defining a Monitoring Policy for Services in the Classic Skylar One User Interface
There are two places in Skylar One from which you can define a monitoring policy for services:
- From the Device Manager page (Devices > Classic Devices, or Registry > Devices > Device Manager in the classic user interface):
- In the Device Manager page, find the device that you want to associate with the monitoring policy. Click the wrench icon (
 ) for the device.
- In the Device Administration panel, click the tab.
- From the menu in the upper right, select Create Services Policy.
Or:
- From the Service Monitoring page (Registry > Monitors > Windows Services):
- In the Service Monitoring page, click the button.
- The Service Policy modal appears.
For information about completing the fields in the Service Policy modal, see the section on Defining a Monitoring Policy for Services.
Editing a Service Monitoring Policy
To edit a service monitoring policy:
- Go to the Devices page and click the name of the device for which you want to edit a monitoring policy. The Device Investigator displays.
- Click the tab.
- Find the policy you want to edit and click its wrench icon (). The Service Policy modal appears.
- In the Service Policy modal, you can change the values in one or more of the fields described in the section on Defining a Monitoring Policy for Services.
- Click .
Editing a Service Monitoring Policy in the Classic Skylar One User Interface
There are two places in Skylar One from which you can edit a monitoring policy for a service:
- From the Device Manager (Devices > Classic Devices, or Registry > Devices > Device Manager in the classic user interface) page:
- In the Device Manager page, find the device that you want to associate with the monitoring policy. Click the wrench icon () for the device.
- In the Device Administration panel, click the tab.
- In the Monitoring Policies page, find the policy you want to edit and click its wrench icon ().
Or:
- From the Service Monitoring page (Registry > Monitors > Windows Services):
- In the Service Monitoring page, find the policy you want to edit and click its wrench icon ().
- The Service Policy modal appears.
- In the Service Policy modal, you can change the values in one or more of the fields described in the section on Defining a Monitoring Policy for Services.
- Click .
Executing a Service Monitoring Policy
After creating or editing a service monitoring policy, you can manually execute the policy and view detailed logs of each step during the execution.
NOTE: After you define a service monitoring policy and enable the policy, Skylar One will automatically execute the policy every five minutes. However, you can use the steps in this section to execute the policy immediately and see debug information about the execution of the policy.
To execute a service monitoring policy:
- Go to the Devices page and click the name of the device for which you want to execute the monitoring policy. The Device Investigator displays.
- Click the tab.
- Find the policy you want to run manually and click its lightning bolt icon (
 ).
). - The Session Logs modal opens while the policy is executing. The Session Logs page provides detailed descriptions of each step during the execution. This is helpful for diagnosing possible problems with a policy.
Executing a Service Monitoring Policy in the Classic Skylar One User Interface
To execute a service monitoring policy in the classic Skylar One user interface:
- In the Service Monitoring page (Registry > Monitors > Windows Services), find the policy you want to run manually.
- Click the lightning bolt icon () to manually execute the policy.
- While the policy is executing, Skylar One spawns a modal called Session Logs. The Session Logs page provides detailed descriptions of each step during the execution. This is very helpful for diagnosing possible problems with a policy.
Deleting a Service Monitoring Policy
You can delete a service monitoring policy from the tab of the Device Investigator. When you delete a monitoring policy, Skylar One no longer uses the policy to collect data from the aligned device. Deleting a monitoring policy will also remove all data that was previously collected by the policy.
To delete a service monitoring policy:
- Go to the Devices page and click the name of the device for which you want to delete the monitoring policy. The Device Investigator displays.
- Click the tab.
- Find the policy you want to delete and click its delete icon (
 ). A confirmation prompt appears.
 - Click .
Deleting a Service Monitoring Policy in the Classic Skylar One User Interface
You can delete one or more service monitoring policies from the Service Monitoring page. When you delete a monitoring policy, Skylar One no longer uses the policy to collect data from the aligned device. Deleting a monitoring policy will also remove all data that was previously collected by the policy.
To delete a service process policy in the classic Skylar One user interface:
- Go to the Service Monitoring page (Registry > Monitors > Windows Services).
- In the Service Monitoring page, select the checkbox(es) for each system service policy you want to delete. Click the checkbox at the top of the page to select all of the service policies.
- In the menu in the bottom right of the page, select Delete Monitors.
- Click the button to delete the service policies.
- The policy is deleted from Skylar One. The associated reports (from the Device Reports > tab) are also deleted.
Viewing a List of All Services
The Services page displays a list of all services discovered by Skylar One. These services are running on devices that have been discovered by Skylar One. The Services page also allows you to define service monitoring for multiple services running on multiple devices and to generate reports on services.
To view the list of all services running on all devices:
- Go to the Services page (Devices > Services).
- The Services page displays the following about each process:
You can sort the list by a column's values by clicking on its column heading. You can also filter the items on the page by typing or selecting filter options in one or more of the filters found above the columns. For more information, see the topic on Filtering Inventory Pages.
- Device Name. Name of the device where the service resides. For devices running SNMP or with DNS entries, the named device is discovered automatically. For devices without SNMP or DNS entries, the device's IP address will appear in this field.
- Organization. Organization associated with the device.
- IP Address. IP address of the device where the service is located.
- Device Class | Sub-Class. The manufacturer (device class) and type of device (sub-class). The Device Class | Sub-Class is automatically assigned during auto-discovery, at the same time as the Category.
- Service. The name of the service. A single service name can have multiple entries.
- Monitored. Specifies whether or not Skylar One is monitoring the service. The choices are:
- Yes. Skylar One is currently monitoring this service.
- No. Skylar One is not currently monitoring this service.
- Tools. For each service, the following tools are available:
- Locate all services on device (
 ). Leads to the Services Found page, where you can view a list of all services that reside on the device.
 - Print exclusion report (
 ). Generates a detailed service report, in MS Word format. This report specifies all devices where the selected service is running and all devices where the selected service is not running. Skylar One lists only appropriate devices in this report. For example, Solaris servers would not appear in a report for a Microsoft service.
 - Edit monitoring of this service (). Leads to the Monitoring Policies page, where you can edit the properties of the monitoring policy.
- Checkbox (
 ). The checkbox applies the action from the Select Action drop-down list to the service. To select all the checkboxes, select the large red check icon.
Viewing a List of Services on a Single Device
On the tab of the Device Investigator, you can view a list of all services enabled on the device:
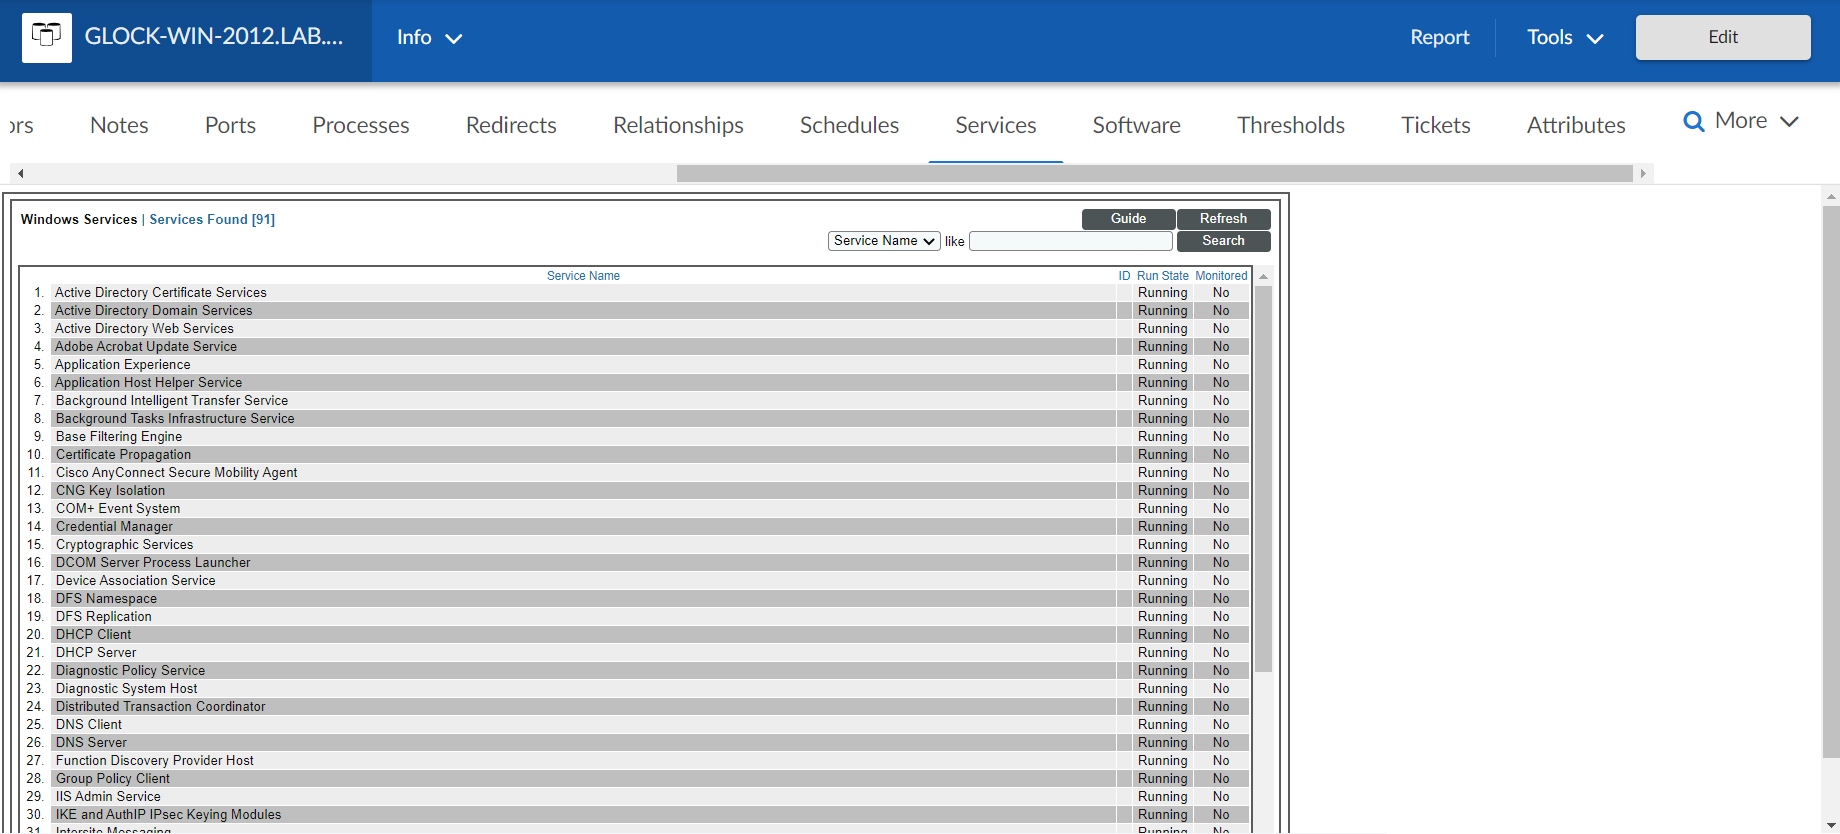
To keep your device running efficiently and to maintain security, the tab helps you manage services on your device. For each service running on the device, the tab displays the following information:
You can sort the list by a column's values by clicking on its column heading. You can also filter the items on the page by typing or selecting filter options in one or more of the filters found above the columns. For more information, see the topic on Filtering Inventory Pages.
- Service Name. Name of the service.
- ID. If you have defined a monitoring policy for the service, Skylar One generates a unique numeric ID for the service.
- Run State. The current state of the process. This can be one of the following:
- Runnable. Service is ready to run as needed.
- Running. Service is currently running.
- Not Running. Service is in a "waiting" state.
- Invalid. Service is part of an operation that failed. Service was not ended gracefully.
NOTE: Run states are defined by a device's operating system and/or installed agents. Run states may differ between devices.
- Monitored. Specifies whether or not Skylar One is monitoring this service.
Viewing a List of Services on a Single Device in the Classic Skylar One User Interface
The Services page displays a list of all of the services that are running on a single device.
To view the list of services on a single device:
- Go to the Device Manager page (Devices > Services).
- Find the device where you want to view the list of services. Select the bar graph icon (
 ) for that device.
 - In the Device Reports panel, select the Services tab. The Services page appears.
- For each service, the Services page displays the following information:
You can sort the list by a column's values by clicking on its column heading. You can also filter the items on the page by typing or selecting filter options in one or more of the filters found above the columns. For more information, see the topic on Filtering Inventory Pages.
- Service Name. Name of the service.
- ID. If you have defined a monitoring policy for the service, Skylar One generates a unique numeric ID for the service.
- Run State. The current state of the process. This can be one of the following:
- Runnable. Service is ready to run as needed.
- Running. Service is currently running.
- Not Running. Service is in a "waiting" state.
- Invalid. Service is part of an operation that failed. Service was not ended gracefully.
NOTE: Run states are defined by a device's operating system and/or installed agents. Run states may differ between devices.
- Monitored. Specifies whether or not Skylar One is monitoring this service.
Generating and Viewing Reports about Services
This section describes how to generate and view reports about services.
Generating a Report on Multiple Services
From the Services page (Devices > Services) you can generate a report on all, multiple, or a single service in Skylar One. The Services page allows you to generate a report that contains all the information displayed in the Services page.
To generate a report on all or multiple services in Skylar One:
-
Go to the Services page (Devices > Services).
-
On the Services page, click the button. The Export current view as a report modal appears.
If you want to include only certain services in the report, use the "search as you type" fields at the top of each column. You can filter the list by one or more column headings. You can then select the button, and only the services displayed in the Services page will appear in the report.
-
In the Export current view as a report modal, you must select the format in which Skylar One will generate the report. Your choices are:
- Comma-separated values (.csv)
- Web page (.html)
- OpenDocument Spreadsheet (.ods)
- Excel spreadsheet (.xlsx)
- Acrobat document (.pdf)
- Click the button. The report will contain all the information displayed in the Services page. You can immediately view the report or save it to a file for later viewing.
Generating an Exclusion Report for a Single Service
From the Services page, you can generate an exclusion report for a service. Skylar One will generate the report in MS Word format. An exclusion report specifies all devices where the selected service is running and all devices where the selected service is not running.
A Service Exclusion Report displays the following:
- Name of the service.
- List of all devices in Skylar One where the service is running.
- List of all devices in Skylar One where the service is not running. Skylar One includes only appropriate servers in this report. For example, Solaris servers would not appear in a report for services.
- The last row in the report displays:
- Total number of devices in report.
- Total number of device categories included in the report.
- Total number of device classes included in the report.
- Total number of devices where service is running.
- Total number of devices where service is not running.
To generate an exclusion report about a service:
- Go to the Services page (Devices > Services).
- In the Services page, find an instance of the service you want to generate an exclusion report for.
- Click its printer icon (). You will be prompted to save or view the generated report.
Viewing Reports about Services
See the section on Viewing Performance Graphs for information and examples of reports for services.