Use the following menu options to navigate the SL1 user interface:
- To view a pop-out list of menu options, click the menu icon (
).
- To view a page containing all the menu options, click the Advanced menu icon (
).
This
ScienceLogic SL1 Self-Monitoring
SL1 includes a self-monitoring PowerPack that is included by default with SL1 releases. This PowerPack is called the ScienceLogic Support Pack PowerPack.
Version 103 of the ScienceLogic Support Pack PowerPack replaced the "Support: MySQL Performance" Dynamic Application with the "Support: MariaDB Performance" Dynamic Application.
This self-monitoring PowerPack:
- ensures that all SL1 appliances are monitored and running the same version of SL1
- ensures that all SL1 appliances appear in the Device Manager page (Registry > Devices > Device Manager)
- ensures that configuration files on SL1 appliances are kept in sync
- ensures that configuration files on SL1 clusters are kept in sync
- monitors the health and configuration of MariaDB
- generates alerts when system resources like disk-space are approaching capacity
- monitors DNS entries for Database Servers and All-In-One appliances
- monitors long-running processes and queries
- monitors out-of-memory conditions
- ensures that CRM and corosync configurations are up to date
- ensures that configuration files match among HA Database Servers
- monitors crucial SL1 processes like datapull and config_push
- monitors "rows behind" situations and generates alerts
- monitors and fixes backlogs of email messages
- generates alerts if any of the following files differ:
- /etc/my.cnf.d/silo_mysql.cnf
- /etc/silo.conf
- /etc/siteconfig/mysql.siteconfig
- /etc/siteconfig/siloconf.siteconfig
Viewing Information About ScienceLogic Processes
The Process Manager page allows you to view a list of ScienceLogic processes and optionally define parameters for those processes. These processes gather, manipulate, and publish the data used in SL1.
CAUTION: ScienceLogic recommends that you do not edit the values in this page without first consulting ScienceLogic. Incorrect values can severely disrupt ScienceLogic platform operations.
ScienceLogic processes fall into three scheduling categories or Frequencies:
- Asynchronous. The process is launched in response to a system event or user request.
- Scheduled. The process is launched on a regular schedule.
- Always. The process always runs while SL1 is running.
SL1 performs many tasks in parallel:
- Through a modular design, allowing functions to be distributed to multiple processing platforms.
- Through multi-processing, where multiple instances of a process run simultaneously.
The Process Manager page allows you to view and edit the parameters of system processes.
Viewing the List of ScienceLogic Processes
To view the list of process in the Process Manager page:
- Go to the Process Manager page (System > Settings > Admin Processes).
- The Process Manager page displays information about each ScienceLogic process. The Process Manager page displays the following for each process:
- Process Name. Name of the process.
- Program File. Name of the executable file associated with the process.
- Frequency. Frequency with which the platform launches the process. Possible values are:
- Asynchronous. The process is launched in response to a system event or user request.
- Always. The process always runs while SL1 is running.
- Scheduled. The process runs at intervals ranging from 1 Minute to Daily.
- Runtime Offset. This field applies only to scheduled processes and allows the platform to stagger the launch of a process. The field specifies the number of minutes after the default scheduled time to execute a process. The default scheduled time at which processes are initially executed is midnight UTC. So if a process has a Frequency of 5 Minutes and the Runtime Offset is set to "2", the process will execute at two minutes past UTC midnight, seven minutes past UTC midnight, 12 minutes past UTC midnight, 17 minutes past UTC midnight, etc. Choices range from 0–1439.
- Async Throttle. This field applies only to asynchronous processes. This field indicates the number of jobs per process that can run simultaneously.
- Batch Factor. This field applies only to scheduled processes and determines how many multithreaded child processes are spawned on each execution of the process.
number of tasks a process is responsible for completing/Batch Factor = number of child processes that will be spawned
- The number of tasks is typically determined by the number of devices the process is collecting data from.
- The maximum number of child processes is limited by the number of CPUs installed in the SL1 appliance that runs the process.
NOTE: Batch Factor defines the maximum number of worker processes or child processes. This value has precedence over the value specified
- Time Factor. Determines how long the process can run before being stopped by the process manager. This setting only applies to asynchronous processes and scheduled processes. For asynchronous processes, this is the length of time an instance of the process can run. For scheduled processes, the value of Time Factor is used to calculate Run Length.
(Frequency * Time Factor) + Frequency = Run Length
For example, suppose a process runs every 15 minutes (as specified in the Frequency field). A Time Factor of 2 means the process is allowed to run for 45 minutes. A Time Factor of 0 means the process is allowed to run for 15 minutes.
- Run Length. Specifies how long the process can run before being stopped by the process manager. This number is based on the Time Factor for the process.
- State. Current operational state of the process. Possible values are:
- Enabled. Process can run.
- Disabled. Process cannot run.
- Debug. Specifies whether debugging information is enabled for the process. For more details on debugging a process, see the section Debugging a Process.
- ID. Unique numeric ID assigned to each process by SL1.
- Edited By. Date and time the process settings were last edited.
- Edit Date. Date and time the process settings were last edited.
Searching and Filtering the List of ScienceLogic Processes
The Process Manager page includes 13 filters, in the top row in the list of processes. You can specify one or more parameters to filter the display of processes. Only processes that meet all the filter criteria will be displayed in the Process Manager page.
You can filter by one or more of the following parameters. The list of processes is dynamically updated as you select each filter.
- For each filter except Edit Date, you must enter text to match against. SL1 will search for processes that match the text, including partial matches. Text matches are not case-sensitive. You can use the following special characters in each filter:
- , (comma). Specifies an "or" operation. For example:
"dell, micro" would match all values that contain the string "dell" OR the string "micro".
- & (ampersand). Specifies an "and" operation. For example:
- ! (exclamation mark). Specifies a "not" operation. For example:
"dell & micro" would match all values that contain the string "dell" AND the string "micro".
"!dell" would match all values that do not contain the string "dell".
- Process Name You can enter text to match, including special characters (comma, ampersand, and exclamation mark), and the Process Manager page will display only processes that have a matching name.
- Program File. You can enter text to match, including special characters (comma, ampersand, and exclamation mark), and the Process Manager page will display only processes that have a matching program file.
- Frequency . You can enter text to match, including special characters (comma, ampersand, and exclamation mark), and the Process Manager page will display only processes that have a matching frequency number.
- Runtime Offset. You can enter text to match, including special characters (comma, ampersand, and exclamation mark), and the Process Manager page will display only processes that have a matching runtime offset.
- Async Throttle. You can enter text to match, including special characters (comma, ampersand, and exclamation mark), and the Process Manager page will display only processes that have a matching throttle number.
- Batch Factor. You can enter text to match, including special characters (comma, ampersand, and exclamation mark), and the Process Manager page will display only processes that have a matching batch factor.
- Time Factor. You can enter text to match, including special characters (comma, ampersand, and exclamation mark), and the Process Manager page will display only processes that have a matching time factor.
- Run Length. You can enter text to match, including special characters (comma, ampersand, and exclamation mark), and the Process Manager page will display only processes that have a matching run length.
- State. You can enter text to match, including special characters (comma, ampersand, and exclamation mark), and the Process Manager page will display only processes that have a matching state ("Enabled" or "Disabled").
- Debug. You can enter text to match, including special characters (comma, ampersand, and exclamation mark), and the Process Manager page will display only processes that have a matching debug state ("Enabled" or "Disabled").
- ID. You can enter text to match, including special characters (comma, ampersand, and exclamation mark), and the Process Manager page will display only processes that have a matching ScienceLogic process ID.
- Edited By. You can enter text to match, including special characters (comma, ampersand, and exclamation mark), and the Process Manager page will display only processes that have a matching "created by" or "edited by" value.
- Edit Date. You can select from a list of time periods. The Process Manager page will display only processes that have been created or edited within that time period:
- All. Display all processes that match the other filters.
- Last Minute. Display only processes that have been edited within the last minute.
- Last Hour. Display only processes that have been edited within the last hour.
- Last Day. Display only processes that have been edited within the last day.
- Last Week. Display only processes that have been edited within the last week.
- Last Month. Display only processes that have been edited within the last month.
- Last Year. Display only processes that have been edited within the last year.
Editing the Parameters of a ScienceLogic Process
To view details about a specific process or edit the settings for a specific process:
ScienceLogic recommends that you do not edit the values in this page without first consulting ScienceLogic. Incorrect values can severely disrupt ScienceLogic platform operations.
- Go to the Process Manager page (System > Settings > Admin Processes).
- In the Process Manager page, find the process you want to edit. Click its wrench icon (
 ).
).
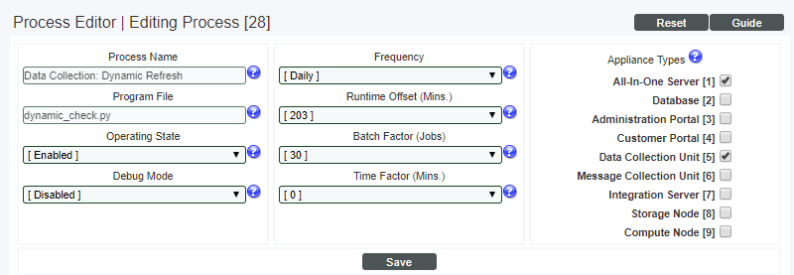
- The Process Editor page appears and is populated with values from the selected process.
- Process Name. Name of the process. This field is read-only and cannot be changed.
- Program File. Name of the executable file associated with the process. This field is read-only and cannot be changed.
- Operating State. Current operational state of the process. Specifies whether the process is enabled and able to run. Select from the drop-down list. The choices are:
- Enabled. Process can run.
- Disabled. Process cannot run.
- Debug Mode. Enables or disables debugging information for a process. For more details on debugging a process, see the section Debugging a Process.
NOTE: You cannot enable debug mode for the process Message Collection: SNMP Trap.
- Frequency. This field appears only for scheduled processes and asynchronous processes. Specifies the frequency with which SL1 launches the process. Select from the drop-down list. The choices are:
- Asynchronous. For asynchronous processes, this is the only available option. You cannot edit the frequency.
- Scheduled. For scheduled processes, you can edit the frequency. You can select from intervals ranging from 1 Minute to Daily.
NOTE: If a process is set to a frequency of Asynchronous or Always, this field cannot be changed. If a process is set to a time interval, this field cannot be changed to Asynchronous or Always.
- Async Throttle. This field appears only for asynchronous processes. This field indicates the number of jobs per process that can run simultaneously. This setting only applies to asynchronous processes.
- Runtime Offset. This field only appears for scheduled processes. This field allows SL1 to stagger the launch of a process. The value specified in this field specifies minutes after the default scheduled time for a process. For example, if a process has a Frequency of 5 Minutes and the Minute Offset is set to "2", the process will execute at two minutes past the hour, seven minutes past the hour, 12 minutes past the hour, 17 minutes past the hour, etc. Choices range from 0–1439.
- Batch Factor. This field applies only to scheduled processes and determines how many multithreaded child processes are spawned on each execution of the process.
number of tasks a process is responsible for completing/Batch Factor = number of child processes that will be spawned
- The number of tasks is typically determined by the number of devices the process is collecting data from.
- The maximum number of child processes is limited by the number of CPUs installed in the SL1 appliance that runs the process.
NOTE: Batch Factor defines the maximum number of worker processes or child processes. This value has precedence over the value specified
- Time Factor. This field appears only for scheduled processes and asynchronous processes. This field determines how long a process can run before being killed.
- For scheduled processes, SL1 uses the formula (Frequency * Time Factor) + Frequency.
For example, suppose a process runs every 15 minutes. A factor of 2 means the process is allowed to run for 45 minutes. Factor of 0 means process is allowed to run for 15 minutes.
- For asynchronous processes, SL1 simply uses the value in this field as the number of minutes a process can run. This field does not appear for processes that are always running.
- Appliance Types. Specifies the appliance types where the process is allowed to run.
NOTE: All changes to the settings in the Process Manager page are logged in the Audit Logs page (System > Monitor > Audit Logs). The associated log entry will specify the user who altered a process, the process that was altered, and which settings for the process were changed.
- If you make changes to one or more fields, click the button to save your changes.
Debugging a Process and Viewing Debug Logs
When you debug a process, you tell SL1 to use verbose logging for that process. You can then view SL1 log file to view the logs.
There might be circumstances where you have narrowed down a problem to a specific ScienceLogic process (for example, based on an error message or event). When this happens, you might find it helpful to turn on debugging for that process and view the debug logs.
ScienceLogic recommends that you enable the debug option only while troubleshooting a problem and that you then immediately turn off debugging when you have completed troubleshooting. Don't leave the debug option enabled during normal operation of SL1. When you turn on debugging, SL1 will run significantly more slowly.
NOTE: You cannot enable debug mode for the process Message Collection: SNMP Trap.
To enable the debug option for a process:
- In the Process Manager page, find the process you want to edit. Select its wrench icon (
 ).
).
- The Process Editor page appears and is populated with values for the selected process.
- Edit the following field:
- Debug. Enables or disables debugging information for a process. Select Enabled.
- Click the button in the Process Editor page.
- Log in to the console of the appliance where the process is running. Alternately, you can use SSH to open a shell session on the appliance. Log in as em7admin with the appropriate password. The default password is em7admin.
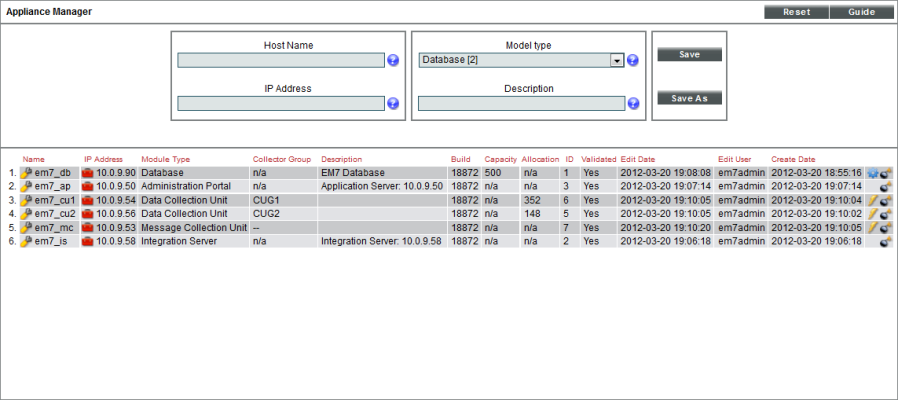
TIP: To view a list of IP addresses for all appliances in your system, go to the Appliance Manager page (System > Settings > Appliances).
- If the process you are debugging is a process that has a Frequency of Always, you must restart the process to make it pick up the new debug status (enabled). To restart the process, enter the following at the shell prompt:
sudo service process_name restart
For example, if you were debugging the process for the event engine, you would enter:
sudo service em7_event restart
- Navigate to the directory /var/log/em7. View the file silo.log. The most recent entries will be posted at the end of the file.
- After you have finished troubleshooting the process, remember to disable debugging. If the process has a Frequency of Always, you must restart the process to make it pick up the new debug status (disabled).
Viewing Information About Unhandled Exceptions
An exception specifies that something happened "out of the norm" that is preventing the software from executing the next step. Exceptions are a specific type of error, usually the result of invalid input, missing input, or a network error that prevents communication between software modules. For most exceptions, SL1 will handle the exception by logging a specific error in the System Logs and will continue to run the process. However, if the platform does not handle the exception, the process will stop running, and SL1 will generate an error message describing the unhandled exception.
Viewing the List of Unhandled Exceptions
To view the list of unhandled exceptions for all appliances:
- Go to the Unhandled Exceptions page (System > Monitor > Unhandled Exceptions).
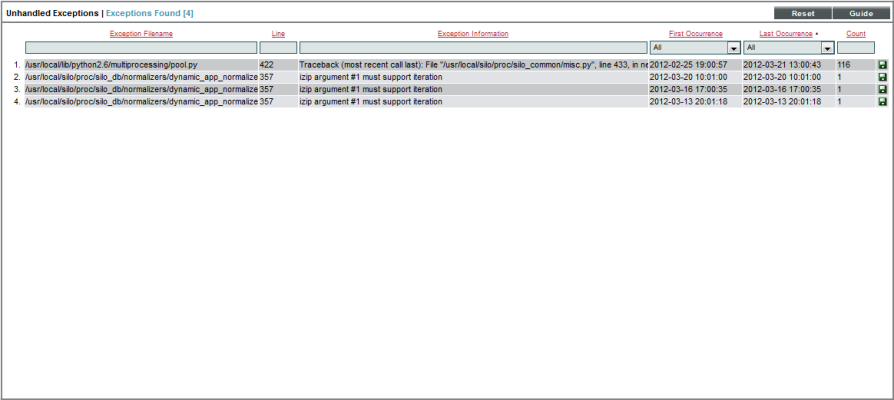
- The Unhandled Exceptions page displays the following for each unhandled exception:
- Exception Filename. Full path of the file where the exception occurred.
- Line. Line number of the line in the file where the exception occurred.
- Exception Information. Error message associated with the exception.
- First Occurrence. Date and time of the first occurrence of the exception.
- Last Occurrence. Date and time of the last occurrence of the exception.
- Count. Number of times the exception has occurred.
Searching and Filtering the List of Unhandled Exceptions
The Unhandled Exceptions page includes six filters. You can filter the list of exceptions by one or multiple of the following parameters: exception filename, line number, exception descriptions, first occurrence, last occurrence, and count. Only exceptions that meet all the filter criteria will be displayed in the Unhandled Exceptions page.
You can filter by one or more of the following parameters. The list of devices is dynamically updated as you select each filter.
- For the first three filters, you must enter text to match against. SL1 will search for exceptions that match the text, including partial matches. Text matches are not case sensitive. You can use the following special characters in each filter:
- , Specifies an "or" operation. For example:
"dell, micro" would match all values that contain the string "dell" OR the string "micro".
- ! Specifies a "not" operation. For example:
"!dell" would match all values that do not contain the string "dell".
- Exception Filename. You can enter text to match, including special characters, and the Unhandled Exceptions page will display only exceptions that have a matching filename.
- Line. You can enter text to match, including special characters, and the Unhandled Exceptions page will display only exceptions that have a matching line number.
- Exception Information. You can enter text to match, including special characters, and the Unhandled Exceptions page will display only exceptions that have a matching description.
- First Occurrence. Only those exceptions that match all the previously selected fields and have the specified first occurrence date will be displayed. The choices are:
- All. Display exceptions with all first occurrence dates.
- Last Minute. Display only exceptions that first occurred within the last minute.
- Last Hour. Display only exceptions that first occurred within the last hour.
- Last Day. Display only exceptions that first occurred within the last day.
- Last Week. Display only exceptions that first occurred within the last week.
- Last Month. Display only exceptions that first occurred within the last month.
- Last Year. Display only exceptions that first occurred within the last year.
- Last Occurrence. Only those exceptions that match all the previously selected fields and have the specified last occurrence date will be displayed. The choices are:
- All. Display exceptions with all last occurrence dates.
- Last Minute. Display only exceptions that last occurred within the last minute.
- Last Hour. Display only exceptions that last occurred within the last hour.
- Last Day. Display only exceptions that last occurred within the last day.
- Last Week. Display only exceptions that last occurred within the last week.
- Last Month. Display only exceptions that last occurred within the last month.
- Last Year. Display only exceptions that last occurred within the last year.
- Count. You can enter text to match, including special characters, and the Unhandled Exceptions page will display only exceptions that have a matching count number.
Saving the Unhandled Exception to the Local Computer
You can save the full text of the unhandled exception to a file on your local computer. You can then view the text in a text editor.
To save the full text of the unhandled exception to a file:
- Go to the Unhandled Exceptions page (System > Monitor > Unhandled Exceptions).
- In the Unhandled Exceptions page, find the exception you want to save to a file. Click its green diskette icon (
 ).
).
- When prompted, you can either immediately view the text file with a text editor or save the file to your local computer for viewing later.
Viewing the Output of the System Status Script
For each Database Server, Data Collector, and Message Collector, you can view the output of the system status script for that appliance. To do this:
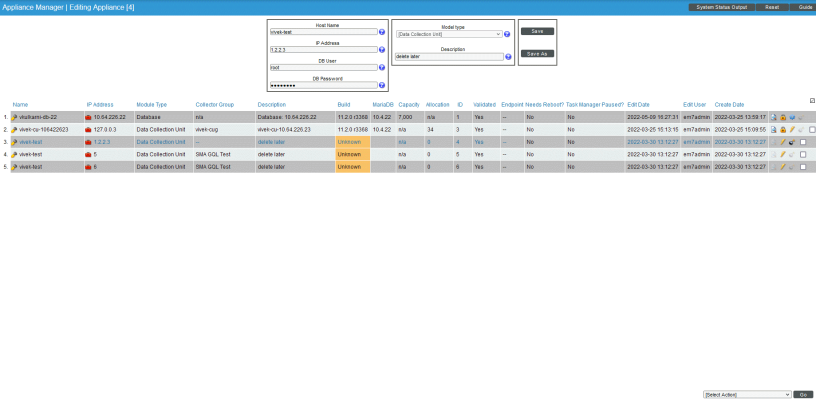
- Go to the Appliance Manager page (System > Settings > Appliances).
- Locate the Database Server, Data Collector, or Message Collector that you want to view diagnostic information about.
- Click on its magnifying-glass icon (
 ) to view the output of the system status script for that appliance.
The following video explains system status reports:
Viewing the Database Tables on the Database Server
In some circumstances, you might need to view the contents of the database tables (the permanent tables are stored on the Database Server). There are two ways to do this:
- Using the built-in Database Tools in the Database Tool page (System > Tools > DB Tool).
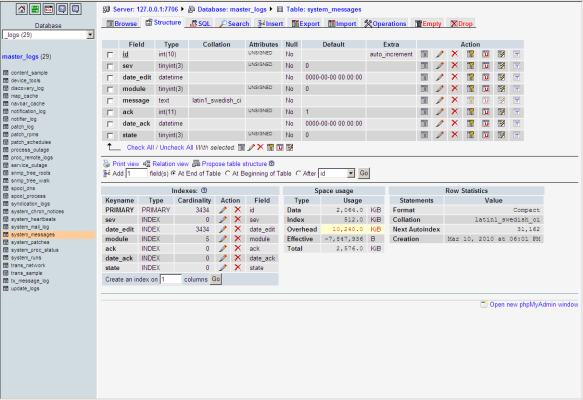
- Using the link to the phpMyAdmin interface in the Appliance Manager page (System > Settings > Appliances).
Accessing the Database Tool
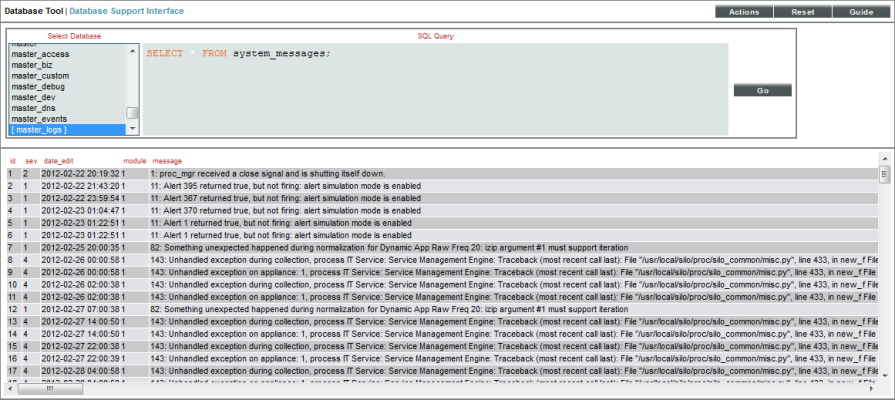
The Database Tool page allows administrators to view information about the internal ScienceLogic databases and run SQL queries against those internal databases.
CAUTION: Contact ScienceLogic for details on using the Database Tool page and troubleshooting databases. Do not make changes to the database or run the Optimizer Tool without guidance from ScienceLogic.
To access the database tool:
- Go to the Database Tool page (System > Tools > DB Tool).
- To run an SQL query from the Database Tool page, enter values in the following fields:
- Select Database. Select a database to query.
- SQL Query. Enter an SQL query to execute against the selected database. For more information on each database and each table, use the options in the menu.
NOTE: You must be familiar with SQL and know how to build a proper query before using the Database Tool page.
- Click the button to execute the query.
- The results from the query are displayed in the pane at the bottom of the page.
- To view the reports about the a database(s), click the menu. The following options are available:
- Engines. Displays status information about the server's storage engines. For each engine, the modal page displays a description of the engine, whether the engine is supported by SL1, and whether or not the engine supports transactions, XA, and save points.
- Global Status. Displays a list of global variables used in the database tables and the current value for each global variable.
- InnoDB Variables. Displays a list of InnoDB variables used in SL1 and the value for each variable.
- Open Tables. Displays a list of currently open tables. For each table, the modal page displays the database name, table name, whether the table is currently in use, and whether the table is currently locked.
- Optimizer Tool. Leads to the Database Optimizer Tool page, where you can choose to optimize, repair, check, flush, or analyze all the tables in a database.
Contact ScienceLogic for details on using the Database Optimizer Tool page. Do not run the Optimizer Tool without guidance from ScienceLogic.
- Processes. Displays a list of running threads on the databases and tables. For each process, the modal page displays the connection ID, the database user who issued the statement, the host name of the client that issued the statement, the affected database, the command, the time in seconds that the thread has been in its current state, the state of the thread, and any available description of the process.
- Table Status. Displays the status of each database table in the platform. For each table, the modal page displays the table name, the database engine, database version, row format, number of rows, average row-length, length of the data file, maximum length of the data file, length of the index file, number of allocated but unused bytes, the next auto-increment value, the create time for the table, the update time for the table, the table's character set and collation, the live checksum value, options used with CREATE TABLE, and any comments.
- Variables. Displays a list of all database system variables used in SL1 and the value of each variable.
Accessing the phpMyAdmin Interface for the Database Server
From within the user interface, you can access the phpMyAdmin interface. The phpMyAdmin interface provides a web interface for viewing and managing MySQL databases. Using the phpMyAdmin interface for a Database Server, you can also access the database tables for the Data Collectors and Message Collectors that have been added to the system using the phpMyAdmin interface for the main Database Server.
To access the phpMyAdmin interface for the database tables:
- Go to the Appliance Manager page (System > Settings > Appliances).
Disabling Normalization, Re-Enabling Normalization, and Backfilling Raw Data
ScienceLogic does not recommend stopping normalization on Data Collectors. However, there are rare occasions where ScienceLogic Customer Support might ask you to disable normalization as part of troubleshooting.
To disable normalization:
- Either go to the console of the Database Server or use SSH to access the Database Server.
- Log in as user em7admin with the appropriate password.
-
Type the following at the command line:
sudo visilo
-
In the LOCAL section, add the following line:
rollups_disabled=ON
- Save your changes and exit the file (:wq).
-
At the command line, type the following command to rebuild the configuration file:
sudo /opt/em7/share/scripts/generate-silo-conf.py > silo.conf
This is the file where users can customize the silo.conf file. In step #6, you will execute a command that sends these changes to the system silo.conf file.
-
Restart the data collection process to ensure they receive the change. Type the following at the command line:
sudo service em7_hfpulld restart
sudo service em7_lfpulld restart
sudo service em7_mfpulld restart
To re-enable normalization and normalize data that was collected while normalization was disabled:
- Either go to the console of the Database Server or use SSH to access the Database Server.
- Log in as user em7admin with the appropriate password.
-
Type the following at the command line:
sudo visilo
-
In the LOCAL section, add the following line:
rollups_disabled=OFF
- Save your changes and exit the file (:wq).
- At the command line, type the following command to rebuild the configuration file:
sudo /opt/em7/share/scripts/generate-silo-conf.py > silo.conf
-
Restart the data collection process to ensure collectors receive the change. Type the following at the command line:
sudo service em7_hfpulld restart
sudo service em7_lfpulld restart
sudo service em7_mfpulld restart
-
At the command line, type the following to normalize the data that was collected while normalization was disabled:
[/opt/em7/backend/data_normalizer_backfill.py --database, <database> --dids <[device IDs]> --start <start date> --end <end date> --workers <number of workers>
NOTE: To get help, at the shell prompt, type "/opt/em7/backend/data_normalizer_backfill.py -h".
where:
- --database database. Specifies the database that you want to backfill with normalized data. The choices are:
- data_avail. Table that stores normalized data for availability.
- data_cv. Table that stores normalized data for Web Content policies.
- data_dns. Table that stores normalized data for DNS policies.
- data_email. Table that stores normalized data for Email Round-Trip policies.
- data_ports. Table that stores normalized data for TCP-IP Ports policies.
- data_procs. Table that stores normalized data for System Processes policies.
- data_services. Table that stores normalized data for Windows Services policies.
- data_storage. Table that stores normalized data for file systems.
- data_tv. Table that stores normalized data for SOAP/XML Transaction policies.
- dynamic_app_data_appID. Table that stores normalized data for a Dynamic Application. Specify the application ID for the Dynamic Application.
- --dids device IDs. Specifies the device ID of the device or devices for which you want to normalize data.
- You can specify a single device ID.
- You can specify multiple device IDs, separated by commas and surrounded by square brackets.
- If you do not specify any device IDs, SL1 will normalize the specified data for all devices in your system.
- --start start date. The timestamp that specifies the data to normalize. Raw data with a time stamp at this time or later will be normalized. SL1 will normalize data starting with this timestamp and ending with the end-date timestamp.
- Specify the timestamp in the format yyyy-mm-dd hh:mm:ss, using a 24-hour clock. Surround the timestamp with single quotes.
- --end end date. The timestamp that specifies the data to normalize. Raw data with a time stamp at this time or earlier will be normalized. SL1 will normalize data starting with the start-date timestamp and ending with this timestamp.
- Specify the timestamp in the format yyyy-mm-dd hh:mm:ss, using a 24-hour clock. Surround the timestamp with single quotes.
- --workers workers. Number of worker processes to assign to this task. This field is optional. Please consult ScienceLogic Customer Support for suggestions on worker processes.
For example:
python /opt/em7/backend/data_normalizer_backfill.py --database dynamic_app_data_16 --start '2017-10-01 00:00:00' --end '2017-10-10 00:00:00' --workers 10
This command normalizes raw data collected by the Dynamic Application with an application ID of 16, associated with all subscriber devices (no device IDs specified, so defaults to "all devices"), and that was collected between midnight on October 1, 2017 and midnight on October 10, 2017. The data_normalizer_backfill.py code uses ten worker processes to perform the normalization.
Enable Logging for Data Pull Storage Objects
To investigate missed polls or slow database queries, you can temporarily enable logging for data pull storage objects. After you complete the diagnostics, you must disable logging for data pull storage objects, because the logging can affect the performance of data pull.
Enable
To enable logging for data pull storage objects:
- Either go to the console of the Database Server or use SSH to access the Database Server.
- Log in as an administrator.
-
At the shell prompt, enter the following:
sudo visilo
-
In the silo.conf file, add the following lines:
[DATAPULL]
log_storage_object_stats = 1
- Save your changes to the file (:wq).
-
You must restart the data collection processes to ensure they receive the change. To do this, enter the following at the shell prompt:
sudo service em7_hfpulld restart
sudo service em7_lfpulld restart
sudo service em7_mfpulld restart
Disable
When you have completed your diagnostics, disable logging for data pull storage objects. To do this:
- Either go to the console of the Database Server or use SSH to access the Database Server.
- Log in as an administrator.
-
At the shell prompt, enter the following:
sudo visilo
-
In the silo.conf file, edit the following:
[DATAPULL]
log_storage_object_stats = 0
- Save your changes to the file (:wq).
-
You must restart the data collection processes to ensure they receive the change. To do this, enter the following at the shell prompt:
sudo service em7_hfpulld restart
sudo service em7_lfpulld restart
sudo service em7_mfpulld restart
Controlling Log Settings
In rare cases, you may need to modify log levels or suppression of certain logs in SL1, usually at the request of ScienceLogic Customer Support. To do so, you will navigate to the PHP Developer Logs page (System > Tools > PHP Developer Logs). This section describes the options included on the PHP Developer Logs page.
This page is is only available for Administrator-level users in SL1.
Setting UI Developer Log Levels
When configuring logging on an appliance, you must specify a log level. The log level controls the types of messages that are written to the user interface log file (em7php.log). Each type of message has an associated number; the log level is the sum of all enabled messages. The numbers and associated message types are:
- 1. Critical
- 2. Error
- 4. Warning
- 8. Info
- 16. Debug
- 32. Trace
To determine the log level, sum the numbers associated with each type of message you want to enable. For example, if you want to enable Critical, Error, and Warning messages, you would sum one, two, and four to get a log level value of seven.
Setting UI/REST MySQL Query Log Levels
The UI/REST MySQL Query Log Levels settings let you specify the log level for the mysqli.log file. This log file collects every PHP-based call to MySQL and includes general information about the query. Determine the granularity of data you want and select one or more checkboxes.
- Error
- Warning
- Info (non-error)
In addition, if you select the Request URI option, the mysqli.log file will include the request URI.
Configuring Advanced Log Settings
In the Advanced Settings section, you can configure the suppressions and the date/time format you want to use:
-
Suppression List. This list acts as a bitmask to log entries. For example, to suppress all entries for css-em7, you would enter "css.em7::127", where 127 is the sum of all possible log levels. You can specify multiple suppressions in the list, separated by commas.
-
Datetime Format. Specifies a user-defined date format that will be used for5 system logs. You can use any date variables supported by the PHP date function in this field.
Seconds and milliseconds are always appended to the date/time stamp.
-
Include IP in log filenames. Select this option to add the IP address from which the user is logged in to the name of each log file.
Downloading Logs from the PHP Developer Logs page
To download the logs from the PHP Developer Logs page (System > Tools > PHP Developer Logs):
- Go to the PHP Developer Logs page (System > Tools > PHP Developer Logs
- Under Download Logs, select a logfile to download.
This page is is only available for Administrator-level users in SL1.
The following video explains a new method for accessing user interface logs:
| COUNT(*) | module | name | cug_name |
|---|---|---|---|
| 46 | 4 | emanbwl013 | PFZR_IRL_CG |
| 16 | 18 | emapuul021 | PFZR_PUUR_CG |
| 16 | 22 | emarinl014 | PFZR_IRL_CG |

