![]()
This ![]() ) in the PowerFlow user interface to monitor the health of your PowerFlow system and PowerFlow applications.
) in the PowerFlow user interface to monitor the health of your PowerFlow system and PowerFlow applications.
The following video provides an overview of the PowerFlow Control Tower page:
This
What is the PowerFlow Control Tower?
The PowerFlow Control Tower page (![]() ) in the PowerFlow user interface provides visibility into system health and automation health. This page is made up of a group of widgets that provide key information about your PowerFlow system:
) in the PowerFlow user interface provides visibility into system health and automation health. This page is made up of a group of widgets that provide key information about your PowerFlow system:
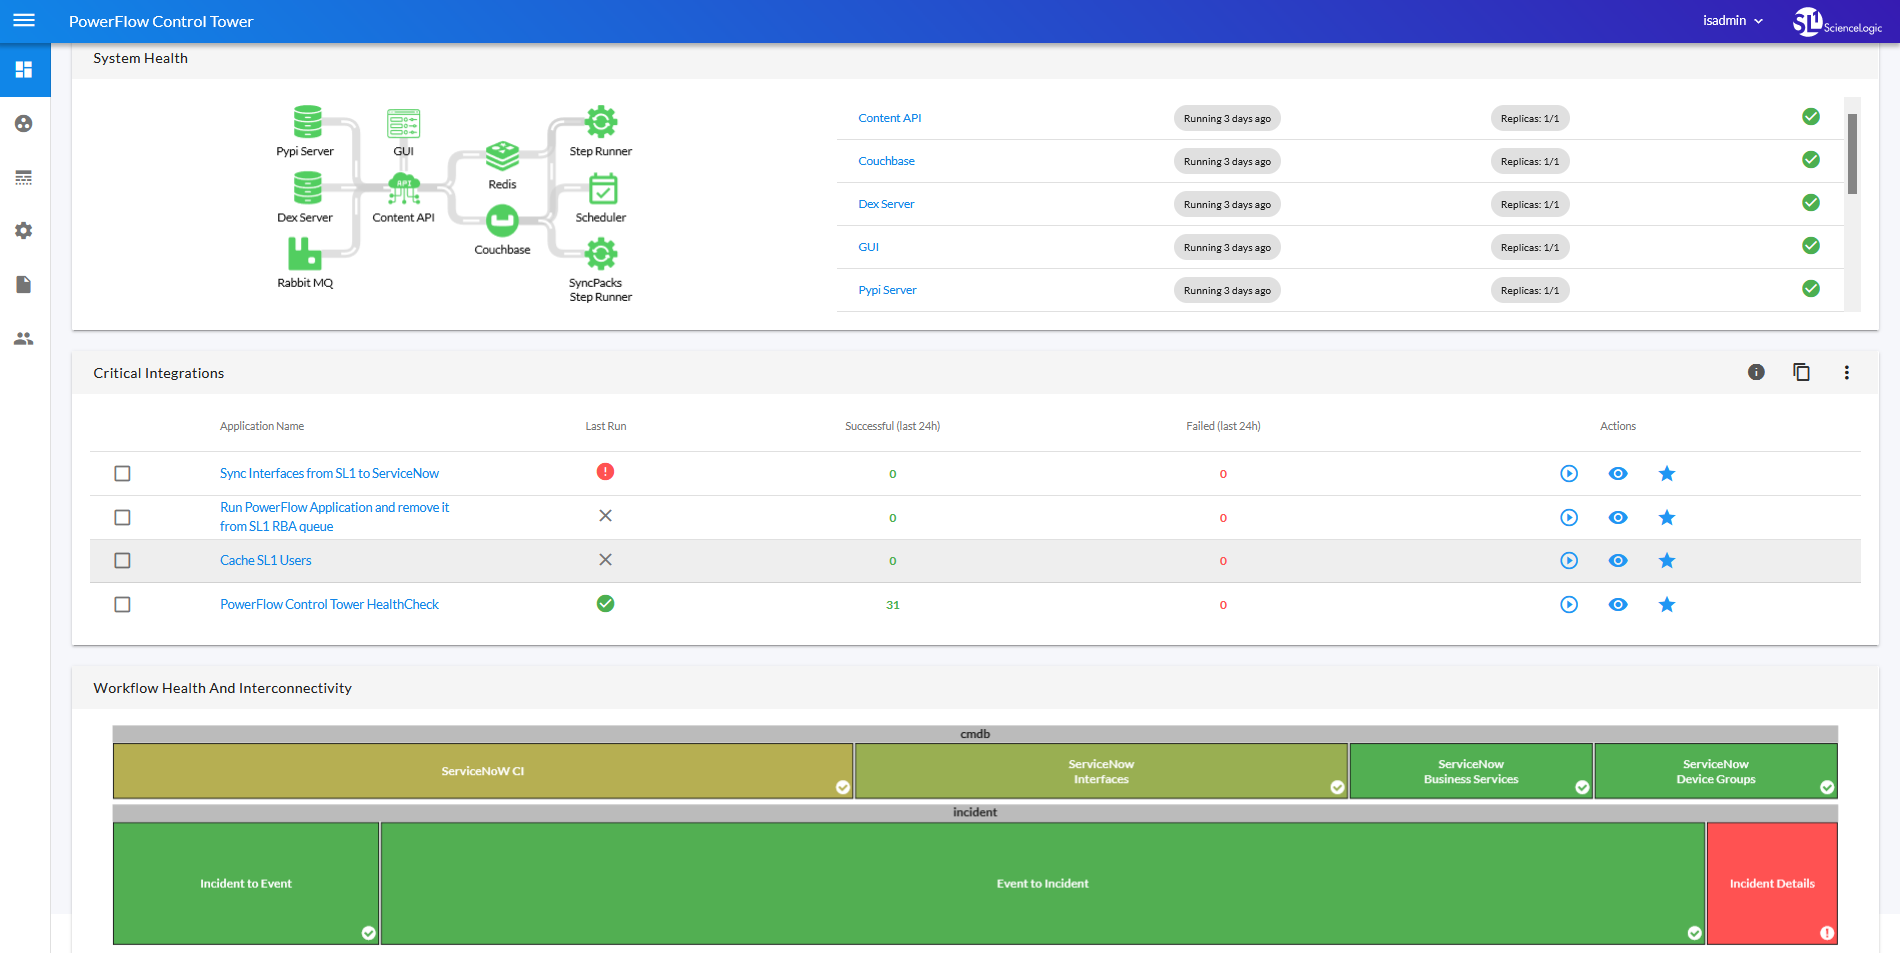
The PowerFlow Control Tower page contains the System Health, the Favorite Applications
You can use the widgets on this page to monitor the health of your PowerFlow system, the various workflows you use regularly, and track the PowerFlow applications that you use the most. You can use this information to quickly determine if your PowerFlow instance is performing as expected.
The Dashboard page that was in the PowerFlow user interface before version 2.3.0 was replaced by the PowerFlow Control Tower page. The new page includes new widgets along with the widgets from the previous Dashboard page.
The System Health Widget
The System Health widget on the PowerFlow Control Tower page lets you see at a glance the health of the various elements of your PowerFlow system. Before you can view Health Status data on the dashboard, you need to configure PowerFlow.
Configuring the System Health Widget
To populate the system health widget, you need to install and activate the latest version of the System Utils Synchronization PowerPack, which includes a PowerFlow application that gathers system health data and populates it in the cache. The latest version of the System Utils Synchronization PowerPack requires the latest version of the Base Steps and Flow Control Synchronization PowerPacks.
To set up PowerFlow Health Status data:
-
Ensure that your PowerFlow system has the following Synchronization PowerPacks activated and installed:
- Base Steps Synchronization PowerPack version 1.4.2 or later
-
System Utils Synchronization PowerPack version 1.1.3 or later
-
Flow Control Synchronization PowerPack version 1.0.1 or later
Due to a compatibility issue, do not use Base Steps Synchronization PowerPack version 1.4.1 with System Utils Synchronization PowerPack version 1.1.2.
If you are using SSH keys to connect to the PowerFlow Control Tower, you will need Base Steps Synchronization PowerPack version 1.4.1 or later.
-
Create a configuration object for the "PowerFlow Control Tower HealthCheck" application. You can make a copy of the "PF Control Tower Configuration Example" to use as a template for this configuration object. For more information, see Creating a Configuration Object.
-
Align the new configuration object with the "PowerFlow Control Tower HealthCheck" application by clicking the button from the detail page for the application and selecting this configuration object from the Configuration drop-down.
The "PowerFlow Control Tower Healthcheck" Application supports using SSH keys for collecting data from a PowerFlow node. You must select the use_ssh_key option on the Configuration pane for the HealthCheck application to use the ssh_key application variable that is defined in the aligned configuration object
-
Run or schedule the "PowerFlow Control Tower HealthCheck" application to update the PowerFlow Health Status data.
The System Health widget runs the "PowerFlow Control Tower HealthCheck" application automatically when you are on the PowerFlow Control Tower page, but only if the data saved on the most recent run of the application is older than five minutes. You can override this update by creating a schedule. For more information, see Scheduling Applications.
Using the System Health Widget
The System Health widget monitors all of the components that make up your PowerFlow system. These components include the Pypi Server, the Dex Server, RabbitMQ, the GUI service, the Content API, Redis, Couchbase, Step Runner and SyncPacks Step Runner, and the Scheduler. If the newest data is unavailable, the System Health widget displays the last available data.
The following image shows an example of a System Health widget:
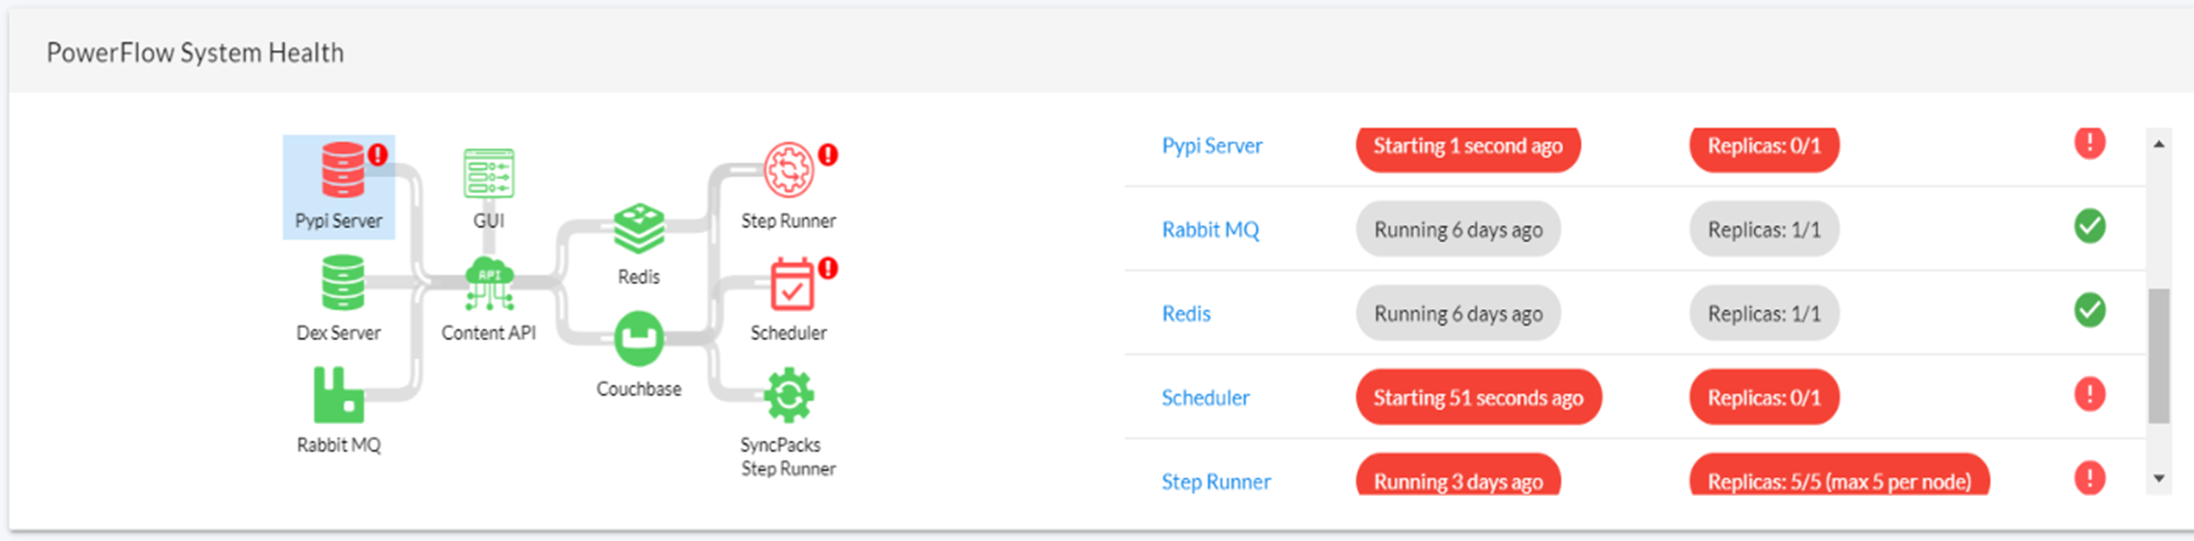
The left pane of the System Health widget contains the Process Flow View of the components of your PowerFlow system, and the right pane is the Tabular View of those components. The following are the possible health statuses for each component and how they are displayed:
- Successful health: The component is working as expected when the component's icon is green in the Process Flow View and a green check mark (
 ) appears in the corresponding line of the Tabular View.
 - Failed health: The component has errors that need attention (the service is down) when the component's icon is red in the Process Flow View, with a red exclamation point (
 ) next to the component's icon. The red exclamation point () also appears in the corresponding line of the Tabular View, along with red ovals for the second and third columns of the table.
The Tabular View has two behaviors:
- In the default display, the information in the Process Flow View on the left is duplicated in a tabular format in the Tabular View on the right.
-
When you click a component's icon in the Process Flow View or a component's name in the Tabular View, the high-level information for a particular component appears in a pop-up window:
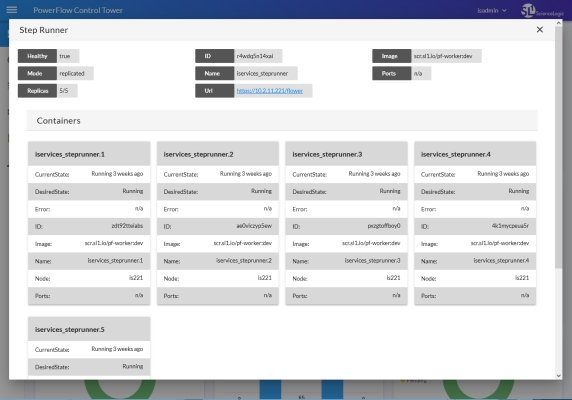
The pop-up displays the current status and related information for all containers in that component. The pop-up also includes a link to the internal user interface for that service within the cluster, such as a link to the Couchbase user interface for the Couchbase component.

The Favorite Applications Widget
The Favorite Applications widget on the PowerFlow Control Tower page lets you select the PowerFlow applications that are important to you and track their status:

By displaying the most frequently run applications, you can see how your PowerFlow system is automating your most common use cases.
The number of favorite applications is limited to 16 applications per user.
Contents of the Favorite Applications Widget
The toolbar at the top right of the widget includes the following buttons:
- (
 ). Displays a pop-up message with data for the Time Stamp, Number of Runs to Display, and the Queue for the widget.
 - (
 ). Creates a copy of the Favorite Applications widget. Making a copy lets you display more than one set of favorite applications, and you can create multiple widgets to group applications that serve a specific purpose.
 - (
 ). Displays the following options:
- Configure. Opens the Configure Widget pane, where you can update the Widget Title, Widget Size, Time Stamp for the application runs (24 hours or 48 hours), Total Number of Application Runs to Display, Queue information, and an editable list of Favorite Applications to display in the widget.
- Reorder Items. Reorder the applications currently showing in the Favorite Applications widget. Use the up and down arrows to arrange the applications, and click when you are done.
- Delete. Deletes that Favorite Applications widget.
The following details are included in this widget:
- Application Name. Names and links to favorite applications.
- Last Run. Status of the most recent run of a favorite applications; hover over the icon to see more information:
| Icon | Status |
|---|---|
|
|
The application ran successfully. |
|
|
The application failed to run successfully. |
|
|
The application has not been run. |
- Successful. Number of successful runs in the last 24 hours.
- Failed. Number of failed runs in the last 24 hours.
- Actions. Includes the following icons:
-
Run (
 ). Runs that PowerFlow application. If you hover over the button, you can select Custom Run to open the Custom Run window, where you can specify logging levels, the configuration object, and custom parameters for the run.
 -
View (
 ). Opens the Application detail page, where you can see the steps that make up the application.
 -
Unfavorite (
 ). Removes the application from the list of favorites.
If you are using a small screen, or if the browser window where you are running PowerFlow is not maximized, the three Actions icons might not display. To access the icons, click the Actions button (![]() ) and select an icon from the pop-up menu.
) and select an icon from the pop-up menu.
Using the Favorite Applications Widget
To add an application to the Favorite Applications widget:
-
Go to the Applications page and click the Favorite icon (
 ) for the application you want to add to the list. A Favorite the App window appears.
 -
Select the group or groups of favorites that will include that application and click . The application is added to the list of favorite applications on the Favorite Applications widget.
The data that displays in the widget can be adjusted by editing the Configuration pane, which you can access by clicking the button (
) and selecting Configure. -
To remove an application from the Favorite Applications widget, click the Unfavorite icon (
). If a favorite PowerFlow application is deleted, that application is removed from the Favorite Applications widget.
To run a favorite application in the Favorite Applications widget:
- Click the button that corresponds to the application in the Actions column. If you hover over the button, you can select Custom Run to open the Custom Run window, where you can specify logging levels, the configuration object, and custom parameters for the run.
-
If the run succeeded, a green check mark will appear; if the run failed, a red exclamation point will appear.
You can select multiple applications to run them at the same time or remove them from your favorites.
The Workflow Health and Interconnectivity Widget
The Workflow Health and Interconnectivity widget on the PowerFlow Control Tower page lets you monitor the connectivity of the third-party applications that you are integrating withSL1. Each pane in the widget represents a workflow that you are monitoring with PowerFlow, such as ServiceNow Business Services or Incident Details.
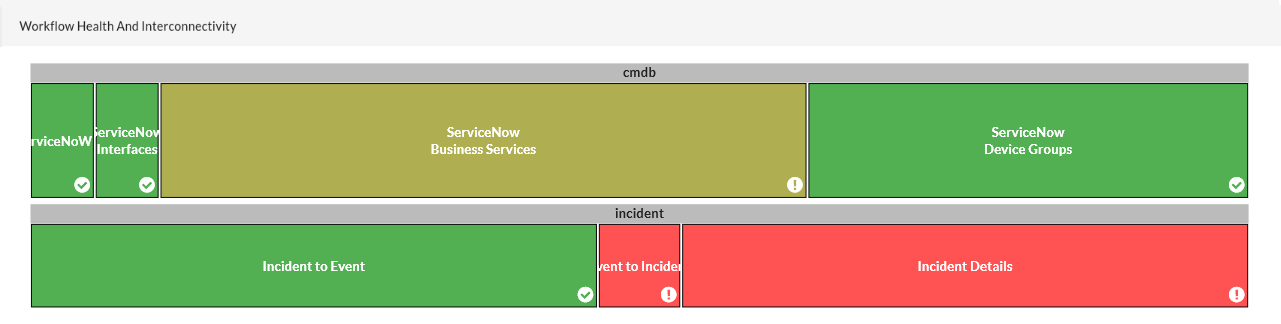
The color of the panes in the widget change based on the number of failed runs compared to the number of successful runs. More failed runs cause a pane to turn red, while successful runs cause a pane to turn green. If there are a combination of failed and successful runs, the pane might be a lighter shade of green or red.
Using the Workflow Health and Interconnectivity Widget
On the Workflow Health and Interconnectivity widget, you can hover over an endpoint on the widget to view a pop-up with additional information, including the health, last run and the Synchronization PowerPacks used by the endpoint.

A message will display in the PowerFlow user interface if the Workflow Health and Interconnectivity widget or the System Health widget detect a missing or misconfigured Synchronization PowerPack.
The All Tasks, Workers, and Applications Widgets
The All Tasks, Workers, and Applications widgets on the PowerFlow Control Tower page let you monitor the status of the various tasks, workers, and applications that are running on your PowerFlow system. You can use this information to quickly determine if your PowerFlow instance is performing as expected:
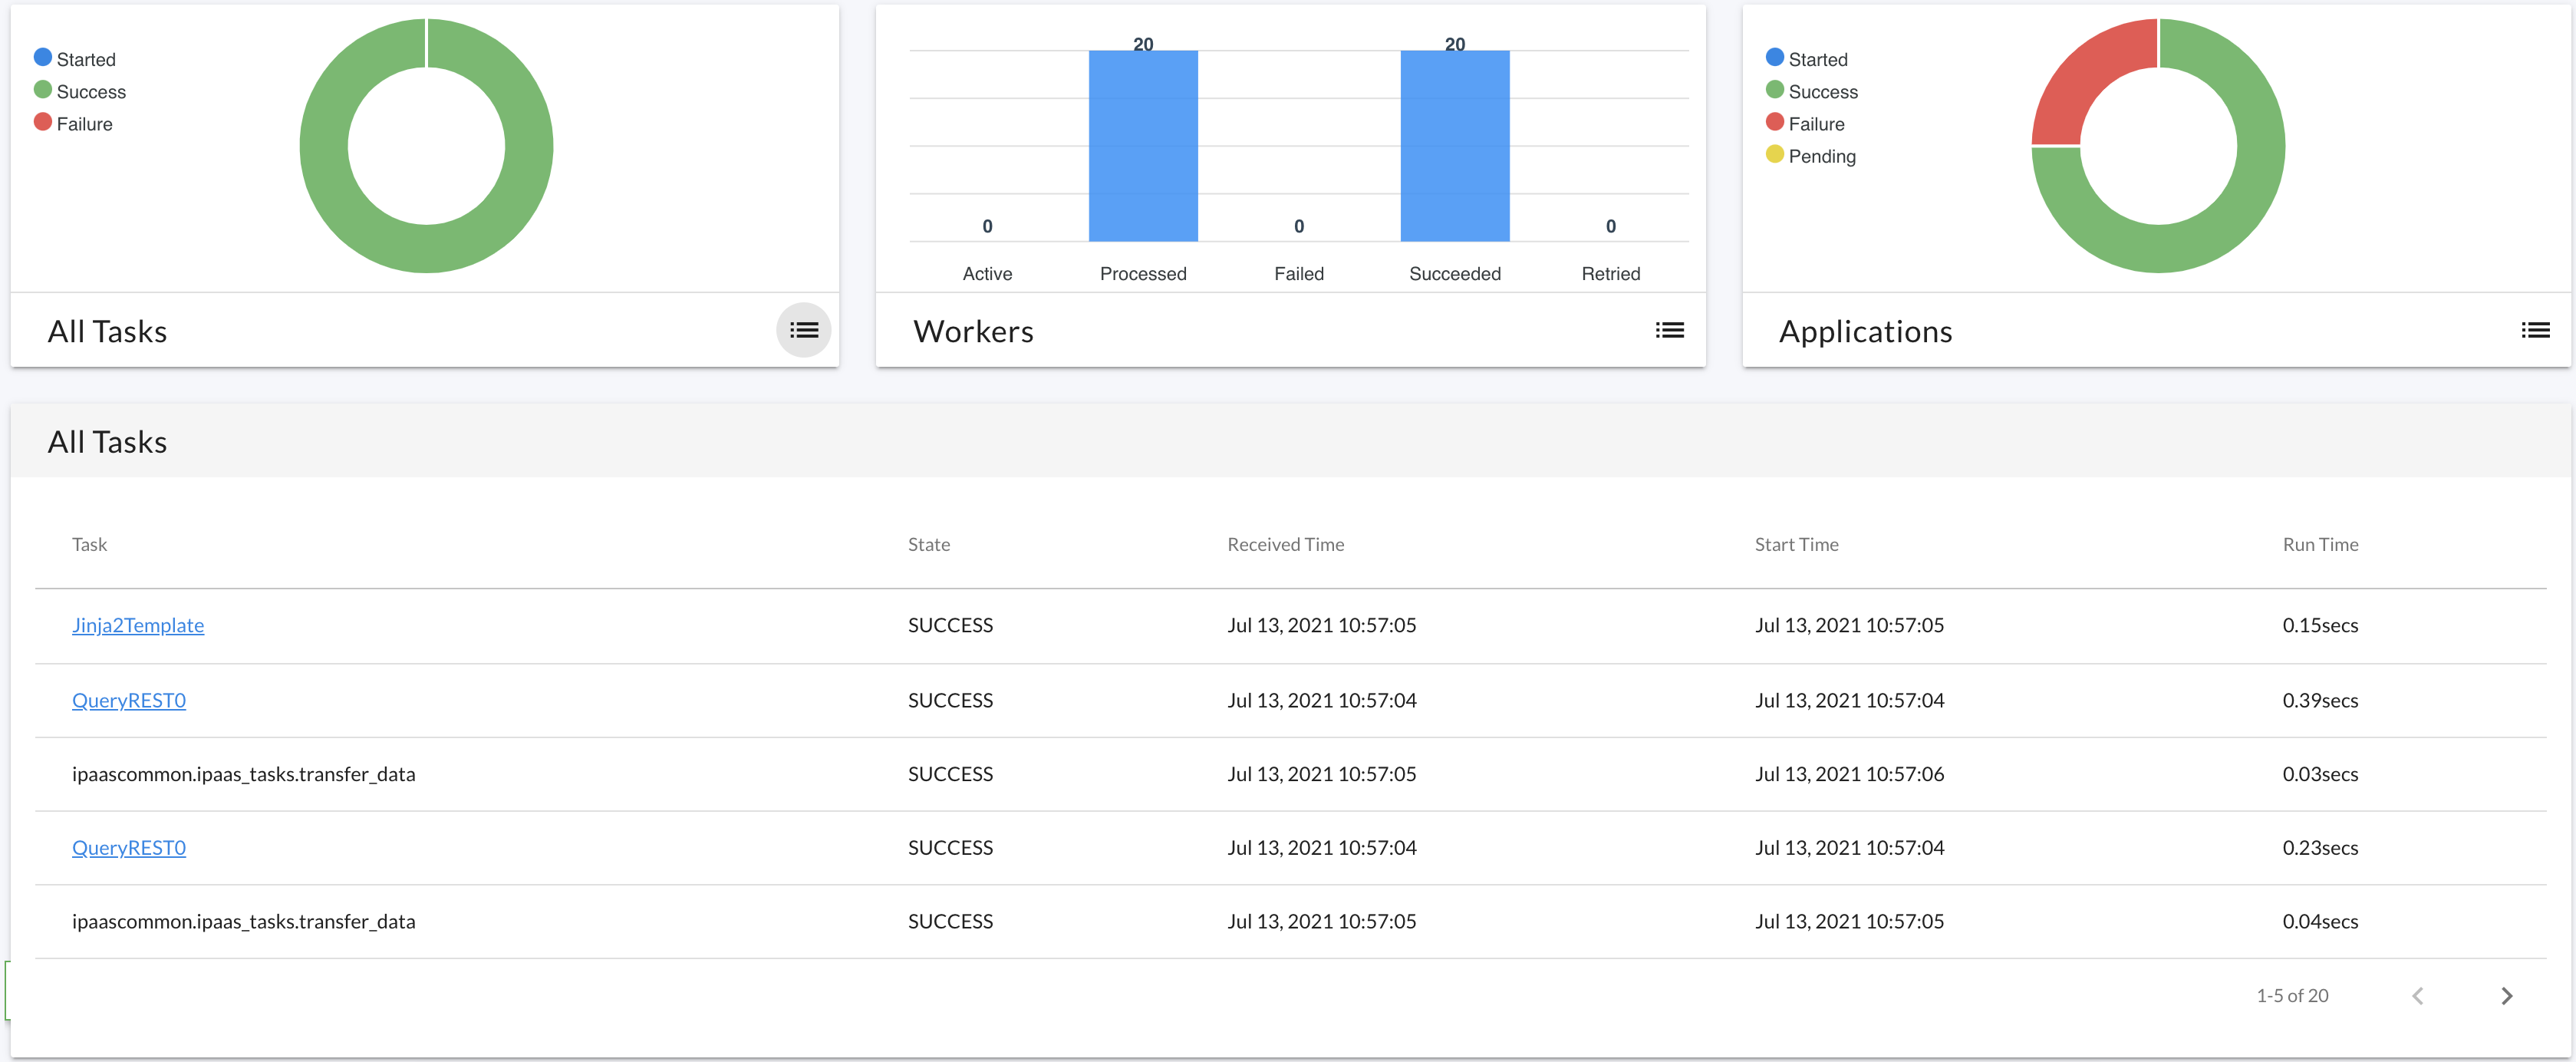
You can customize the All Tasks, Workers, and Applications charts on the PowerFlow Control Tower page to change the type of chart, status type, data type, and timeframe for each set of charts.
To view more information about your system:
- Hover over a circle graph or a bar chart item to view a pop-up field that contains the count for that item on the graph or chart, such as "Success: 48" for successful tasks on the All Tasks graph.
- Click the List icon (
 ) for the All Tasks, Workers, or Applications graphs to view a list of relevant tasks, workers, or applications. Use the left and right arrow icons to move through the list of items. Click on the slice of the pie or the bar in one of the graphs to see that specific sub-group.
 - To view additional details about a specific tasks, click the List icon () for the All Tasks graph and then click the link for the task, where relevant. The application aligned with that task appears, and you can select a step and view the Step Log details for that step.
If a "Scheduled fetch failed" pop-up message appears on this page or any other page in the PowerFlow user interface, your user interface session might have expired. To address this issue, simply log out of the PowerFlow user interface and log back in again.