![]()
Use the following menu options to navigate the SL1 user interface:
- To view a pop-out list of menu options, click the menu icon (
 ).
). - To view a page containing all the menu options, click the Advanced menu icon (
 ).
).
The following video explains Concurrent SNMP Collection:
This
Using Concurrent SNMP Collection
To increase the scale for SNMP collection, you can enable Concurrent SNMP Collection. Concurrent SNMP Collection uses the standalone container called the SL1 SNMP Collector.
The SNMP Collector is an independent service that runs as a container on a Data Collector. When you enable Concurrent SNMP Collection, each Data Collector will contain four (4) SNMP Collector containers.
On each Data Collector, SL1 will restart each of the SNMP Collector containers periodically to ensure that each container remains healthy. When one SNMP Collector container is restarted, the other three SNMP Collector containers continue to handle the workload.
With Concurrent SNMP Collection, SNMP collection tasks can run in parallel. A single failed task will not prevent other tasks from completing.
Concurrent SNMP Collection provides:
- Improved throughput for SNMP Dynamic Applications
- Reduced use of resources on each Data Collector
- More dependable collection from high-latency Devices
You can enable all, one, or multiple Collector Groups to use concurrent SNMP collection.
Enabling Concurrent SNMP Collection
This feature is disabled by default.
To enable Concurrent SNMP Collection in SL1:
-
Go to the Behavior Settings page (System > Settings > Behavior).
- Check the Enable Concurrent SNMP Collection field.
- Click .
If you do not want all of your SL1 Collectors to use Concurrent SNMP Collection, you can specify which Collector Units should use it in Enabling a Collector Group to Use Concurrent SNMP Collection.
Enabling a Collector Group to Use Concurrent SNMP Collection
Depending on the needs of your SL1 environment, you can enable or prevent a Collector Group from using concurrent SNMP collection.
To enable Concurrent SNMP Collection with a SL1 Collector Group:
-
Go to the Collector Group Management Page (System > Settings > Collector Groups):

- Click the wrench icon (
 ) for the Collector Group you want to edit. The fields at the top of the page are updated with the data for that Collector Group.
 -
Select an option in the Enable Concurrent SNMP Collection dropdown:
- Use system-wide default. Select this option if you want this Collector Group to use or not use Concurrent SNMP Collection based on the Enable Concurrent SNMP Collection field on the Behavior Settings page. This is the default.
- Yes. Select this option to enable Concurrent SNMP Collection for this Collector Group, even if you did not enable it on the Behavior Settings page.
- No. Select this option to prevent this Collector Group from using Concurrent SNMP Collection, even if you did enable it on the Behavior Settings page.
- Update the remaining fields as needed, and then click .

Troubleshooting Concurrent SNMP Collection
To troubleshoot issues with Concurrent SNMP Collection:
- Make sure that you have enabled Concurrent SNMP Collection on the Behavior Settings page.
- Make sure that the "Data Collection: SNMP Collector" service is enabled on the Process Manager page. See Monitoring the SNMP Collector Service.
- To monitor and view the data flowing through the Collector Unit, review the logs.
- To help identify performance issues, enable and collect metrics for Concurrent SNMP Collection.
Monitoring the SNMP Collector Service
You can monitor the "Data Collection: SNMP Collector" service on the Process Manager page (System > Settings > Admin Processes, or System > Settings > Processes in the classic user interface):
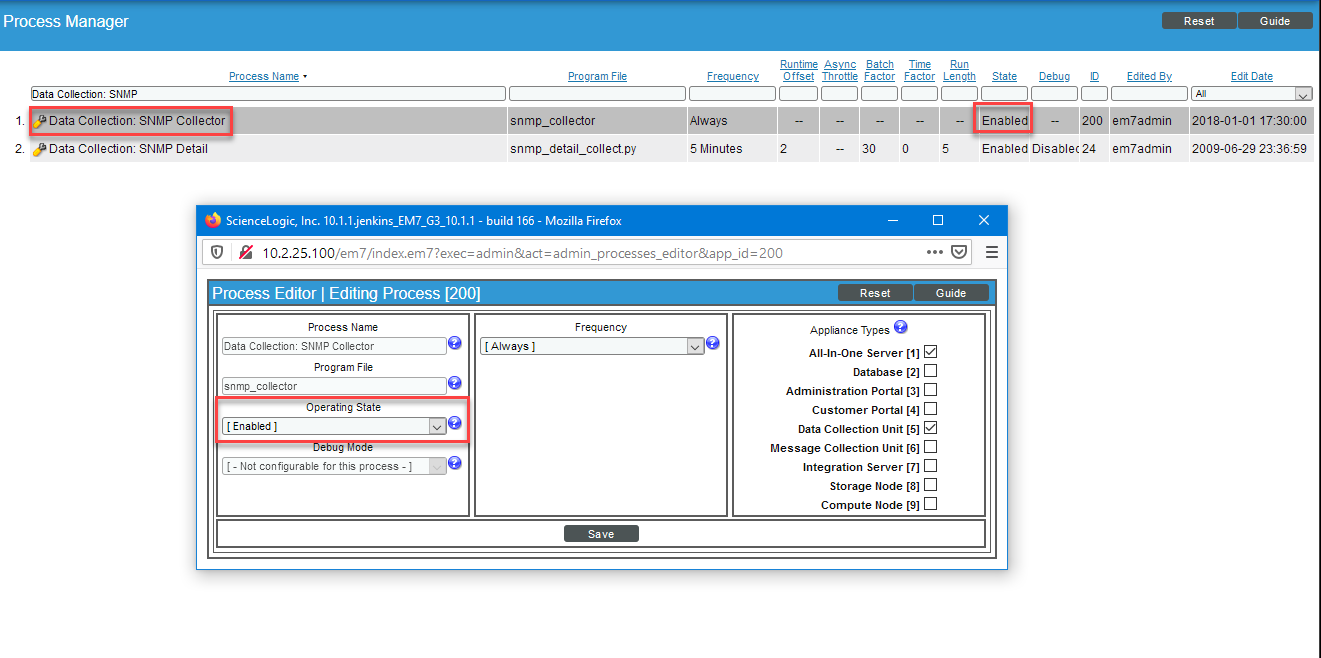
As you can see from the image above, the Debug Mode field on the Process Editor page for the "Data Collection: SNMP Collector" service is grayed out. However, you can set the Debug mode in the /opt/em7/services/snmp_collector/snmp_collector.env file.
Setting the Log Level for Net-SNMP Bindings for Concurrent SNMP Collection
For concurrent SNMP collection, you can control the volume of log entries related to the Net-SNMP bindings by editing the file /opt/em7/services/snmp_collector/snmp_collector<collector_number>.env to specify the log level for each of the four SNMP collectors (containers) that run on each Data Collector. SL1 then writes the log data to /var/log/em7/snmp_collector.log (on each Data Collector).
To set the log level for Net-SNMP bindings:
- Using the vi editor, edit the SNMP collector file for one of the four SNMP collectors (containers) on your Data Collector. For example:
- Edit the value for NETSNMP_BINDINGS_LOG_LEVEL to set one of the following values:
- DEBUG. Provides the most logs, including logs from the NETSNMP selector, in the snmp_collector.log file.
- INFO. (Default behavior) When set to INFO, or when not explicitly set to any other value, fewer logs related to the Net-SNMP bindings are written to snmp_collector.log.
- Save your changes to the file by entering :wq.
vi /opt/em7/services/snmp_collector/snmp_collector4.env
If you have not set the Net-SNMP bindings log level previously, you must add this line to the file.
Viewing Logs forConcurrent SNMP Collection
You can view logs for the SNMP Collector service directly from log files in the filesystem. Review the logs in SL1 to view the data flowing through the Collector Unit.
SNMP Collector Service Logs
You can view the SNMP Collector service logs from the filesystem in /var/log/em7/snmp_collector.log.
For concurrent SNMP collection, each log entry in /var/log/em7/snmp_collector.log (on each Data Collector) includes a job ID and a bundle ID to provide for easy tracking.
The following is an example of the log data (line breaks were added to the log text below to make the text easier to read):
[em7admin@100-100-100-20 ~]$ tail /var/log/em7/snmp_collector.log
2019-10-11T12:59:57.984767+00:00 100-100-100-20 snmp_collector: snmp_collector_1  |
MARIADB_PSWD          : em7admin
2019-10-11T12:59:57.985097+00:00 100-100-100-20 snmp_collector: snmp_collector_1  |
THROTTLING_DELAY      : 0.1
2019-10-11T12:59:57.985637+00:00 100-100-100-20 snmp_collector: snmp_collector_1  |
2019-10-11T12:59:57.986186+00:00 100-100-100-20 snmp_collector: snmp_collector_1  |
::INFO::1::__main__.41:::Starting ASNMP service loop...
2019-10-11T12:59:57.986970+00:00 100-100-100-20 snmp_collector: snmp_collector_1  |
::DEBUG::1::asyncio.53:::Using selector: EpollSelector
2019-10-11T12:59:57.988066+00:00 100-100-100-20 snmp_collector: snmp_collector_1  |
::DEBUG::1::snmp_collector.snmp_collector.350:::replacing existing loop: <_UnixSelectorEventLoop running=False
closed=False debug=False>
2019-10-11T12:59:57.988644+00:00 100-100-100-20 snmp_collector: snmp_collector_1  |
::DEBUG::1::asyncio.53:::Using selector: NetsnmpEpollSelector
2019-10-11T12:59:57.989020+00:00 100-100-100-20 snmp_collector: snmp_collector_1  |
::INFO::1::snmp_collector.snmp_collector.269:::configuring HTTP endpoint server on 127.0.0.1:8082
2019-10-11T12:59:57.989410+00:00 100-100-100-20 snmp_collector: snmp_collector_1  |
::INFO::1::snmp_collector.snmp_collector.202:::waiting on collection jobs
2019-10-11T12:59:57.989780+00:00 100-100-100-20 snmp_collector: snmp_collector_1  |
::INFO::1::snmp_collector.snmp_collector.329:::wait for results to queue
[em7admin@100-100-100-20 ~]$
SNMP Collector Service Logs - Timeouts
The SNMP Collector service log includes error logs that may help troubleshoot collection issues against devices, such as timeouts. The following is an example of timeout data:
2020-03-03T22:17:03.790777+00:00 c3ao1 snmp_collector[19773]:
::INFO::1::aiohttp.access.233:::127.0.0.1 [03/Mar/2020:22:17:03 +0000]
"GET / HTTP/1.1" 200 164 "-" "SL1 check 2020-03-03 22:17:03.775014"
2020-03-03T22:17:03.798045+00:00 c3ao1 snmp_collector[19773]:
::INFO::1::snmp_collector.asnmp_service_handlers.68:::queuing 1 jobs
2020-03-03T22:17:03.798713+00:00 c3ao1 snmp_collector[19773]:
::INFO::1::snmp_collector.snmp_collector.292:::number of jobs: 1
2020-03-03T22:17:03.798887+00:00 c3ao1 snmp_collector[19773]:
::INFO::1::aiohttp.access.233:::127.0.0.1 [03/Mar/2020:22:17:03 +0000]
"POST / HTTP/1.1" 200 186 "-" "SL1 collect 2020-03-03 22:17:03.795337"
2020-03-03T22:17:06.801777+00:00 c3ao1 snmp_collector[19773]:
::ERROR::1::snmp_collector.netsnmp_wrapper.250:::[addr=127.0.0.1,oid=.1.3.6.1.4.1.19567.2.1.2.15.1.101.1]
Timeout
2020-03-03T22:17:06.802834+00:00 c3ao1 snmp_collector[19773]:
::INFO::1::snmp_collector.snmp_collector.192:::Timeout error - failed to collect for request Request
(oid='.1.3.6.1.4.1.19567.2.1.2.15.1.101.1', cobj=SnmpCollectionObjectV1(snippet_arg='.1.3.6.1.4.1.19567.2.1.2.15.1.101.1',
obj_id=16051, type='string', result=None), cred=SnmpCredentialV1(version=2, address='127.0.0.1', port=161,
timeout=1500, retries=1, community_read_only='em7default', community_read_write='', v3_security_name='',
v3_security_passphrase='', v3_authentication_protocol='', v3_security_level='', v3_security_engine_id='',
v3_privacy_protocol='', v3_privacy_protocol_passphrase='', v3_context_engine_id='', v3_context_name='',
cred_id=56), pdu_packing=0, collect_session=<snmp_collector.netsnmp_wrapper.CollectSession object at 0x7f82a6d90210>,
start_time=datetime.datetime(2020, 3, 3, 22, 17, 3, 798228), end_time=None)
2020-03-03T22:17:06.804296+00:00 c3ao1 snmp_collector[19773]:
::ERROR::1::snmp_collector.netsnmp_wrapper.250:::[addr=127.0.0.1,oid=.1.3.6.1.4.1.19567.2.1.2.15.2.101.1]
Timeout
2020-03-03T22:17:06.804550+00:00 c3ao1 snmp_collector[19773]:
::INFO::1::snmp_collector.snmp_collector.192:::Timeout error - failed to collect for request Request
(oid='.1.3.6.1.4.1.19567.2.1.2.15.2.101.1', cobj=SnmpCollectionObjectV1
(snippet_arg='.1.3.6.1.4.1.19567.2.1.2.15.2.101.1', obj_id=16052, type='string', result=None),
cred=SnmpCredentialV1(version=2, address='127.0.0.1', port=161, timeout=1500, retries=1,
community_read_only='em7default', community_read_write='', v3_security_name='', v3_security_passphrase='',
v3_authentication_protocol='', v3_security_level='', v3_security_engine_id='', v3_privacy_protocol='',
v3_privacy_protocol_passphrase='', v3_context_engine_id='', v3_context_name='', cred_id=56), pdu_packing=0,
collect_session=<snmp_collector.netsnmp_wrapper.CollectSession object at 0x7f82a6d90210>,
start_time=datetime.datetime(2020, 3, 3, 22, 17, 3, 798287), end_time=None)
2020-03-03T22:17:06.805840+00:00 c3ao1 snmp_collector[19773]:
::ERROR::1::snmp_collector.netsnmp_wrapper.250:::[addr=127.0.0.1,oid=.1.3.6.1.4.1.19567.2.1.2.15.3.101.1]
Timeout
Logs for Collection Processes
Because collection jobs are sent to the SNMP Collector service by other collection processes, such as Dynamic Application collection, you might want to review logs from the calling process to uncover useful debugging details.
The logs for the calling service will verify whether the system is configured to send collection jobs to the SNMP Collector service. With the system setting value enabled, the logs will show the following:
[em7admin@c3ao1 ~]$ tail -f /var/log/em7/silo.log
"2020-03-03 13:15:05,039","DEBUG","1029","11","collect_dynamic","552","Scheduling work for 8 potential jobs"
"2020-03-03 13:15:05,039","DEBUG","1029","11","collect_dynamic","560","Attempting to schedule job (did, app_id): (1, 1547)"
"2020-03-03 13:15:05,040","UIDEBUG","1029","11","collect_dynamic","121","Skipping scheduling of non-collectable Discovery
and Label (Config Group) objects: [16056, 16057, 16060]"
"2020-03-03 13:15:05,042","UIDEBUG","1029","11","collection_object_filter","129","Object 16051 is enabled for collection"
"2020-03-03 13:15:05,043","UIDEBUG","1029","11","collection_object_filter","129","Object 16052 is enabled for collection"
"2020-03-03 13:15:05,044","UIDEBUG","1029","11","collection_object_filter","129","Object 16053 is enabled for collection"
"2020-03-03 13:15:05,044","UIDEBUG","1029","11","collection_object_filter","129","Object 16054 is enabled for collection"
"2020-03-03 13:15:05,044","UIDEBUG","1029","11","collection_object_filter","129","Object 16055 is enabled for collection"
"2020-03-03 13:15:05,048","UIDEBUG","1029","11","collection_object_filter","129","Object 16058 is enabled for collection"
"2020-03-03 13:15:05,050","UIDEBUG","1029","11","collection_object_filter","129","Object 16059 is enabled for collection"
"2020-03-03 13:15:05,063","DEBUG","1029","11","collect_dynamic","961","SNMP Collector service enabled: True (1)"
"2020-03-03 13:15:05,166","DEBUG","1029","11","collect_dynamic","641","Alternate collection process found for did 1 app 1547"
"2020-03-03 13:15:05,166","DEBUG","1029","11","collect_dynamic","786","did 1 app 1547 has no advanced syntax oids and no snmpv3
- asynchronous SNMP Collector can be used"
With the system setting value disabled, the logs will show the following:
[em7admin@c3ao1 ~]$ tail -f /var/log/em7/silo.log
"2020-03-03 13:04:04,331","UIDEBUG","24814","11","collection_object_filter","129","Object 16058 is enabled for collection"
"2020-03-03 13:04:04,331","UIDEBUG","24814","11","collection_object_filter","129","Object 16059 is enabled for collection"
"2020-03-03 13:04:04,335","DEBUG","24814","11","collect_dynamic","961","SNMP Collector service enabled: False (0)"
The calling process will also check to see if the SNMP Collector service, if enabled, appears to be healthy and responding normally. In cases where the service does not appear healthy, results of this failure will be logged and collection will fall back to legacy (non-asynchronous) collection code:
[em7admin@c3ao1 snmp_collector]$ tail -f /var/log/em7/silo.log
"2020-03-03 13:24:03,021","DEBUG","10332","11","collect_dynamic","961","SNMP Collector service enabled: True (1)"
"2020-03-03 13:24:03,046","INFO","10332","11","collect_dynamic","947","SNMP Collector healthcheck failed: service endpoint
not responding to GET request"
"2020-03-03 13:24:03,059","DEBUG","10332","11","collect_dynamic","950","healthcheck failed with configuration:
{'url': 'http://localhost:8082/', 'headers': {'User-Agent': 'SL1 check 2020-03-03 13:24:03.034836'}, 'timeout': 1.5}"
"2020-03-03 13:24:03,060","INFO","10332","11","collect_dynamic","970","Using legacy SNMP collection."
When the service is enabled and responding normally, the logs will report that jobs are accepting jobs successfully by noting the service endpoint API response:
"2020-03-03 13:28:02,343","DEBUG","13093","11","collect_dynamic","641","Alternate collection process found for did 1 app 1545"
"2020-03-03 13:28:02,343","DEBUG","13093","11","collect_dynamic","786","did 1 app 1545 has no advanced syntax oids and no
snmpv3 - asynchronous SNMP Collector can be used"
"2020-03-03 13:28:02,350","DEBUG","13093","11","collect_dynamic","861","SNMP Collector endpoint ok response: 200"
"2020-03-03 13:28:02,351","DEBUG","13093","11","collect_dynamic_config","93","dynamic_collect_config.request_chunk_size = 200"
"2020-03-03 13:28:02,352","DEBUG","13093","11","collect_dynamic","756","collecting 4 tasks for 0 devices"
"2020-03-03 13:28:02,353","DEBUG","13093","11","collect_dynamic_config","85","dynamic_collect_config.num_chunk_workers = 2"
"2020-03-03 13:28:02,355","DEBUG","13093","11","shared","124","running collect asynchronously"
Collecting Metrics for Concurrent SNMP Collection
To help with troubleshooting, you can collect metrics for Concurrent SNMP Collection. For example, you can collect duration and CPU metrics that you can compare with legacy SNMP collection, and you can use these metrics to identify any performance issues.
If Concurrent SNMP Collection is enabled, when you execute an SNMP Dynamic Application, SL1 uses the SNMP Collector service. The output in the silo.log file includes the following line: "Employing Asynchronous SNMP (ASNMP) Service."
To enable and collect metrics for Concurrent SNMP Collection:
-
To enable metrics for Concurrent SNMP Collection, add the following line to the /opt/em7/services/snmp_collector/snmp_collector.env file:
PROMETHEUS_CLIENT_PORT=8083
-
Run the following command on the SL1 system:
sudo servicectl restart snmp_collector
-
Align the "ScienceLogic: SNMP Collector Performance" Dynamic Application to the Collector Unit device, using the "ScienceLogic: SNMP Collector" credential.
Collection must happen on the Collector Unit itself, meaning the Collector Unit is assigned to itself for collection, not another Collector Unit in the Collector Group.
The available metrics include:
- Average Round Trip Delay
- Average Throttling Delay
- Average Timeout Delay
- Average Transmission Delay
- Cached Sessions
- Forward Results Time
- Jobs Queue Depth
- Jobs Queue Egress Count
- Jobs Queue Egress Rate
- Jobs Queue Ingress Count
- Jobs Queue Ingress Rate
- Load Factor
- Process CPU Utilization
- Process Open FDs
- Process Resident Memory
- Process Virtual Memory
- Requests Completed Successfully
- Requests Completed Successfully Percentage
- Requests Initiated
- Requests Pending
- Requests Throttling Completed
- Requests Timed Out
- Requests Transmitted
- Results Queue Depth
- Results Queue Egress Count
- Results Queue Egress Rate
- Results Queue Ingress Count
- Results Queue Ingress Rate
- Throttling Count
- Throttling Rate Average
- Throttling Rate Maximum
- Throttling Rate Minimum
- Time Between Select
- Time In Select