This
The following video explains server monitoring with the SL1 Agent:
Use the following menu options to navigate the SL1 user interface:
- To view a pop-out list of menu options, click the menu icon (
).
- To view a page containing all the menu options, click the Advanced menu icon (
).
This
What is the SL1 Agent?
The SL1 agent is a program that you can install on a device monitored by SL1. The SL1 agent collects data from the device and pushes that data back to SL1.
Similar to a Data Collector or Message Collector, the SL1 Agent collects data about infrastructure and applications.
The agent can be configured to communicate with either the Message Collector or the Compute Cluster.
How the SL1 Agent Works in Different Environments
There are two supported "generations" of the SL1 agent that you can use to gather data: Gen 1 and Gen 3. The agent itself is the same from one generation to the next; the only difference between the generations is the environment where the agent is used.
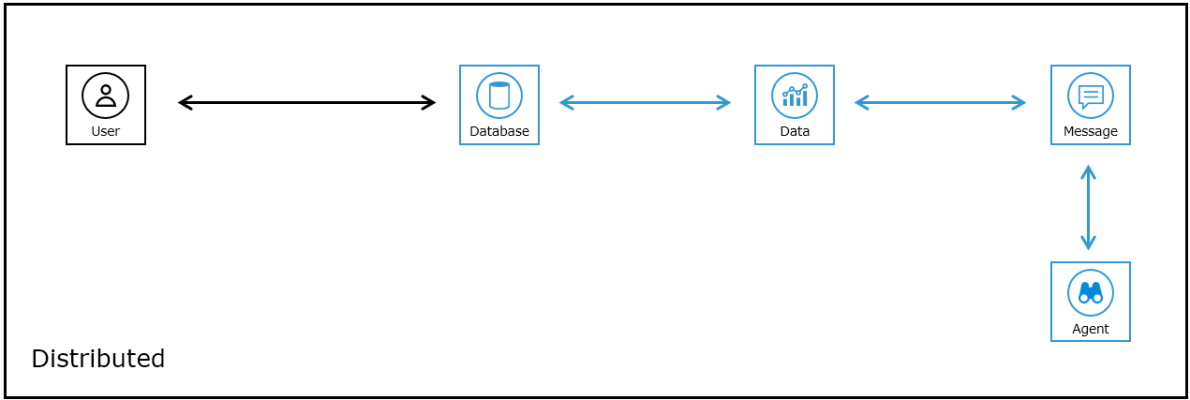
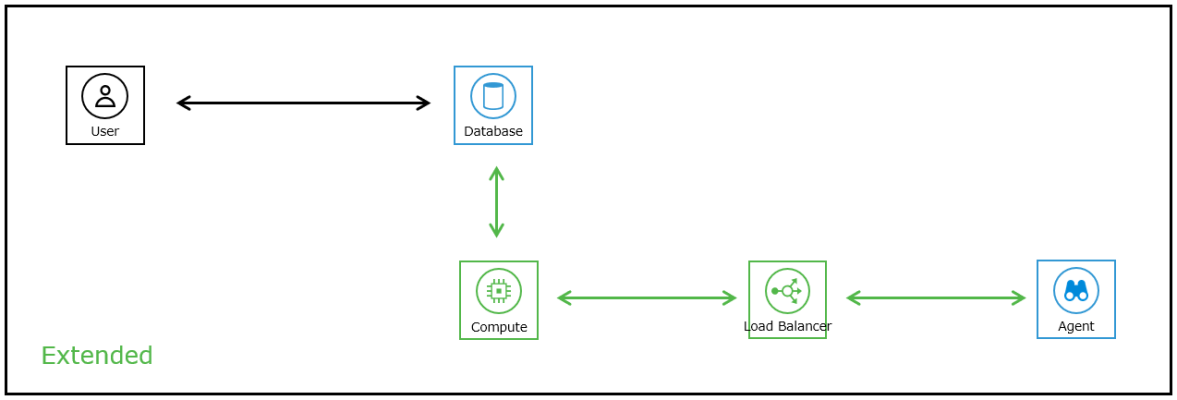
In brief, a Gen 1 agent uses a distributed SL1 environment to upload data directly to a Message Collector (MC), while a Gen 3 agent uses the SL1 Extended Architecture to upload data to the "Streamer" service running on the SL1 Compute Node cluster.
The following list provides more details about how SL1 uses the different generations of the SL1 agent:
-
Gen 1 agent: Introduced in SL1 version 8.2.0, the Gen 1 agent uses a distributed environment to upload data directly to a Message Collector (MC). Next, Dynamic Applications running on a Data Collector query data from the Message Collector with an API. The Data Collector (DC) then sends the data to the SL1 Database Server:
The Gen 1 agent provides limited infrastructure health reporting, including Log File Monitoring, Processes, and System Vitals like Availability, CPU Usage, Memory Usage, and Disk Usage. This agent is sometimes called the "P0" agent.
- Gen 2 agent: This version of the agent has been deprecated.
-
Gen 3 agent: Introduced in SL1 version 8.12.0, the Gen 3 agent uses the SL1 Extended Architecture to upload data through a load balancer to the "Streamer" service running on the SL1 Compute Node cluster. The Streamer service then forks and forwards data to other services, and eventually some services will store parsed data in the SL1Database Server:
The Gen 3 agent provides full infrastructure health reporting, including system vitals (file system, network interface, and Windows service data), log monitoring, and optionally allows you to align PowerShell Dynamic Applications to your device. Also, the Dynamic Applications in the ScienceLogic: Agent PowerPack are automatically aligned with the device with the Gen 3 agent installed on it.
If you are already running the Gen 1 agent in a distributed environment and you upgrade your SL1 system to use the SL1 Extended Architecture, any existing devices monitored by SL1 agents will work the same as before (streaming data to a Message Collector). However, if you upgrade to the SL1 Extended Architecture, ScienceLogic recommends that you start streaming your agents to the Compute Node cluster instead of to a Message Collector.
To identify the version of the agent installed on a device:
- Gen 1. On the Devices > Device Investigator > tab for that device, the Collection Poller field displays the name of the collector group that includes the Message Collector used by the agent. On the Device Manager page (Devices > Device Manager), the Collection Group column displays the name of the collector group that includes the Message Collector used by the agent.
- Gen 3. On the Devices > Device Investigator > tab for that device, the Collection Poller field displays the label Agents. On the Device Manager page (Devices > Device Manager), the Collection Group column displays the label Agents.
The following table provides an overview of the features available when using the Gen 1 or the Gen 3 agent:
| Product Capability | Gen 1 Agent | Gen 3 Agent |
|---|---|---|
|
System Vitals |
||
| Availability and Uptime | Yes |
Yes |
| CPU, Memory, File Systems, and Network Interface | CPU and Memory only | Yes |
| Processes and Windows Services | Processes only | Yes |
| Installed Software | No | Yes |
| Log Monitoring | ||
| Event Logs | Yes | Yes |
| Syslog | Yes | Yes |
| Text Logs | Yes | Yes |
| Extensible Collection | ||
| PowerShell | No | Yes |
| JMX | No | Yes |
For a detailed list of the system vital metrics you can monitor with the SL1 agent, see What System Vital Metrics Can the SL1 Agent Collect?
For a current list of supported operating systems and host system requirements for the SL1 agent, see the System Requirements for the Agent page at the ScienceLogic Support Site.
NOTE: Users who are running version 102 or later of the Microsoft: Windows Server PowerPack can collect data via the SL1 agent. For more information, see
What System Vital Metrics Can the SL1 Agent Collect?
The following sections describe the system vitals that can be collected with SL1 and with the SL1 Agent, including definitions of each metric type and the collection methods that are and are not supported for each.
Metric Descriptions
The following table describes the system vital metrics that can be collected with SL1 and the SL1 Agent:
| Metric | Type | Description |
|---|---|---|
| Availability | Performance | The ability to communicate with the managed entity or device. |
| File Systems | Configuration | The configuration of the file systems found within a managed entity that can include attributes like name, size, and type. |
| File Systems | Performance | Time series data associated with file system utilization that can include metrics like free space, size, and usage percentage. |
| Installed Software | Configuration | The software found on a managed entity that can include attributes like name, version, and installation date. |
| Network Interfaces | Configuration | The configuration of the network interface found within a managed entity that includes attributes like MAC address, IP address, position, and speed. |
| Network Interfaces | Performance | Time series data associated with physical memory utilization that includes metrics like inbound and outbound utilization, number of errors, and discard and usage percentage. |
| Physical Memory | Configuration | The configuration of the physical memory found within a managed entity that can include attributes like memory size. |
| Physical Memory | Performance | Time series data associated with physical memory utilization that can include metrics like memory used. |
| Ports | Configuration | The ports discovered on a managed entity. |
| Ports | Performance | Time series data associated with port availability. |
| Ports (Illicit) | Performance | An analysis of ports. When a port from the illicit port list is found on a managed system, the system will trigger an event indicating an illicit port has been found. |
| Processes | Configuration | The processes found on a managed entity that can include attributes like name, process ID (PID), and state. |
| Processes | Performance | Time series data associated with process performance that can include metrics like availability percentage. |
| Processor | Configuration | The configuration of the processor found within a managed entity that can include attributes like number of cores, processor model, processor speed, cache size, and CPU ID. |
| Processor | Performance | Time series data associated with processor utilization that can include metrics like CPU idle time, CPU wait time, and overall CPU time. |
| Restarts | Performance | An analysis of uptime. When uptime is less than 15 minutes, the system triggers an event indicating the system was restarted. |
| SSL Certificates | Configuration | The certificates found on a managed system. |
| SSL Certificates | Performance | An analysis of certificate expiration date. The system will trigger an event when certificates are nearing expiration. |
| Uptime | Performance | The timespan since the managed entity was last initialized. |
| Virtual Memory (Swap) | Configuration | The configuration of the virtual memory found within a managed entity. |
| Virtual Memory (Swap) | Performance | Time series data associated with virtual memory utilization. |
| Windows Services | Configuration | The services found on a managed entity that can include attributes like name and state. |
| Windows Services | Performance | Time series data associated with service performance that can include metrics like availability percentage. |
Supported Data Collection Methods for Monitoring Windows
The following table describes which methods of data collection are supported when running SL1 and the SL1 Agent on monitored Windows systems:
| Metric | Type | Agentless | Agent-Based | |||
|---|---|---|---|---|---|---|
| SNMP | WMI | PowerShell | Gen-01 | Gen-03 | ||
| Availability | Performance | Yes | Yes | Yes | Yes | Yes |
| File Systems | Configuration | Yes | Some | Yes | Some | Yes |
| File Systems | Performance | Yes | Some | Yes | Some | Yes |
| Installed Software | Configuration | Yes | No | Yes | No | Yes |
| Network Interfaces | Configuration | Yes | Some | Yes | Some | Yes |
| Network Interfaces | Performance | Yes | Some | Yes | Some | Yes |
| Physical Memory | Configuration | Yes | Yes | Yes | Yes | Yes |
| Physical Memory | Performance | Yes | Yes | Yes | Yes | Yes |
| Ports | Configuration | Yes | No | Yes | Yes | No |
| Ports | Performance | Yes | No | Yes | Yes | No |
| Ports (Illicit) | Performance | Yes | No | Yes | Yes | No |
| Processes | Configuration | Yes | Some | Yes | Yes | Yes |
| Processes | Performance | Yes | No | Yes | Yes | Yes |
| Processor | Configuration | Yes | Yes | Yes | Yes | Yes |
| Processor | Performance | Yes | Yes | Yes | Yes | Yes |
| Restarts | Performance | Yes | No | Yes | Yes | Yes |
| SSL Certificates | Configuration | Yes | No | No | No | No |
| SSL Certificates | Performance | Yes | No | No | No | No |
| Uptime | Performance | Yes | No | Yes | Yes | Yes |
| Virtual Memory (Swap) | Configuration | Yes | Yes | Yes | Yes | Yes |
| Virtual Memory (Swap) | Performance | Yes | Yes | Yes | Yes | Yes |
| Windows Services | Configuration | Yes | Some | Yes | No | Yes |
| Windows Services | Performance | Yes | Some | Yes | No | Yes |
Supported Data Collection Methods for Monitoring Linux
The following table describes which methods of data collection are supported when running SL1 and the SL1 Agent on monitored Linux systems:
| Metric | Type | Agentless | Agent-Based | ||
|---|---|---|---|---|---|
| SNMP | SSH | Gen-01 | Gen-03 | ||
| Availability | Performance | Yes | Yes | Yes | Yes |
| File Systems | Configuration | Yes | Yes | Some | Yes |
| File Systems | Performance | Yes | Yes | Some | Yes |
| Installed Software | Configuration | Yes | No | No | Yes |
| Network Interfaces | Configuration | Yes | Yes | Some | Yes |
| Network Interfaces | Performance | Yes | Yes | Some | Yes |
| Physical Memory | Configuration | Yes | Yes | Yes | Yes |
| Physical Memory | Performance | Yes | Yes | Yes | Yes |
| Ports | Configuration | Yes | Yes | Yes | No |
| Ports | Performance | Yes | Yes | Yes | No |
| Ports (Illicit) | Performance | Yes | Yes | Yes | No |
| Processes | Configuration | Yes | Yes | Yes | Yes |
| Processes | Performance | Yes | Yes | Yes | Yes |
| Processor | Configuration | Yes | Yes | Yes | Yes |
| Processor | Performance | Yes | Yes | Yes | Yes |
| Restarts | Performance | Yes | Yes | Yes | Yes |
| SSL Certificates | Configuration | Yes | No | No | No |
| SSL Certificates | Performance | Yes | No | No | No |
| Uptime | Performance | Yes | Yes | Yes | Yes |
| Virtual Memory (Swap) | Configuration | Yes | Yes | Yes | Yes |
| Virtual Memory (Swap) | Performance | Yes | Yes | Yes | Yes |
| Windows Services | Configuration | N/A | N/A | N/A | N/A |
| Windows Services | Performance | N/A | N/A | N/A | N/A |
Extensible Collection
In addition to the capabilities listed above, you can use the SL1 agent for "extensible collection", where you align the agent with Dynamic Applications to gather metrics and attributes from other infrastructures and applications.
The SL1 Extended Architecture supports aligning PowerShell Dynamic Applications to devices monitored by the SL1 Windows Agent. The SL1 Extended Architecture supports aligning JMX Dynamic Applications to devices monitored by the SL1 Linux Agent.
In addition, Dynamic Applications that leverage the Low Code No Code CLI/SSH framework can execute using the agent.
For more information, see Configuring Extensible Collection.
Agent PowerPacks
SL1 includes two PowerPacks that can be used to collect agent-based system configuration and performance data: the ScienceLogic: Agent PowerPack and the Host Agent PowerPack.
Both PowerPacks are installed by default on your SL1 system, and they include the following features:
- Dynamic Applications that collect configuration data and performance metrics from devices that are using agent-based collection
- Event Policies and alerts that are triggered when devices that are using agent-based collection meet certain status criteria
The ScienceLogic: Agent PowerPack collects agent-based data for devices on SL1 systems running on the SL1 Extended Architecture (Gen 3 agents). This PowerPack contains two Dynamic Applications:
- The "ScienceLogic Agent: System Configuration" Dynamic Applications collects the following data:
- CPU
- CPU Information
- CPUs
- Hardware Totals
- Memory
- Speed (MHz)
- Swap Capacity
- The "ScienceLogic Agent: System Performance" Dynamic Applications collects the following data:
- CPU Name
- CPU Utilization
- CPU Utilization Breakdown
- Disk Average Queue Length
- Disk IO Utilization
- Disk Name
- Memory Utilization
- Network Read
- Network Write
- Sample Time
- Swap Utilization
The Host Agent PowerPack, which collects agent-based data for devices on SL1 systems running on a distributed architecture (Gen 1 agents). This PowerPack contains two Dynamic Applications:
- The "Host Agent: System Config" Dynamic Applications collects the following data:
- CPU
- CPU Information
- CPUs
- Disk
- Disk Information
- Disk Space
- Disks
- Hardware Totals
- Memory
- Size
- Speed (MHz)
- The "Host Agent: System Perf" Dynamic Applications collects the following data:
- CPU Name
- CPU Utilization
- CPU Utilization Breakdown
- Disk Average Queue Length
- Disk Name
- Disk Utilization
- Memory Utilization
- Network Read
- Network Write
- Sample Time
- Storage Available
- Storage Name
- Storage Total
- Storage Utilization
Because the ScienceLogic: Agent PowerPack is required to collect data from devices that are using agent-based collection, SL1 does not enable you to delete or modify this PowerPack.
Agent-Compatible PowerPacks
In addition to the ScienceLogic: Agent PowerPack and the Host Agent PowerPack, there are several other Agent-compatible PowerPacks you can use to collect data from specific device types.
Windows Devices
The following PowerPacks include the SL1 Agent PowerShell Default credential and SL1 Agent device template, which you can use to execute the SL1 Agent on Windows devices with PowerShell:
- Microsoft: Windows Server
- SL1 Agent Templates for Microsoft PowerPacks, which includes templates for the following:
- Microsoft: DHCP Server
- Microsoft: DNS Server
- Microsoft: Exchange Server
- Microsoft: IIS Server
- Microsoft: Lync Server
- Microsoft: SharePoint Server
- Microsoft: SQL Server
- Microsoft: Windows Server
For more information, see
Java Management Extensions (JMX) Resources
You can also use the JMX Base Pack *BETA* PowerPack to monitor JMX resources with the SL1 agent.
For more information, see
Agent Architecture
The following sections describe how the SL1 agent works in a distributed architecture and in the SL1 Extended Architecture.
SL1 Distributed Architecture
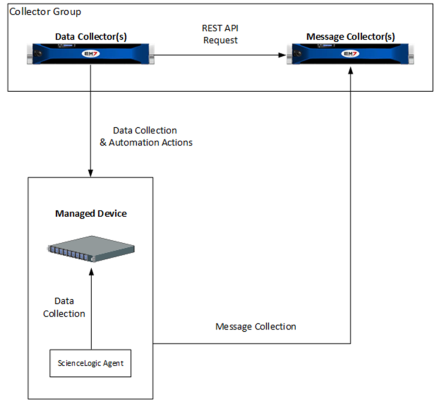
In a distributed architecture, the SL1 Agent collects data from the device on which it is installed and transfers that data to a Message Collector in an SL1 system using the HTTPS protocol. The Data Collector on which the Dynamic Applications and collection processes run then poll the Message Collector using the HTTPS protocol to transfer data to SL1.
TCP port 443 must be open between the Message Collector and the device on which an agent is installed.
In a distributed architecture, the SL1 agent requires a standalone, dedicated Message Collector. The Message Collector does not need to be dedicated to agent usage, but the Message Collector cannot be a Data Collector that also performs message collection
NOTE: Message Collectors that process data from the SL1 agent have different system requirements than Message Collectors that do not process data from the SL1 agent. For more information about the system requirements when running SL1 agents in a distributed architecture, see the System Requirements page at the ScienceLogic Support Site.
The diagram below shows the collection layer of a distributed system containing both Data Collectors and Message Collectors in which the SL1 Agent is installed on a managed device.
SL1 Extended Architecture
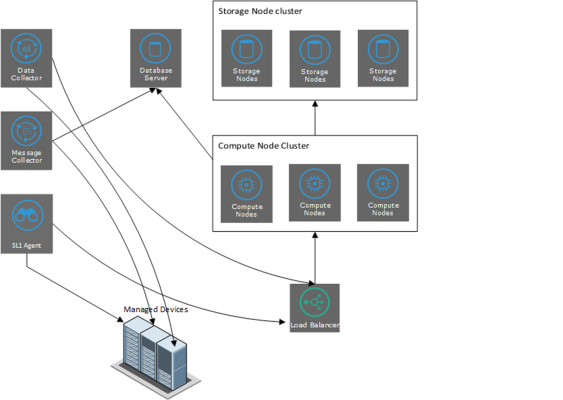
In the SL1 Extended Architecture, an SL1 agent collects data from the device on which it is installed and sends that data to a Load Balancer in front of a Compute Cluster. The Compute Cluster transforms the data and stores high-volume performance data in the Storage Cluster and other performance and configuration data in the Database Server.
If required, agents can use an HTTP proxy server as an intermediate step in sending data to SL1.
In the diagram below:
- The SL1 agent collects data from managed devices and sends the data to the Load Balancer and Compute Node cluster for processing.
- The optional Message Collector collects asynchronous traps and syslog messages and sends them to the Database Server.
- The Data Collector collects data from managed devices and sends the data to the Load Balancer and Compute Node cluster for processing and then storage.
Using an SL1 agent in the SL1 Extended Architecture provides more configuration and performance data than using an SL1 agent in a distributed architecture. This additional data includes system vitals, log data, and extensible collection.
NOTE: For more information about the system requirements when running SL1 agents in an extended architecture, see the System Requirements page at the ScienceLogic Support Site.


