This example will include a Service Dependency. The example will create a metric for availability for all devices in the Acme company. The example will use metrics from other IT Service policies to calculate device availability for all devices in the company. Specifically, the example policy acme_all_devices, will use the availability metrics and list of devices from the IT Service policies acme_east_coast_devices and acme_west_coast_devices to determine the availability of all devices in the Acme company.
This example is abbreviated and specifically highlights using a Service Dependency. For detailed examples of other aspects of IT Service policy, see the section on Creating, Editing, and Deleting IT Services or Example 1 or Example 2.
Use the following menu options to navigate the SL1 user interface:
- To view a pop-out list of menu options, click the menu icon (
).
- To view a page containing all the menu options, click the Advanced menu icon (
).
This example includes the following topics:
Creating an IT Service Policy
To define the example IT Service policy in this example, you must:
- Define two simple IT Service policies to use as Service Dependencies.
- Define a service name and basic properties. In this example, we will monitor the availability of devices at two corporate offices. The name of the IT Service policy will be acme_all_devices.
- Define a list of Service Dependencies (model) for the IT Service that includes all the external IT Service policies you want to reference. In our example, we'll use the data from two different IT Service policies to create a metric in our example IT Service policy. The metric in our example IT Service policy will include all the devices and availability data from our two Service Dependencies.
- Define metrics. A metric is based on your business processes and examines all devices or one or more service sets to evaluate the state of the IT Service. For our example, we'll examine the availability of multiple groups of devices and create a metric for availability of the sum of all devices.
NOTE: When SL1 evaluates a metric, it performs an aggregation, that is, SL1 evaluates the data for all devices specified in the definition of the metric, over a specified time period (the Aggregation Frequency). Depending on the definition of the metric, SL1 calculates the average, maximum, minimum, sum, standard deviation, or count value for all devices specified in the definition of the metric.
- Define alerts and associated events. Each alert and its associated event is triggered by a metric. In our example, we will not define alerts and events. For examples of defining alerts and events, see the section on Creating, Editing, and Deleting IT Services or Example 1 or Example 2.
Defining the Two External IT Service Policies
First, we must define the two IT Service policies that we will use as Service Dependencies. Each IT Service policy will monitor the availability of three devices.
To define the basic parameters of our two external IT Service policies, follow the steps in the following two sub-sections.
Defining "acme_east_coast_devices"
- Go to the IT Service Manager page (Registry > IT Services > IT Service Manager).
- Select the button. This new IT Service policy will monitor the availability of devices in a branch office of the Acme company.
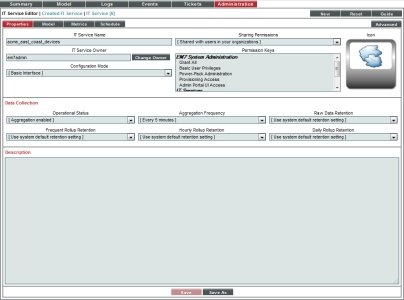
- The IT Service Editor page appears, with the tab selected.
- Select the sub-tab. Supply the following values in the following fields:
- IT Service Name. Name of the IT Service policy. We entered "acme_east_coast_devices".
- IT Service Owner. Automatically populated with your username.
- Configuration Mode. We selected Basic Interface. The Basic Interface allows you to quickly setup an IT Service policy.
- Sharing Permissions. Specifies whether other users can view and use the IT Service policy, in both the IT Service Manager page, IT Service Editor page, and in the pages in SL1 where the IT Service is visible. We selected Shared with users in your organization. The IT Service policy can be viewed and used by other users who belong to the same organization as the creator.
- Permission Keys. We did not select any permission keys.
- Operational Status. We selected Aggregation enabled.
- Aggregation Frequency. Frequency at which SL1 will collect data from all devices in the IT Service and "crunch" the data for each metric into a single value. We specified Every 5 minutes.
- Raw Data Retention. Specifies how long SL1 should store the raw data for the IT Service policy. We accepted the default value.
- Frequent Rollup Retention. Deprecated field no longer used by SL1.
- Hourly Rollup Retention. Specifies how long SL1 should store the "hourly" normalized data for the IT Service policy. We accepted the default value.
- Daily Rollup Retention. Specifies how long SL1 should store the "daily" normalized data for the IT Service policy. We accepted the default value.
- Description. We did not enter a description.
- Select the button to save the values in the tab.
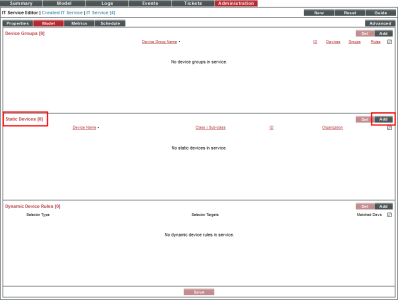
- Select the tab.
- We will statically add three servers to our policy. To add a static list of one or more devices to the list of devices for the IT Service policy, go to the Static Devices pane.
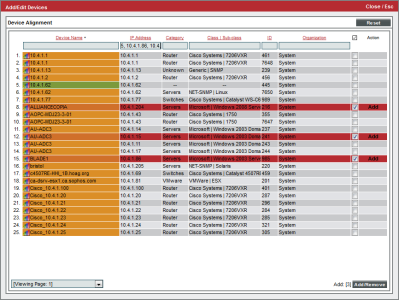
- Select the button. The Device Alignment modal page displays a list of all devices in SL1.
- In the Device Alignment modal page, we selected the checkbox for devices ALLIANCECOPIA, AU-ADC3, and BLADE1. Each is a Windows server.
- Select the button in the lower right. The selected devices will appear in the Static Devices pane.
- Select the button to save the list of devices
- We will use the default metric automatically created by SL1, Average Device Availability, so we don't have to create a custom metric.
Defining "acme_west_coast_devices"
- Go to the IT Service Manager page (Registry > IT Services > IT Service Manager).
- Select the button. This new IT Service policy will monitor the availability of devices in a branch office of the Acme company.
- The IT Service Editor page appears, with the tab selected.
- Select the sub-tab. Supply the following values in the following fields:
- IT Service Name. Name of the IT Service policy. We entered "acme_west_coast_devices".
- IT Service Owner. Automatically populated with your username.
- Configuration Mode. We selected Basic Interface. The Basic Interface allows you to quickly setup an IT Service policy.
- Sharing Permissions. Specifies whether other users can view and use the IT Service policy, in both the IT Service Manager page, IT Service Editor page, and in the pages in SL1 where the IT Service is visible. We selected Shared with users in your organization. The IT Service policy can be viewed and used by other users who belong to the same organization as the creator.
- Permission Keys. We did not select any permission keys.
- Operational Status. We selected Aggregation enabled.
- Aggregation Frequency. Frequency at which SL1 will collect data from all devices in the IT Service and "crunch" the data for each metric into a single value. We specified Every 5 minutes.
- Raw Data Retention. Specifies how long SL1 should store the raw data for the IT Service policy. We accepted the default value.
- Frequent Rollup Retention. Deprecated field no longer used by SL1.
- Hourly Rollup Retention. Specifies how long SL1 should store the "hourly" normalized data for the IT Service policy. We accepted the default value.
- Daily Rollup Retention. Specifies how long SL1 should store the "daily" normalized data for the IT Service policy. We accepted the default value.
- Description. We did not enter a description.
- Select the button to save the values in the tab.
- Select the tab.
- We will statically add three devices to our policy. To add a static list of one or more devices to the list of devices for the IT Service policy, go to the Static Devices pane.
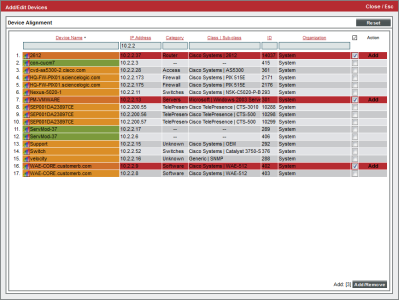
- Select the button. The Device Alignment modal page displays a list of all devices in SL1.
- In the Device Alignment modal page, we selected the checkbox for devices "10.2.2.13", "10.2.2.37", and "10.2.2.9". Each is a Cisco network device.
- Select the button in the lower right. The selected devices will appear in the Static Devices pane.
- Select the button to save the list of devices
- We will use the default metric automatically created by SL1, Average Device Availability, so we don't have to create a custom metric.
Defining the Name of the IT Service Policy and its Basic Properties
Our example IT Service policy, acme_all_devices, will examine the devices and metrics from the two external IT Service policies to calculate availability for all devices in the Acme company. To define the basic parameters of our example IT Service policy:
- Go to the IT Service Manager page Registry > IT Services > IT Service Manager).
- Select the button.
- The IT Service Editor page appears, with the tab selected.
- Select the sub-tab. Supply the following values in the following fields:
- IT Service Name. Name of the IT Service policy. We entered "acme_all_devices".
- IT Service Owner. Automatically populated with your username.
- Configuration Mode. We selected Basic Interface. The Basic Interface allows you to quickly setup an IT Service policy.
- Sharing Permissions. Specifies whether other users can view and use the IT Service policy, in both the IT Service Manager page, IT Service Editor page, and in the pages in SL1 where the IT Service is visible. We selected Shared with users in your organization. The IT Service policy can be viewed and used by other users who belong to the same organization as the creator.
- Permission Keys. We did not select any permission keys.
- Operational Status. We selected Aggregation enabled.
- Aggregation Frequency. Frequency at which SL1 will collect data from all devices in the IT Service and "crunch" the data for each metric into a single value. We specified Every 5 minutes.
- Raw Data Retention. Deprecated field no longer used by SL1.
- Frequent Rollup Retention. Specifies how long SL1 should store the "frequent" normalized data for the IT Service policy. We accepted the default value.
- Hourly Rollup Retention. Specifies how long SL1 should store the "hourly" normalized data for the IT Service policy. We accepted the default value.
- Daily Rollup Retention. Specifies how long SL1 should store the "daily" normalized data for the IT Service policy. We accepted the default value.
- Description. We did not enter a description.
- Select the button to save the values in the tab.
Defining a List of Service Dependencies for the IT Service Policy
After defining the name and basic properties of the example IT Service policy, we next define the Service Dependencies. You do this in the sub-tab.
To create the Service Dependencies for the IT Service policy:
- After performing the tasks in the previous sections, go to the IT Service Editor page for the example IT Service policy and select the sub-tab.
- Select the button.
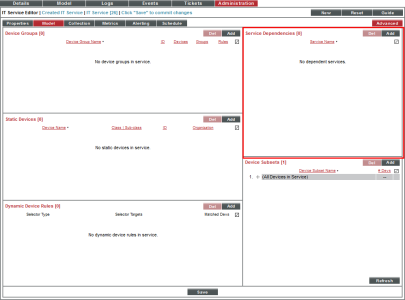
- Go to the Service Dependencies pane. Select the button.
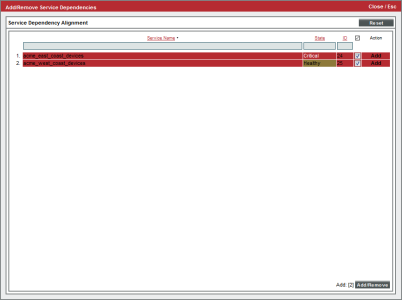
- The Service Dependency Alignment Editor modal page appears. The Service Dependency Alignment Editor modal page displays a list of all IT Services in SL1 that you are allowed to view.
- To align the two external IT Services in this example, we selected the checkbox for "acme_east_coast_devices " and "acme_west_coast_devices"
- Select the button in the lower right. The selected IT Service policies will appear in the Service Dependencies pane.
- Select the button to save the list of service dependencies.
Defining Metrics for the IT Service Policy
A metric is a measurement that helps determine the status of an IT Service.
SL1 automatically includes a default metric with each IT Service policy. The default metric is called Average Device Availability. The Average Device Availability metric examines the availability of all devices in the IT Service. By default, the Average Device Availability metric is collected from every device every minute and "crunched" and averaged every 15 minutes.
Our example uses data from two external IT Service policies (acme_east_coast_devices and acme_west_coast_devices) to determine the availability of all devices in the Acme network.
- We will define a metric for east_coast_device_availability that is a link to the acme_east_coast_devices IT Service policy.
- We will define a metric for west_coast_device_availability that is a link to the acme_west_coast_devices IT Service policy.
- We will define a metric for all_devices_availability that will examine east_coast_device_availability and west_coast_device_availability and calculate the average availability for the sum of all devices on the east coast plus all the devices on the west coast.
Defining east_coast_device_availability
- Go to the IT Service Editor page and select the sub-tab.
- Ensure that you are in Basic mode. If you see the sub-tab, you are not in Basic mode. Click on the button to toggle to Basic mode.
- Select the button.
- The Service Metric Editor modal page appears.
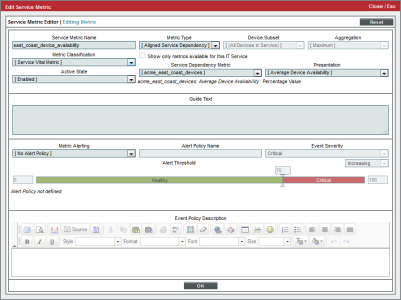
- We will create the metric east_coast_device_availability. This metric will point to the service dependency for acme_east_coast_devices and calculate the average device availability of the devices in that external IT Service policy. Because we defined acme_east_coast_devices as a service dependency, SL1 will use the availability metric defined in the acme_east_coast_devices IT Service policy and will use the list of devices in the acme_east_coast_devices IT Service policy.
- To create this metric, enter the following values in the Service Metric Editor modal page:
- Service Metric Name. Enter "east_coast_device_availability".
- Metric Classification. Specifies whether the metric will be displayed in the IT Service Summary page in widgets that display vital metrics. Select Service Vital Metric. The metric will appear in widgets that display vital metrics.
- Active State. Specifies whether SL1 should currently collect data for the metric and evaluate alerts for the metric. Select Enabled.
- Metric Type. Specifies the type of performance data you want to use for the metric. Select Aligned Service Dependency. Our metric will examine devices in a service dependency. Because the metric is based on a metric that is defined in another IT Service policy, the Device Subset, Aggregation, and Show only metrics available for this IT Service fields are not applicable and are grayed out.
- Service Dependency Metric. This field displays a list of service dependencies for the current IT Service policy. Select acme_east_coast_devices.
- Presentation. This field displays a list of all metrics in the acme_east_coast_devices IT Service policy . Select Average Device Availability.
- Select the button to save your new metric.
Defining west_coast_device_availability
- Go to the IT Service Editor page and select the sub-tab.
- Ensure that you are in Basic mode. If you see the sub-tab, you are not in Basic mode. Click on the button to toggle to Basic mode.
- Select the button.
- The Service Metric Editor modal page appears.
- We will create the metric west_coast_device_availability. This metric will point to the service dependency for acme_west_coast_devices and calculate the average device availability of the devices in that external IT Service policy. Because we defined acme_west_coast_devices as a service dependency, SL1 will use the availability metric defined in the acme_west_coast_devices IT Service policy and will use the list of devices in the acme_west_coast_devices IT Service policy
- To create this metric, enter the following values in the Service Metric Editor modal page:
- Service Metric Name. Enter "west_coast_device_availability".
- Metric Classification. Specifies whether the metric will be displayed in the IT Service Summary page in widgets that display vital metrics. Select Service Vital Metric. The metric will appear in widgets that display vital metrics.
- Active State. Specifies whether SL1 should currently collect data for the metric and evaluate alerts for the metric. Select Enabled.
- Metric Type. Specifies the type of performance data you want to use for the metric. Select Aligned Service Dependency. Our metric will examine devices in a service dependency.
NOTE: Because this metric is based on a metric that is defined in another IT Service policy, the Device Subset, Aggregation, and Show only metrics available for this IT Service fields are not applicable and are grayed out.
- Service Dependency Metric. This field displays a list of service dependencies for the current IT Service policy. Select acme_west_coast_devices.
- Presentation. This field displays a list of all metrics in the acme_west_coast_devices IT Service policy . Select Average Device Availability.
- Select the button to save your new metric.
Defining all_devices_availability
- Go to the IT Service Editor page and select the sub-tab.
- Select the button. Ensure that you are in Advanced mode. If you see the sub-tab, you are in Advanced mode.
- Select the button.
- The Service Metric Editor modal page appears.
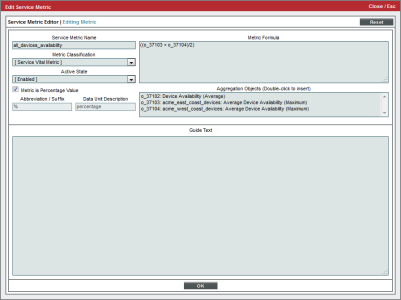
- We will create the metric all_devices_availability. This metric will use the aggregation objects from the metrics east_coast_device_availability and west_coast_device_availability to calculate the average availability for the sum of all devices on the east coast plus all the devices on the west coast
- To create this metric, enter the following values in the Service Metric Editor modal page:
- Service Metric Name. Enter "all_devices_availability".
- Metric Classification. Specifies whether the metric will be displayed in the IT Service Summary page in widgets that display vital metrics. Select Service Vital Metric. The metric will appear in widgets that display vital metrics.
- Active State. Specifies whether SL1 should currently collect data for the metric and evaluate alerts for the metric. Select Enabled.
- Metric is Percentage Value. If selected, the next two fields are populated automatically. If not selected, you can supply custom values in the next two fields.
- Abbreviation/Suffix. Populated automatically.
- Data Unit Description. Populated automatically.
- Metric Formula. Enter:
((o_XXXX + o_YYYY)/2)
Where XXXX is the number displayed for east_coast_devices in the Aggregation Objects field and YYYY is the number displayed for the west_coast_devices in the Aggregation Objects field. This formula tells SL1 to add the average for all devices in the east_coast_availability metric with the average for all devices in the west_coast_availability metric and divide the sum by two.
NOTE: If you don't want to manually enter the object ID for each aggregation object, you can add the object ID for by double-clicking on the aggregation object in the Aggregation Objects field.
- Guide Text. Leave blank.
- Select the button to save your new metric.
NOTE: We didn't define any custom alerts for this example IT Service policy. You could optionally define alerts in the tab.
Defining Key Metrics for the IT Service Policy
Key Metrics are the standard method for describing the status of an IT Service. Key Metrics allow you to quickly gauge the status of multiple IT Services, even if those IT Services include metrics that aggregate very different performance data. For example, you can define "health" for a remote backup service and also define "health" for an Internet bandwidth service, even though you would use different criteria to measure the health of those two services.
All IT Service policies define how SL1 should calculate the following Key Metrics for the IT Service:
NOTE: SL1 automatically includes a default metric with each IT Service policy. The default metric is called Average Device Availability. The Average Device Availability metric specifies that SL1 should aggregate the availability data for all the devices in the policy and calculate the average availability.
- Service Health. The health of an IT Service can be one of the five standard severity values: Healthy, Notice, Minor, Major, or Critical. By default, the Service Health metric is aligned with the Average Device Availability metric.
- Service Availability. The availability of an IT Service can be either available or unavailable. By default, the Service Availability metric is aligned with the same metric as Service Health, converting Critical Service Health to Unavailable and all other Service Health values to Available.
- Service Risk. The risk of an IT Service is a percentage value that indicates how close an IT Service is to being in an undesirable state. By default, the Service Risk metric is aligned with the same metric as Service Health, converting the threshold between Healthyand Notice Service Health to 100% and the healthiest possible value to 0%.
For more details on Key Metrics, see the main section on Key Metrics.
We will edit the definition of the Service Health metric. We will accept the default value of the other metrics.
To edit the definition of the Service Health key metric:
- If the IT Service Editor page is not still open, go to the IT Service Manager page (Registry > IT Services > IT Service Manager). Find the policy all_devices_availability. Select its wrench icon (
 ).
). - In the IT Service Editor page, select the sub-tab.
- In the bottom pane, you will see the three Key Metrics:
- To edit the Key Metrics for our example IT Service policy:
- Service Health. This Key Metric appears in the Health column in the IT Service Manager page (Registry > IT Services > IT Service Manager). Possible values are Healthy, Notice, Minor, Major, and Critical.
- From the drop-down list that appears above the Service Health Key Metric, select all_devices_availability. The Service Health Key Metric will now examine the metric all_devices_availability to determine the availability of the IT Service.
- From the drop-down list that appears to the right of the Service Availability Key Metric, select Decreasing.
- Service Availability. This Key Metric appears in the Availability column in IT Service Manager page (Registry > IT Services > IT Service Manager). Possible values are Available and Unavailable. For this example, the default values are accepted.
- Service Risk. This Key Metric appears as a percentage in the Risk column in the IT Service Manager page (Registry > IT Services > IT Service Manager). Possible values are 0% - 100%. For this example, the default values are accepted.
