Reference: Logging/Debugging
This document is a guide to troubleshooting collection issues with the Snippet Framework. The log message format is as follows:
<asctime> - <unique_id> - <log_location> - <log_level> - <context> <message>
asctime: Local time of the log message
unique_id: Unique ID for the execution of the Snippet Framework
log_location: Location of the logging statement
log_level: Level of log message (debug, info, etc)
context: (Optional) Information to help identify which ResultContainer produced the log message. Example context:
[a:<app_id>,d:<did>,c:<obj_id>,s:<step_name>]message: Message containing helpful information related to the execution
Some logs may provide contextually aware messages. They use shorthand to denote information in the header. The character definitions are as follows:
Character |
Named Value |
|---|---|
a |
Application ID |
d |
Device ID |
c |
Collection ID |
s |
Step Name |
When tracing a logfile, log messages may contain the collection name. If a name is not provided by the syntax, the Snippet Framework will auto-generate one based on the Collection Object ID and Device ID. The following format will be used:
<CollectionObjectID>.<DeviceID>
Available Logfiles
Errors can be logged to one of four log locations. Familiarity with these locations will enable you to debug most collection and development issues.
Device log messages are generated during the communication process. The Snippet Framework writes to the log if any issues are encountered.
Steps use a standard Python module for logging. Logs are stored in the filesystem. See details below for the location of these logs.
System logs are populated when the Snippet Framework throws an exception or does not operate as expected. Please contact ScienceLogic Support if you see any log messages in system logs.
The Snippet Framework logs show all pertinent information related to collection issues. For example, any data gaps not related to SIGTERM are logged to the Snippet Framework logs.
Logfile Locations
The following logs are generated during execution of the Snippet Framework:
# shows logs by device that execute a Dynamic Application
/var/log/em7/silo.log

# shows all logs sent by the ScienceLogic Libraries
/var/log/em7/sl1.log

# shows messages from the Framework and Module loggers
/var/log/em7/snippet_framework.log

# shows messages that are aligned to any log policy
/var/log/em7/snippet_framework.steps.log

# shows messages for a specific log policy.<policy_name> will be replaced with the name from the database:
/var/log/em7/snippet_framework.policy_<policy_name>.log
Logging Detailed or Specific Information
When a Dynamic Application is executed by SL1, the framework will create logs of the collection process internally in specific locations, as described above.
If you would like to see detailed information on the entire collection process, you can execute the process in debug mode, which lists the detailed steps, input, and output along with any errors encountered during the collection.
To log specific information to a collection object, or Dynamic Application on a device, you can set up a Log Policy that writes all of the information (not limited to errors only) to a specific file. For details on how to set up log policies, see the section Log Policy.
How to View the Log File
When a collection error occurs, the error message is logged to the log files described above Logfile Locations.
If you have configured a Log Policy, you can view the specified log file to see collection details and any exceptions encountered.
Note
The various log files are written at execution time. To view them, you can use a variety of Linux commands such as cat, nano, tail, and so on. For example:
tail -f /var/log/em7/log_file.log
Logging Detailed or Specific Information for Dynamic Applications
Logging for Dynamic Applications
When a Dynamic Application executes at its poll frequency, it automatically writes to logs only if any exceptions or errors occur. Alternatively, you can run Dynamic Applications in Dynamic Single/UI Debug mode, which runs the Dynamic Application such that you will see all of the process details. Additionally, if you want to see all collection logged, you can configure a Log Policy.
The example below is a template for the exception message when the Dynamic Application is run with the details of device id, collection name, and so on, which could be used to debug.
A blocking error occurred for the collection <collection_name> [<did>] and can no longer continue.
Executor: <executor>
Action Arguments: <action_arguments>
Data: <data>
Type: <type>
Exception: <exception>
In the next table, you can see the meaning for each entry on the exception template:
collection_name |
Collection Name |
did |
Device Id |
executor |
step where the error occurred |
action_arguments |
Configuration parameters for the step |
data |
Result information from the previous step |
type |
Type of the result |
exception |
Full StackTrace of the issue that stopped the collection |
The following location contains the log file for the Snippet Framework:
/var/log/em7/snippet_framework.log
Warning
Using the Dynamic Single option could cause permission errors at collection time if it is not used with the correct user. For more information, see How to Run a Single Dynamic Application in DEBUG Mode.
Log Policy
The Snippet Framework is designed to enable deeper analysis and provide information to help you solve possible issues. It gives you the capability to create dedicated logs that contain specific information from the collection process based on the configuration. For this purpose, the framework contains the Log Policy CLI, a command-line tool that allows CRUD (Create, Read, Update and Delete) operations for logging policies.
The Log Policy CLI tool is included with the Snippet Framework content library and can be run in any execution environment to which the library is aligned. The CLI tool can be executed by running the following command:
sudo -u s-em7-core /opt/em7/envs/<Env-GUID>/bin/python -m silo.low_code.cli log-policy
Note
It is important to run the command using the s-em7-core user to avoid
collection issues.
You can see the execution environment GUID in the Environment Manager in SL1, as follows:
System > Customize > ScienceLogic Libraries
Actions > Execution Environments
To better understand the Log Policy CLI tool, use the help option, as shown below:
sudo -u s-em7-core /opt/em7/envs/<Env-GUID>/bin/python -m silo.low_code.cli log-policy --help
Each command provides additional information when you use the help option after the command name, as shown below.
sudo -u s-em7-core /opt/em7/envs/<Env-GUID>/bin/python -m silo.low_code.cli log-policy <command> --help
The Log Policy CLI tool creates a dedicated log file for each log policy. The log file is written to the following location:
/var/log/em7/snippet_framework.policy_<policy_name>.log
Warning
Keep in mind that logging can affect collector CPU, memory, and disk performance. Be careful when creating a Log Policy that will match many different criteria.
Troubleshooting
When a collection is executed in debug mode, using the SL1 UI, or dynamic single, you can see the full collection process.
Dynamic Single is a tool that allows for direct execution of a Dynamic Application for a specific device. This script must be ran on the Collector where the Dynamic Application runs for the particular device.
To execute Dynamic Single, the following command must be run:
sudo -u s-em7-core /opt/em7/backend/dynamic_single.py <did> <app_id>
There are additional environment variables that you can specify when running a command. These options enable additional functionality of the framework for more in-depth debugging options.
DEBUG: Enables debug output if this value is set to True. Default: False
- SF_LOG_FULL_RESULT: Log the entire result after each step, instead of the
first 1024 characters. Please take care when using this option as it can greatly increase log sizes. Default: False
- SF_LOG_FULL_RC: The log message of a ResultContainer will contain all
characters instead of the first 1024 characters. Please take care when using this option as it can greatly increase log sizes. Default: False
To execute Dynamic Single with options, the following command must be run:
sudo -u s-em7-core <ENV VARS> /opt/em7/backend/dynamic_single.py <did> <app_id>
sudo -u s-em7-core DEBUG=1 SF_LOG_FULL_RESULT=1 /opt/em7/backend/dynamic_single.py <did> <app_id>
Dynamic Single Permission Error
If the execution environments were created with an invalid user, you could see an error related to permissions at execution time. This could happen if debug mode was executed with the dynamic single option incorrectly.
To solve this error, set the permissions manually using the following commands.
chown -R s-em7-core:s-em7-core /opt/em7/envs/<env_guid>
chown s-em7-core:s-em7-core /var/log/em7/snippet_framework*.log
Framework Exceptions and Solutions
This section describes the most common exceptions found when debugging collection issues or developing new snippet arguments. The section below describes what each exception means, along with possible troubleshooting methods to resolve them.
Note
The Snippet Framework PowerPack includes Dynamic Applications with some of the exceptions mentioned below and can be run as a reference.
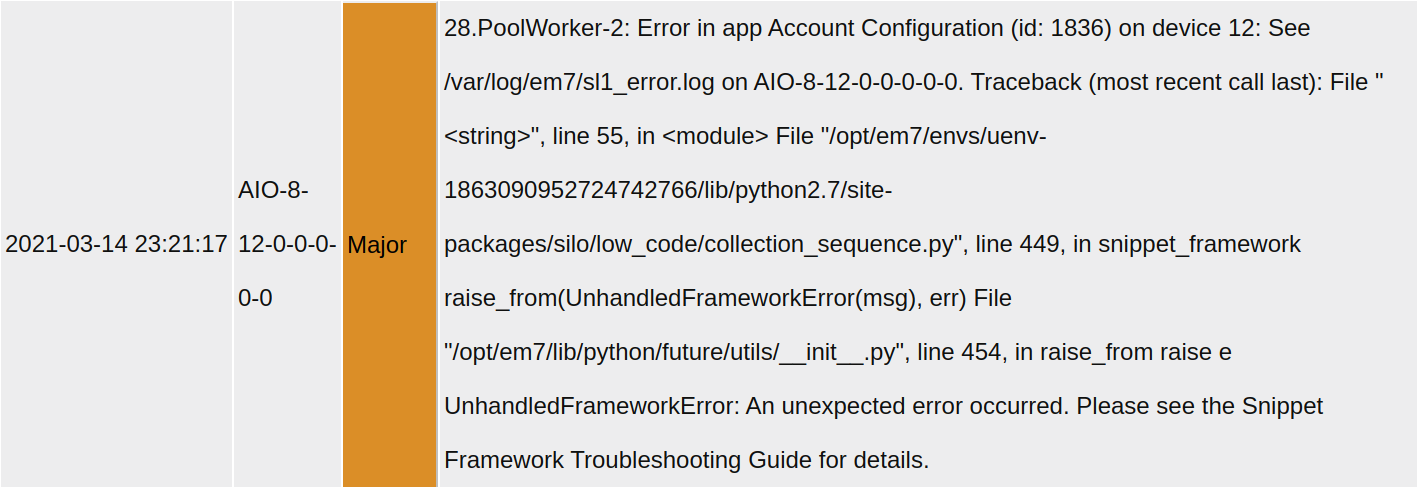
Unhandled Framework Error
When an unhandled error occurs in the Snippet Framework, collect the following logs from the collector, and contact ScienceLogic Support:
/var/log/em7/snippet_framework.log
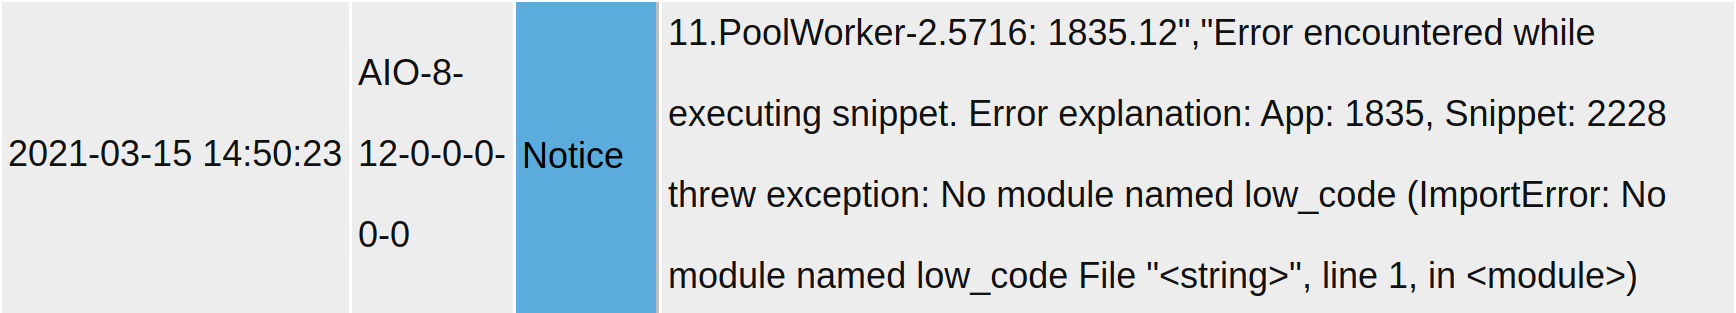
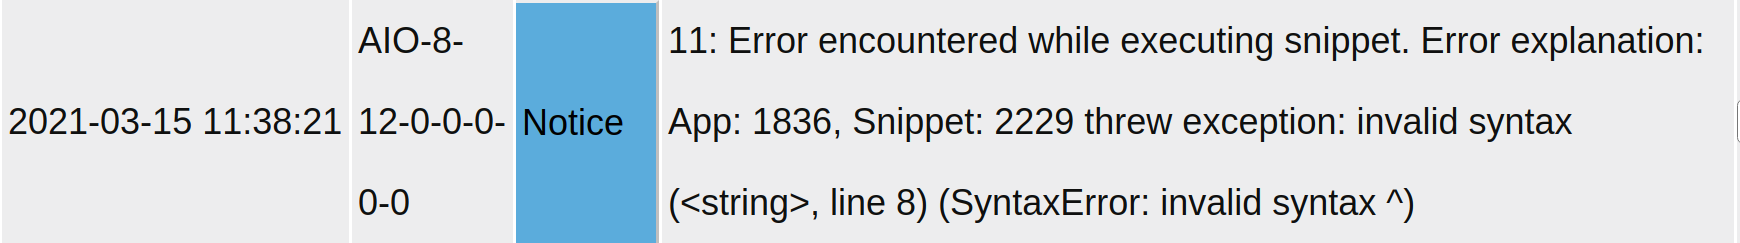
Snippet Errors
You may encounter some other errors and exceptions while using the Snippet Framework like the ones mentioned below.
By modifying the User Editable area, if there are some mistakes in the source code you may see a Syntax Error. To solve the error you should review the syntax of your custom code.
Another common error can be the Import Error. If this is the case, you should review and fix your execution environment.