The classic version of the Skylar One user interface includes several built-in (base) widget definitions that are designed to display most of the data in Skylar One.
This
NOTE: For descriptions of additional widgets, see
Common Fields
The following fields appear in all widget configuration panes:
- Widget Name. Enter a title for the widget. This title is displayed in the header that appears at the top of the widget. If you leave the default value of "{auto}" in this field, Skylar One will automatically generate a title for the widget based on what is currently being displayed in the widget.
- Widget Refresh Rate. Specify how frequently the widget will be automatically updated with new data. The choices are:
- Widget Default. The widget will refresh at its default refresh rate, as defined by the widget developer. You can view and edit the default refresh rate in the Classic Dashboard Widgets page (System > Customize > Classic Dashboard Widgets) by selecting the wrench icon (
 ) for a widget.
 - Auto-refresh disabled. The widget will not automatically refresh.
- 1 minute. The widget will automatically refresh every minute.
- 5 minutes. The widget will automatically refresh every 5 minutes.
- 10 minutes. The widget will automatically refresh every 10 minutes.
- 15 minutes. The widget will automatically refresh every 15 minutes.
- 30 minutes. The widget will automatically refresh every 30 minutes.
- 45 minutes. The widget will automatically refresh every 45 minutes.
- 1 hour. The widget will automatically refresh once an hour.
NOTE: For widgets with a Display Type option, if you do not select a display type for the widget, the dashboard automatically defaults to the first display type in the list of display types for that widget.
Snapshot/Single Series > Performance > (base) Leaderboard/Top-N
The Leaderboard/Top-N widget displays utilization statistics for a specific performance metric. The widget displays utilization for the devices with the highest or lowest values for the performance metric.
You can configure this widget to use a Custom URL that points outside Skylar One. The Custom URL field affects what is displayed when a user clicks on a data point in a graph. You can specify that an external URL is displayed. You can use variables to include information from Skylar One about the data point (like device name or interface ID) in the URL.
Configuring the Leaderboard/Top-N Widget
To configure a Leaderboard/Top-N widget, supply values in the following fields:
- Leaderboard Config. Select the devices or IT Services that will be included in the graph.
- Specify whether the graph will display devices with the highest (Top) or lowest (Bottom) utilization for the selected metric.
- Select the number of devices to include in the widget.
- Select whether the Average, Minimum, Maximum, Total, or Standard Deviation of the metric over the selected time period should be used.
- Select the time period over which the metric should be evaluated. Choices are Hour or 24 Hours.
- Use Timespan Context. If you select this checkbox, the time period over which the metric will be evaluated can be selected in another widget in the dashboard. For more information about user selections, see Creating a Classic Dashboard with Context Selectors.
- Ignore Min of 0. If you select this checkbox, the widget will not include devices with a value of zero for the selected metric over the selected time period.
- Collection Configuration. Select the metric for the widget using the following fields:
- Collection Type. Select the source of data that will be displayed in the widget.
- Collection. Select the type of metric that will be displayed in the widget. The options available in this field are based on your selection in the Collection Type field.
- Series. If applicable, select the specific metric to display in the widget. The options available in this field are based on your selection in the Collection field.
- Scale Prefix. Allows the user to select a unit scale for the widget's y-axis that is appropriate for their data series. If the user does not select a scale prefix, the widget will auto-scale the y-axis to an appropriate scale based on the values being displayed.
- Filter. For Dynamic Applications, the Filter field will match indexes and/or labels; for interfaces the Filter field will match ifName/ifDescr/ifAlias or interface tags; for monitors (port, CV, process, etc.), the Filter field will match the appropriate unique element of that monitor (port number, hostname, etc.).
- Device Filters. Select which devices will be evaluated for inclusion in the widget. You can limit the devices that will be included in the widget by selecting one or more Organizations, Device Groups, IT Services, Device Categories, or Device Classes.
NOTE: In widgets that allow you to filter the list of devices by the device class or device category, merged devices include special behavior. For merged devices, you can select either the device class or device category of the physical device or the device class or device category of the component device. If both device classes or device categories are selected, a merged device will appear twice in a single widget.
- If you select the Use Device-related Context, the list of devices that will be evaluated for inclusion in the widget can be selected in another widget in the dashboard. For more information about user selections, see Creating a Classic Dashboard with Context Selectors.
- Misc. Additional settings that affect the display of the graph.
- Use Old (Flash) Graphs. This feature is no longer supported.
- Color by Device State. If you select this checkbox, each graphical element in the dashboard will be colorized based on device state.
- Click/Link Behavior. Select how the widget will behave if a user selects a graphical element in the widget.
- Auto-Select Device/Service. When the dashboard is loaded the first entry in this widget is selected. The selected metrics control what is displayed in other widgets in the dashboard. For more information about user selections, see Creating a Classic Dashboard with Context Selectors.
- No Action (Disabled). No action is performed.
- Open Custom URL in Kiosk Mode. Use the selected entity to populate the variable(s) in a custom URL (specified in the Custom URL field). Display the populated custom URL in a kiosk window. In the Custom URL field, you must specify a URL to populate.
- Open Custom URL in New Window. Use the selected entity to populate the variable(s) in the custom URL (specified in the Custom URL field). Display the populated custom URL in a new window. In the Custom URL field, you must specify a URL to populate.
- Open in Kiosk Mode. A new window opens and displays a time-series performance graph in kiosk mode. In kiosk mode, the options that are normally available in the Device Performance page will not be displayed. For example, if a service provider is configuring a dashboard for their customers, kiosk mode will allow the customer to drill-down to the raw data for a metric without giving them full access to the Device Performance page.
- Open Performance Window. A new window opens and displays a time-series performance graph of the selected metric.
- Select Device/Service. The selected metrics control what is displayed in other widgets in the dashboard. For more information about user selections, see Creating a Classic Dashboard with Context Selectors.
- Custom URL. Specify the custom URL that you want to populate with the Open Custom URL selection.
- deviceObject. Contains attributes associated with the selected device.
- interfaceObject. Contains attributes associated with the selected interface.
- serviceObject. Contains attributes associated with the selected IT service.
- timespan. Contains attributes associated with the selected timespan.
- {timespan.start}
- {timespan.end}
- {timespan.duration}
- id. The numeric ID of the device.
- hostname. The hostname of the device discovered via hostname discovery.
- ip. The IP address Skylar One uses to communicate with the device.
- name. The name of the device.
- organization. The organization of the device. If you use this attribute, you must specify the organization attribute that you want to use. If you use this attribute, you must use the following variable syntax:
- Any Base or Extended Custom Attributes that have been added to your Skylar One system.
- device. The device with which the interface is associated. If you use this attribute, you must specify the device attribute that you want to use. If you use this attribute, you must use the following variable syntax:
- organization. The organization with which the interface is associated. If you use this attribute, you must specify the organization attribute that you want to use. If you use this attribute, you must use the following variable syntax:
- ifIndex. The SNMP index associated with the interface.
- ifDescr. The description of the interface.
- alias. The alias of the interface.
- name. The name of the interface.
- service_id. The numeric ID of the IT service.
- service_name. The name of the IT service.
- company. The name of the organization.
- billing_id. The billing ID of the organization.
- crm_id. The CRM ID of the organization.
You can include one or more variables in a custom URL. You can use the variables in place of a value from Skylar One. Variables are surrounded in curly braces.
You can click the wrench icon (![]() ) in the Custom URL field to open the field in a larger window. This window includes a Token Builder that enables you to build variables into the custom URL. When you select a series of tokens in the Token Builder pane, the corresponding variables are inserted into the custom URL.
) in the Custom URL field to open the field in a larger window. This window includes a Token Builder that enables you to build variables into the custom URL. When you select a series of tokens in the Token Builder pane, the corresponding variables are inserted into the custom URL.
The variables use the syntax:
{X.Y}
where X is one of the following entities:
Y is an attribute for that entity. For all entities except timespan, the available attributes are the attributes from the API that do not return lists or links (i.e. single fields). For timespan, you can specify the following attributes:
The following are the most commonly used device attributes:
{context.deviceObjects.<entity index>.organization.<organization attribute>}
The following are the most commonly used interface attributes:
{context.interfaceObjects.<entity index>.device.<device attribute>}
{context.interfaceObjects.<entity index>.organization.<organization attribute>}
The following are the most commonly used IT service attributes:
The following are the most commonly used organization attributes:
For example, a custom URL could be:
http://my.website.com/{deviceObject.id}
where {deviceObject.id} is the device selected in another widget.
- Legend Label Options. Specifies the information that is included in the legend for the widget. Choices are:
- Element Names. Displays the names of the device(s) or IT Service(s) in the legend.
- Index Label. If you selected a performance Dynamic Application in the Collection field, you use the Index field to select the data series to display in the widget. If you select the Index Label checkbox, the widget includes the name of the index in the legend.
- Title Label Options. Each selected option will appear in the title of the widget. Choices are:
- Window. Displays the value from the Widget Name field.
- Type. Displays the value from the Type field.
- Collection Type. Displays the value from the Collection Type field.
- Collection Name. Displays the value from the Collection field.
- Series Name. Displays the value from the Series field.
- Aggregation. Displays the value from the Aggregation field.
- Axis Label Options. Select optional methods for labeling information on the X-axis. Choices are:
- Units. If this check box is selected, numbers along the X-axis include units of measurement; otherwise, units of measurement are not included.
- Display Type. Select how the information will be displayed in the widget:
- Pie. Widget will be displayed in a pie graph. Displays each event as percentage of total events. Slice color represents the severity of the event.
- Column. Widget will be displayed in a bar graph. Displays number of occurrences on the y-axis. On the x-axis, displays each event in its own colored vertical bar. Bar color represents the severity of the event.
- Horizontal Bar. Widget will be displayed in a horizontal bar graph. Displays number of occurrences on the x-axis. On the y-axis, displays each event in its own colored horizontal bar. Bar color represents the severity of the event.
- Radar. Displays a multi-pointed, color-coded polygon or circle. Users determine if the radar is a polygon or circle by selecting Arc or Line in the Grid Lines field. Each point on the polygon or circle represents an event. The number of event instances is measured by the concentric rings. The number value of each concentric ring increases from center to perimeter.
- Spreadsheet. Widget will be displayed as a spreadsheet. Displays each event in its own row. Each event has its own column, with number of occurrences. Clicking on the event name displays the Event Console page, with only the occurrences of the selected event displayed.
- Scoreboard. For the selected events, displays each event name and the number of occurrences for each event. Events are ordered by severity, with critical first. Display is tally-style, in large format for easy viewing.
- Display Options. Specify how the graph will be formatted.
- Chart minimum. You can accept the minimum value that Skylar One determines, usually the lowest collected value or lowest calculated value (Automatic), or you can specify a minimum value (Fixed Value).
- Chart maximum. You can accept the maximum value that Skylar One determines, usually the highest collected value or highest calculated value (Automatic), or you can specify a maximum value (Fixed Value).
- Axis Scaling. You can select either linear or logarithmic scaling for the widget.
- Threshold value. You can select Enabled and then enter a threshold value in this field. Skylar One will then include a heavy line in the graph that indicates the threshold.
- Severity ranges. Select whether a low value (Increasing) or a high value (Decreasing) indicates a healthy state.
- Severity Slider. Use the sliders and/or supply values in the slider fields to define the range of values at which the metric is in a healthy, normal, minor, major, and critical state. If you select Gauge in the Display Type field, you can also define the minimum value and maximum value that will be displayed in the gauge.
Viewing the Leaderboard/Top-N Widget
The Leaderboard/Top-N widget displays utilization statistics for a specific performance metric. The widget displays utilization for the devices with the highest or lowest values for the performance metric.
If the Leaderboard/Top-N widget has been defined with the Use Device-related Context checkbox selected, and a selected Device Group or selected IT Service does not contain any devices, the Leaderboard/Top-N widget will display a message saying the context contains no devices.
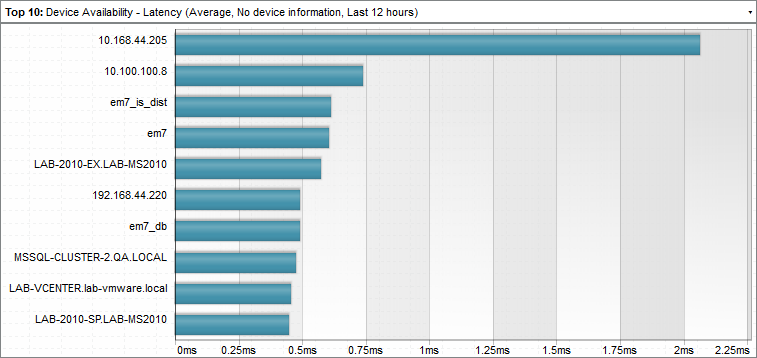
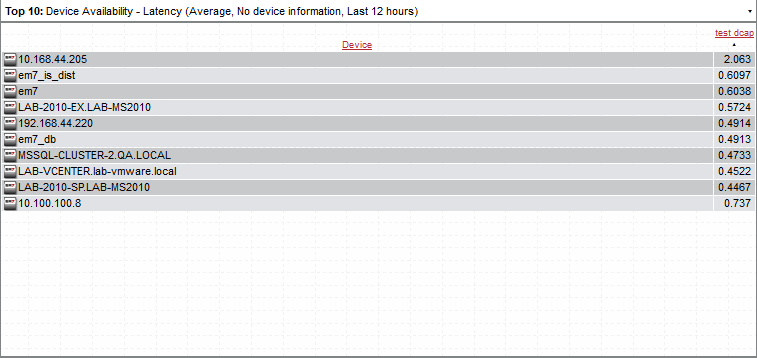
For example, an instance of the Leaderboard/Top-N widget that is configured to display the 10 devices with the highest average latency in a bar graph looks like this:
The Leaderboard/Top-N widget can be configured to display:
- Any performance metric collected by Skylar One.
- The devices with the highest or lowest minimum, maximum, average, total, or standard deviation for the selected performance metric during the last frequent normalization period (5 - 30 minutes), hourly normalization period, or daily normalization period.
- 5, 10, 15, 20, 25, 30, 35, 40, 45, or 50 devices. The selection of devices that will be evaluated for highest or lowest utilization can be limited to only devices in specific organizations, device groups, device categories, or device classes.
The following table lists the required Access Hooks (in addition to the "Dash:View" and "Dash:View Shared" Access Hooks) that users need to view specific types of data in the Leaderboard/Top-N Widget:
| Data | Required Access Hook IDs | Required Access Hook Names |
| Availability | DEV_VIEW | Dev:View |
| Click Actions for Devices | DEV_PERF_REPORT_VIEW | Dev:Performance Graphs |
| Click Actions for IT Services | ITS_SERVICE_VIEW | IT Service: View |
| Content Verification | DEV_VIEW | Dev:View |
| DLAG | DEV_VIEW | Dev:View |
| DNS Policies | N/A | N/A |
| Dynamic Applications |
DEV_VIEW SYS_DYN_APP_MANAGEMENT |
Dev:View System>Manage>Applications |
| E-mail Round Trip | DEV_VIEW | Dev:View |
| File Systems | DEV_VIEW | Dev:View |
| Interfaces | DEV_VIEW | Dev:View |
| IT Services | DGRP_VIEW | DevGroup:View |
| Port Monitors | DEV_VIEW | Dev:View |
| Process Monitors | DEV_VIEW | Dev:View |
| Transaction Verification | DEV_VIEW | Dev:View |
| Video Performance | DEV_VIEW | Dev:View |
| Vitals | DEV_VIEW | Dev:View |
| Windows Service Monitors | DEV_VIEW | Dev:View |
The Leaderboard/Top-N widget can be configured to display in one of the following formats:
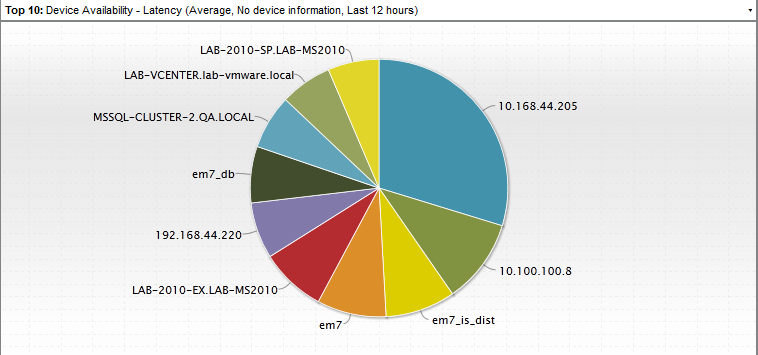
- Pie Chart
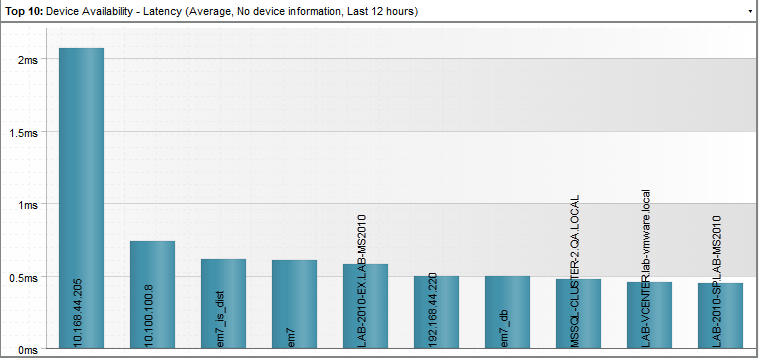
- Column graph
- Horizontal Bar graph
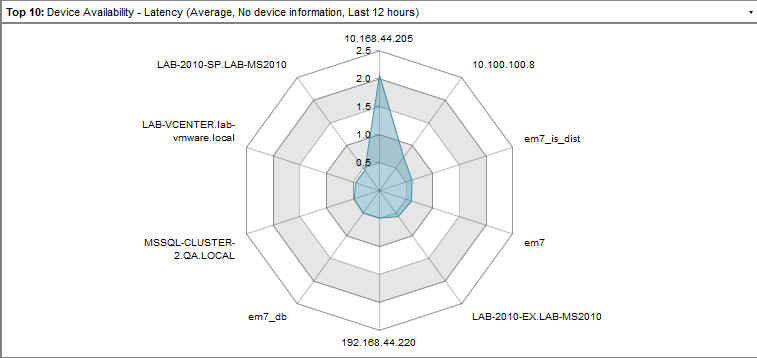
- Radar chart
- Spreadsheet
- Scoreboard
Depending on the configuration of the widget, selecting a metric performs one of the following actions:
- The Device Performance page will open in a separate window with the graph for the selected metric displayed.
- Your selection will define what is displayed in other widgets in the dashboard. You can select multiple elements by holding down the key (or on Apple computers).
- A custom URL will open in a separate window.
- No action will be performed.
Custom > Tools > (base) Context Iframe Content
The Context Iframe Content widget accepts a URL as input and then displays the page specified by the URL. The URL can include device variables that are populated by the device context, such as when you select a device in another widget.
Configuring the Context Iframe Content Widget
To configure the Context Iframe Content widget, supply a value in the following field:
- Context Iframe URL. Enter the URL to display in the Iframe widget.
- You can enter a relative or absolute URL.
- You can use HTTP or HTTPS.
- You can include variables that specify attributes of a device, interface, IT service, or organization selected in another widget.
Click the wrench icon (![]() ) in the Context Iframe URL field to open the field in a larger window. This window includes a Token Builder that enables you to build variables into the URL. When you select a series of tokens in the Token Builder pane, the corresponding variables are inserted into the URL.
) in the Context Iframe URL field to open the field in a larger window. This window includes a Token Builder that enables you to build variables into the URL. When you select a series of tokens in the Token Builder pane, the corresponding variables are inserted into the URL.
Variables in the Context Iframe URL field are specified in the following format:
{context.<entity type>.<entity index>.<attribute>}
The following are valid entity type values for variables:
- deviceObjects. Contains attributes associated with the devices selected in another widget.
- interfaceObjects. Contains attributes associated with the interfaces selected in another widget.
- organizationObjects. Contains attributes associated with the organizations selected in another widget.
- serviceObjects. Contains attributes associated with the organizations selected in another widget.
The following are valid values for specifying an entity index in variables:
- first. The attribute used to populate the variable will be from the first entity a user selected in another widget.
- last. The attribute used to populate the variable will be from the last entity a user selected in another widget.
- An integer value that specifies an index in the list of selected devices.
For example, to use an attribute from the last device selected by the user in another widget, you would use the following variable, substituting the attribute name where indicated:
{context.deviceObjects.last.<attribute>}
The attributes that are available for devices, interfaces, IT services, and organizations are the same as the non-list attributes available for the equivalent ScienceLogic API resource. For example, the attributes available for devices are the same as the attributes for a /device resource in the API. Non-list attributes are attributes that have single assigned value; for example, the child_devices attribute for devices cannot be used as it is a list that can include multiple values.
The following are the most commonly used device attributes:
- id. The numeric ID of the device.
- hostname. The hostname of the device discovered via hostname discovery.
- ip. The IP address Skylar One uses to communicate with the device.
- name. The name of the device.
- organization. The organization of the device. If you use this attribute, you must specify the organization attribute that you want to use. If you use this attribute, you must use the following variable syntax:
- Any Base or Extended Custom Attributes that have been added to your Skylar One system.
{context.deviceObjects.<entity index>.organization.<organization attribute>}
The following are the most commonly used interface attributes:
- device. The device with which the interface is associated. If you use this attribute, you must specify the device attribute that you want to use. If you use this attribute, you must use the following variable syntax:
- organization. The organization with which the interface is associated. If you use this attribute, you must specify the organization attribute that you want to use. If you use this attribute, you must use the following variable syntax:
- ifIndex. The SNMP index associated with the interface.
- ifDescr. The description of the interface.
- alias. The alias of the interface.
- name. The name of the interface.
{context.interfaceObjects.<entity index>.device.<device attribute>}
{context.interfaceObjects.<entity index>.organization.<organization attribute>}
The following are the most commonly used IT service attributes:
- service_id. The numeric ID of the IT service.
- service_name. The name of the IT service.
The following are the most commonly used organization attributes:
- company. The name of the organization.
- billing_id. The billing ID of the organization.
- crm_id. The CRM ID of the organization.
For example, suppose you want to display the Device Properties page for the last selected device. In our test system, the URL for the Device Properties page for the device with a device ID of "201" is:
http://10.0.2.59/em7/index.em7?exec=device_details&did=201
We could then edit this URL to specify that instead of the device with the device ID 201, we want to display the Device Properties page for the last selected device. We would specify the following:
http://10.0.2.59/em7/index.em7?exec=device_details&did={context.deviceObjects.last.id}
Viewing the Context Iframe Content Widget
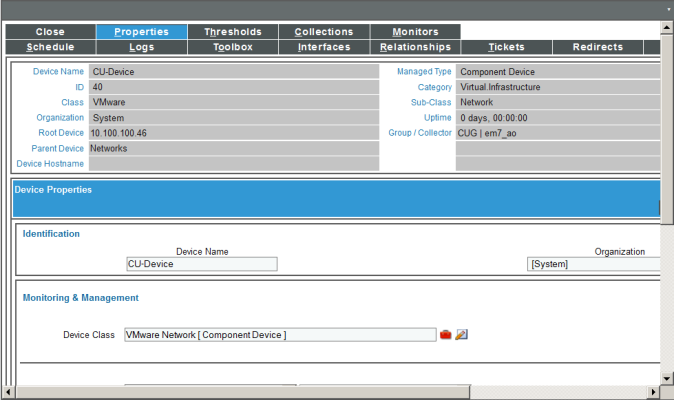
If you specified that you want to view the Device Properties page for the last selected device, the Context Iframe Content widget might look like this:
