![]()
This
NOTE: For Skylar One to create CDP maps, you must first enable the Enable CDP Topology checkbox on the Behavior Settings page (System > Settings > Behavior). Similarly, if you want Skylar One to create LLDP maps, you must enable the Enable LLDP Topology checkbox on the Behavior Settings page.
Use the following menu options to navigate the Skylar One user interface:
- To view a pop-out list of menu options, click the menu icon (
 ).
). - To view a page containing all of the menu options, click the Advanced menu icon (
 ).
).
Viewing the List of Maps
To navigate to the Maps page, click the Maps icon (![]() ).
).
The Maps page displays a list of created maps. By default, the maps listed on the Maps page are sorted alphabetically by Name. If you prefer, you can change the sorting preferences and Skylar One will recall those changes the next time you return to the Maps page.

You can filter the items on this inventory page by typing filter text or selecting filter options in one or more of the filters found above the columns on the page. For more information, see
You can adjust the size of the rows and the size of the row text on this inventory page. For more information, see the section on
You can search for one or more maps by typing search criteria in the Search field at the top of the Maps page. After you create a search, you can save that search to use later. For more information,
To rearrange the columns in the list, click and drag the column name to a new location. You can adjust the width of a column by clicking and dragging the right edge of the column. For more information about editing and adding columns, see
For each map, the Maps page displays the following information:
-
Name. The name of the map. Click the name hyperlink to view the map.
-
Description. The description of the map. This will display any text entered in the Map Description field when editing the map. For more information, see Changing the Design of a Map
Viewing a Map
To view a map, go to the Maps page (![]() ) and click the name of the map from the Maps page.
) and click the name of the map from the Maps page.
You can filter the items on this inventory page by typing filter text or selecting filter options in one or more of the filters found above the columns on the page. For more information, see

The Map detail window includes the following user interface features:
- A
- An
- A
- A
The interactive legend and the Details pane can be hidden to allow more space for the viewing pane.
Maps support custom Skylar One themes, and the theme colors will be reflected in the maps, including dark mode themes.
Navigation Bar
The blue navigation bar at the top of a Map window includes the following:
- Interactive Legend button (
 ). Opens the Interactive Legend for this map.
 - Map Name. The name of the current map. You can change the name by clicking the current name or the pencil icon (
 ) and typing a new name.
 - Private/Public/Share. Select the visibility for a map that you created. The default for a new map is Private. Your options include:
- Private. The map is viewable only to you.
- Public. The map can be shared with users in all organizations that are using Skylar One.
- Specific Organizations. The map can be viewed only by the organizations that you search for and select from this menu.
- . Click this button to edit the "seed query" (the initial search that the map creator used to find nodes for the map). For more information, see Editing a Query for a Map.
- . Click this button to add another node to the map. Nodes can represent Devices, Topology Elements, and Services. For more information, see Adding a Node to a Map.
- Search. Type some or all of a node name in this field to search for specific nodes on the current map. Nodes that match the search criteria are highlighted in the map. Delete the search text to clear the search.
- Selections (
 ). After you select one or more nodes, you can click this button to show the details of that node or nodes in a Details pane to the right of the map. If you have more than one node selected, click the down arrow icon to select the node for which you want to view the Details pane. You can view the status for that node and the events associated with that node on the Details pane. For more information, see Viewing Node Details.
The number in the red circle on Selections shows how many items are currently selected. If you selected more than one node, use the and buttons at the bottom of the Details pane to view properties for the other nodes.
If you select two device nodes, you can click (![]() ) and select Create Relationship to create a relationship between those two device nodes in the map. For more information, see Creating a Relationship Between Two Devices.
) and select Create Relationship to create a relationship between those two device nodes in the map. For more information, see Creating a Relationship Between Two Devices.
- Settings (
 ). Click this drop-down to select from the following options:
- Design. Opens the Design pane, where you can edit the appearance of the map. For more information, see Changing the Design of a Map.
- Filters. Opens the Filters pane, which lets you select and deselect filters that affect which nodes (devices and services) and links appear in your map. For more information, see Changing the Filters for a Map.
- Selection. Opens the Details pane for a selected node.
- Reset (
 ). Click to revert any unsaved changes you have made to your map.
 - Save (
 ). Click to save any changes you have made to your map.
 - Save Copy (
 ). Click to make a copy of the current map with a new name.
Interactive Legend
The interactive legend appears on the left-hand side of a Map window when you click the button (![]() ) at top left. By default the interactive legend is hidden.
) at top left. By default the interactive legend is hidden.
When you select a node on the viewing pane of the map with the interactive legend open, the legend shows a detailed view of that node and the immediate connections for that node. The legend gives you a quick close-up of the hierarchy and context for the selected node.
In the example below, the selected IT Service is connected to a parent Business Service and two device services, which are monitoring 15 Devices:

If you click and drag the map to move it, when you drag the mouse over the interactive legend, the map will stop moving.
To view details about a different node in the same map, select that node in the viewing pane, or select a different node to focus on in the interactive legend. The interactive legend updates with the details for the selected node.
If you moved the nodes on the interactive legend, you can click the button to return the nodes to their original grouping. To close the interactive legend, click the button (![]() ) again.
) again.
Viewing Pane
Under the blue navigation bar is the viewing pane, which is the main viewing area for the map. Use the following buttons to manipulate the map on the viewing pane:
![]() : Zoom in on the map.
: Zoom in on the map.
![]() : Zoom out on the map.
: Zoom out on the map.
![]() : Fit all elements of a map into the viewing pane.
: Fit all elements of a map into the viewing pane.
![]() : Center all selected elements of a map in the viewing pane.
: Center all selected elements of a map in the viewing pane.
If you selected Show Legends on the tab ( ) of the Design pane, you will also see a colored legend to the left of the buttons that show either the status colors for the nodes, or the link types for the map. For more information, see Changing the Design of a Map.
The viewing pane displays the following two types of graphical elements:
- Nodes that represent Devices, Topology Elements, and Business Services defined in Skylar One. The shape of the node represents its type, and the color of the outline specifies the current state of the node:
- Devices are represented by squares:

- Services, such as business services, IT services, or device services, are represented by hexagons:

When you select a node, the border for the node icon thickens and brightens, and any nodes directly connected to that node are also highlighted. Any nodes not directly connected to the selected node appear in a less bright color than their usual color. Also, if you enable history tracking, any nodes that you previously selected will also have a slightly brighter border. For more information about history tracking, see Changing the Design of a Map.
- Links are lines that represent the relationships and hierarchies between nodes:
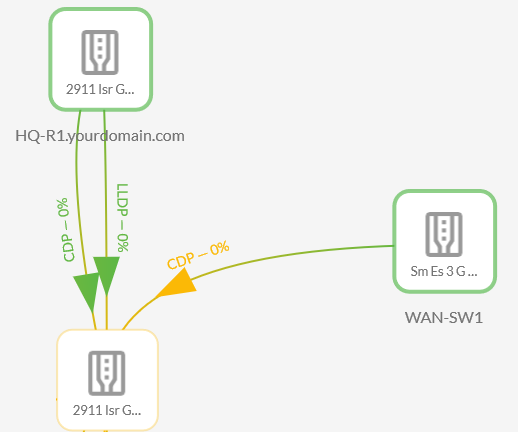
For LLDP and CDP relationships, the links can include a label describing the relationship as well as a percentage that represents the network usage for the network interfaces on the devices.
Skylar One automatically updates the map as new nodes are discovered. Skylar One also updates the map with the latest status and event information.
The Details Pane
There are a variety of ways you can view the properties or metadata for a specific node on a map.
To enable the ability to hover over a node in a map to view metadata:
- From a Map window, click Settings () and select Design.
-
On the Nodes menu, enable the Show Details on Hover option. When you hover over a node in the viewing pane of a Map window, a pop-up Details pane appears with the metadata for that node:


If you do not have edit rights for maps, or if the map is in a dashboard or a Device Investigator page, hover is on by default. Also, if you select this option, it is not retained on the Map window when you save or close this map.
To view metadata in the Details pane if the hover option is not enabled:
-
Double-click a node on a map. You can also select the node, click Settings (
), and select Selection. The metadata displays in a new Details pane to the right of the map:

- To close the Details pane, click the Close icon (
 ) to the right of the node name at the top of the pane.
The following items appear in the Details pane to the right of the map:
-
Name. Displays the name of the node. You can click the name of the node to open the Investigator page for that node in a new browser tab.
To avoid losing any edits you made to the map, click the button before clicking the device name and leaving the Map window.
- Target icon (
 ). Select a device or service and then click the Target icon to create a targeted map for the selected node. A new Map window opens, and the map has a default Expansion Depth of 1. This feature is useful if you want to focus on a small portion of a very large or detailed map. To customize the new map, see Changing the Appearance of a Map.
 -
tab (
 ). Displays the name, state, organization, and other "metadata" for the selected node, including any Custom Attributes you created for the node. For a Service node, the latest Availability, Health, and Risk values appear on this tab. The pop-up Properties pane displays a similar set of metadata.
When a Service node has a Risk of 0%, the value displays as a hyphen ("-") instead of a "0" on the Properties pane.
- tab (
 ). Displays a list of events associated with the node.
 - tab (
 ). Displays processes for a device on the map, where available. Select a device to see the process information for that device.
 - tab (
 ). Displays link information when you select a link on the map.
If you selected more than one node, use the and buttons at the bottom of the Details pane to view properties for the other selected node or nodes.
Repositioning Nodes on a Map
You can drag and drop nodes to reposition them on the map to make viewing and managing them easier. When you reposition a node, it retains its links to other nodes.
You can also rearrange a map in the following ways:
- To move the entire map, click in any spot in the background, click and hold down the mouse button, and drag the mouse to the new location.
- To zoom in and out, use the wheel of your mouse or two fingers on a Trackpad. You can also click the Zoom In (
 ) and Zoom Out (
 ) icons.
 - To move a node, drag and drop the node to the new location.
To save the new layout:
-
From the Map page, click Settings (
) and select Design. The Design pane appears:

- Click the tab (
 ) on the Design pane and enable the Fixed Current Nodes in Place toggle to save the layout when your are done moving the nodes.
 - After you finish moving the map and its nodes, or zooming in or out, click Save () to save the map. The next time you open the map, the nodes will display in the same layout.
Viewing the Classic Maps Page
In previous versions of Skylar One, the maps on the Classic Maps page (Maps > Classic Views, formerly the tab in the classic user interface) were rendered using Flash. Because Flash was deprecated at the end of 2020, the maps on the Maps and Classic Maps pages in Skylar One are rendered using HTML5 instead of Flash.
Viewing Classic Maps in Skylar One
-
Go to the Classic Maps page (Maps > Classic Maps).
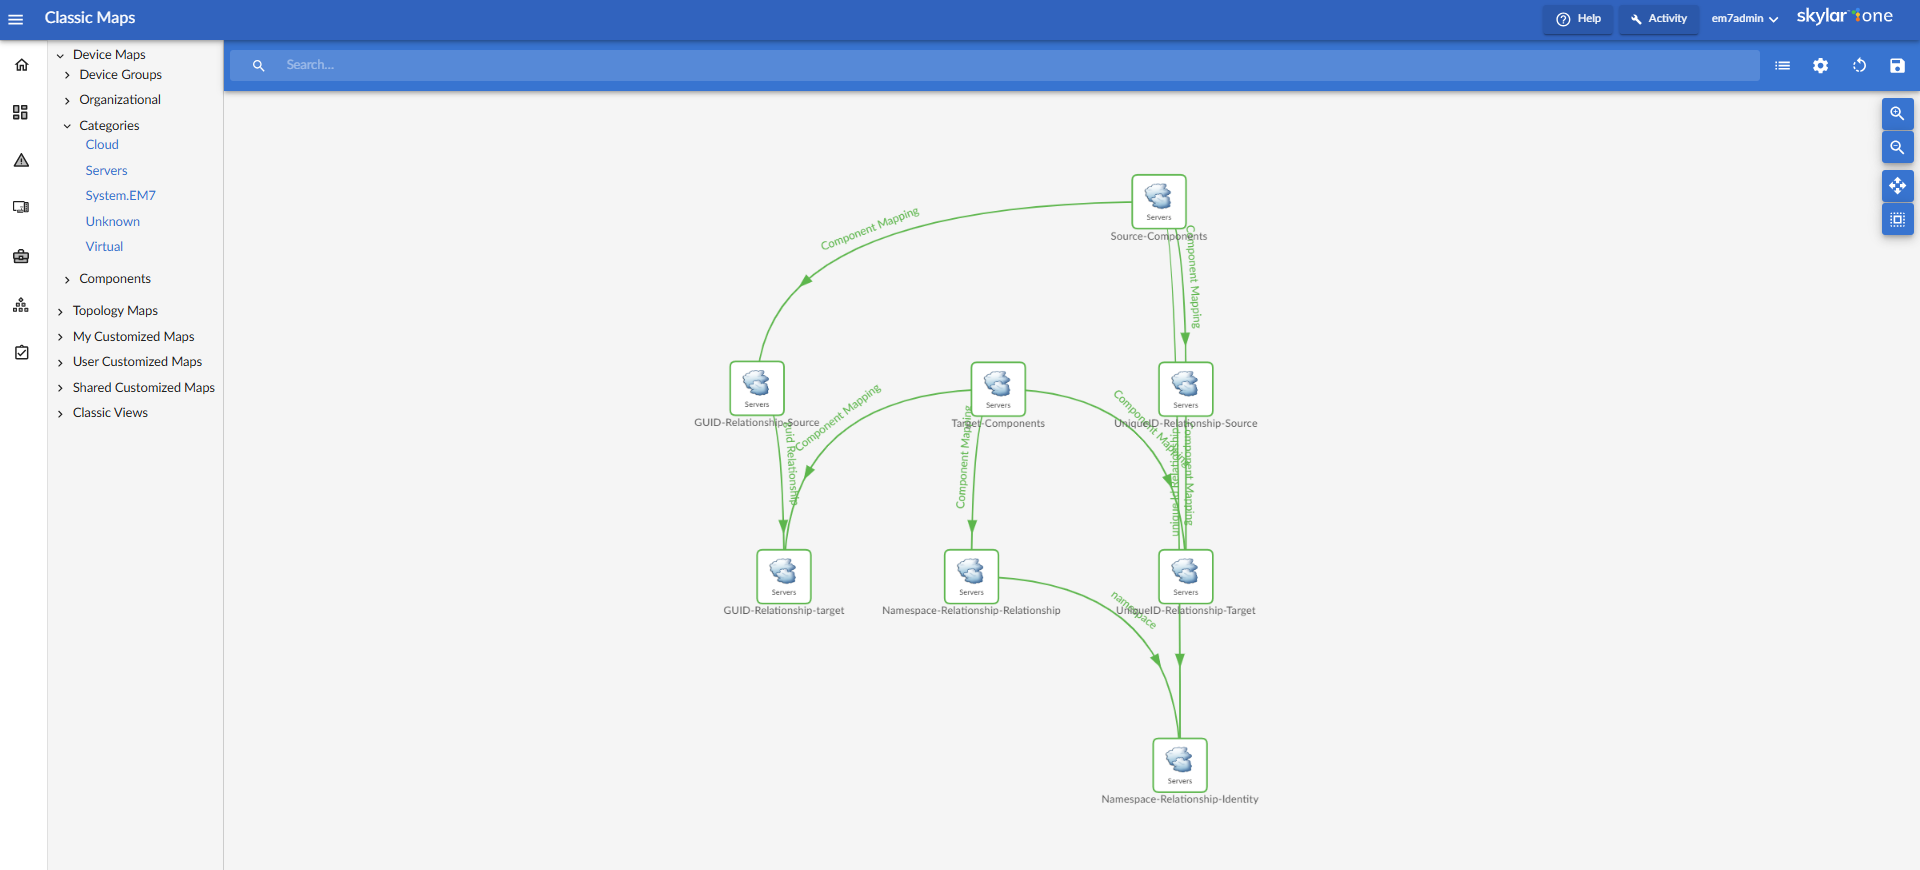
-
Expand the section for the classic map you want to view, and select a map. The navigation on this page is the same as the tab in the classic user interface. The following is an example of an HTML5-based classic map:

- To view the properties for a node on a classic map, hover over that node.
- By default, the state of a node is based on device state, not interface state. To specify whether relationships between devices should use the status color of the device on each end or the status color of the network interface on each end, select the link between the devices, click Settings (), select Design, click the tab, and edit the options for Edge Status Color.
-
To customize the classic map, see Changing the Appearance of a Map.
Some features that you can use with the "new" maps on the Maps page might not be available for a classic map. The same restrictions that belonged to classic maps on the tab of the classic user interface are enforced on the Classic Maps page.
Viewing Maps in the Classic User Interface
The following types of classic maps are available in HTML5:
- All relationship types
- All existing map layouts
- All previously created map images, icons, and shapes
- Support for device groups
In addition, the classic maps also display in HTML5 in the following locations in the classic user interface:
- Classic Dashboards (contextual and non-contextual)
- Device Dashboards
- Device Topology
For additional information about working with classic maps in the classic user interface, see the