Devices > Blackberry: Top-N Performance Dynamic App
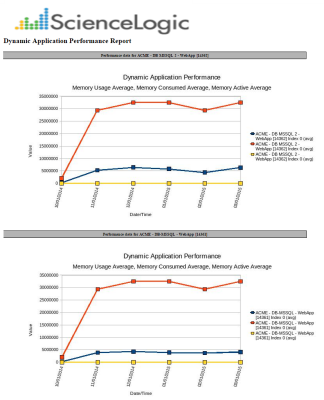
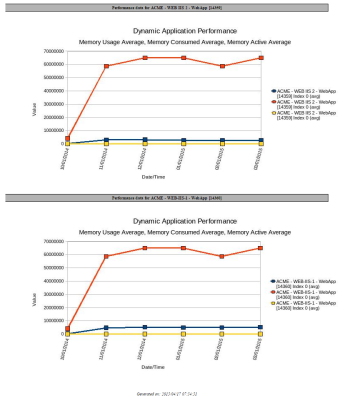
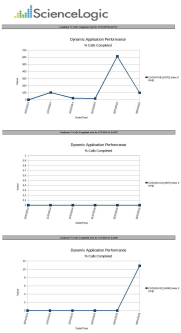
This report displays the collected data from the specified Dynamic Application and Presentation Object on each selected device. You can customize the output of the report by selecting devices by group or organization, and selecting the time span of the report.
The following input options are available for this report:
- Select By: Select the devices that will appear in the report. The following input elements appear in this component:
- Org/Device; Group/Device. Your selection will have an affect on the fields described below.
- Org/Device. When selected, you have the option to select all, multiple, or individual organizations, then you can optionally select specific devices in those organizations.
- Group/Device. When selected, you have the option to select all, multiple, or individual device groups, then you can optionally select specific devices in those organizations.
- Select individual devices. Select this checkbox if you would like to select the individual Devices to include in the report.
- Dynamic Application. Select a Dynamic Application to include in the report. Your selection will change the values displayed in the Presentation Object field.
- Collection Objects. Select a collection object associated with the Dynamic Application.
- Categories. By default, all device categories will be included in the report. Click the Select individual categories checkbox to select one or more device categories.
- Top-N-Selector. Select the top devices based on average performance or maximum performance.
- Report Span. Specify a Daily, Weekly, or Monthly span to include in the report.
- Starting. Use the Year, Month, and Date fields to specify a Start Date for the report. The Skylar One (formerly SL1) system will use data from that date as the starting point of the report.
- Duration. Specify the duration for the report, from 1 month to 36 months. The Skylar One system will use data from the Starting date as the start point of the report and data from the last day of the Duration as the ending point of the report.
- Timezone. Specify the timezone to use for date and time values in the report. Specify the timezone by number of hours offset from UTC.
This description covers the latest version of this report as shipped by ScienceLogic. This report might have been modified on your Skylar One system.
Devices > Blackberry: Top-N Report Vitals
This report displays the collected Vitals data from the specified Dynamic Application on each selected device. You can choose to report on the top CPU, Memory, Swap, Availability, and Latency values for the selected devices. You can further customize the output of the report by selecting devices by group and category, and selecting the time span of the report.
The following input options are available when generating the report:
- Device Selection: Select the devices that will appear in the report. The following input elements appear in this component:
- All devices. Select this checkbox if you want all devices in the system to be included in this report.
- Organizations. If the All devices checkbox is unselected, select multiple or individual Organizations. The report will contain only the devices in the organizations you select. You can further reduce the list of devices to include on the report by specifying devices from the organizations you select, by selecting the Select individual items checkbox.
- Select individual devices. If the All devices checkbox is unselected, the Select individual devices checkbox is available. Select this checkbox if you would like to select the individual devices to include in the report.
- Devices by Organization. If the Select individual devices checkbox is selected, you can select multiple or a single device in the organization(s) selected about to include in the report.
- Device Group Selector. Select one, multiple, or all device groups to include in the report.
- Device Categories. Select one, multiple, or all device categories to include in the report.
- Top-N-Selector. Select the top devices based on average performance or maximum performance. Your options include CPU, Memory, Swap, Availability, and Latency.
- Report Span. Specify a Daily, Weekly, or Monthly span to include in the report.
- Starting. Use the Year, Month, and Date fields to specify a Start Date for the report. The Skylar One system will use data from that date as the starting point of the report.
- Duration. Specify the duration for the report, from 1 month to 36 months. The Skylar One system will use data from the Starting date as the start point of the report and data from the last day of the Duration as the ending point of the report.
- Timezone. Specify the timezone to use for date and time values in the report. Specify the timezone by number of hours offset from UTC.
This description covers the latest version of this report as shipped by ScienceLogic. This report might have been modified on your Skylar One system.
Devices > Device At-A-Glance
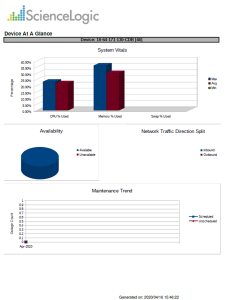
This report allows you to view statistics charts and data about selected devices. It includes System Vital and Maintenance Trend charts, reports on CPU, Memory, and Swap percentage used, device availability, inbound and outbound traffic, and scheduled and unscheduled outages, based on the time interval you specify.
You can customize the output of the report to display the device charts and reports by different time spans.
The following input options are available when generating the report:
- Select By. Select the devices that will appear in the report. The following input elements appear in this component:
- Org/Device; Org/Asset; ESX Server/VM. Your selection will have an affect on the fields described below.
- Org/Device. When selected, you have the option to select all, multiple, or individual organizations, then you can optionally select specific devices in those organizations.
- Org/Asset. When selected, you have the option to select all, multiple, or individual organizations, then you can optionally select specific assets in those organizations.
- ESX Server/VM. When selected, you will have the option to select all, multiple, or individual ESX Servers, then you can optionally select specific Guest VMs on those ESX Servers.
- All Items. Select this checkbox if you want all devices in the system to be included in this report.
- Organizations/ESX Server. If the All Items checkbox is unselected, select multiple or individual Organizations or ESX servers. The report will contain only the devices in the organizations you select, or only Guest VMs on the ESX servers you select. You can further filter the list of devices or guest VMs by selecting the Select individual items checkbox.
You can further reduce the list of assets to include on the report. Depending on your selection in the Org/Device; Org/Asset; ESX Server/VM radio buttons, you can select specific assets, devices, or Guest VMs from the organizations or ESX servers you selected in the Organizations/ESX Server Select list. Use the following fields if you want to select individual items:
- Select individual items. If the All Items checkbox is unselected, the Select individual items checkbox is available. Select this checkbox if you would like to select the individual Devices, Assets, or Guest VMs to include in the report.
- Devices/Assets by Organization, Guest VMs by ESX Server. Select one or multiple devices or assets by organization, or individual guest VMs by ESX server, to include in the report.
- Device Group Selector. Select one or multiple or all device groups to include in the report.
- Separated By. Group devices by Device Group.
- Report Span. Specify a Daily, Weekly, or Monthly span to include in the report. Specify a Starting date and a Duration for the report. Select a time zone for the report.
This description covers the latest version of this report as shipped by ScienceLogic. This report might have been modified on your Skylar One system.
Devices > Device Availability
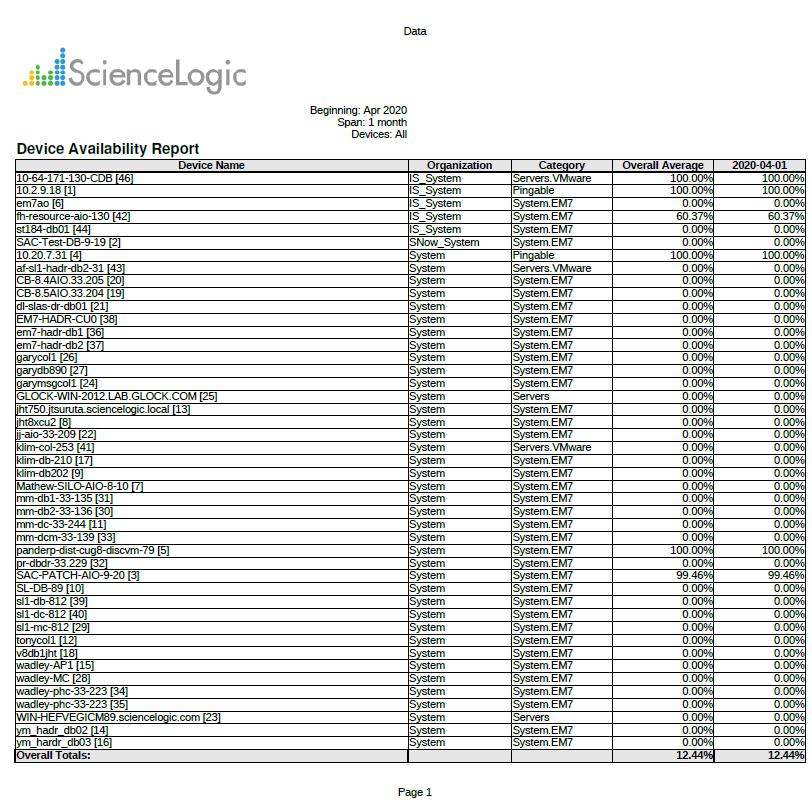
This report displays a list of devices and their availability within a specified time span. For each device, this report displays default columns of device name and a report of that device's availability.
You can customize the output of the report to display the device availability by different time spans, group devices by organization or device category, and show the aggregate total of the device availability.
The following input options are available when generating the report:
- Device Selection: Select the devices that will appear in the report. The choices are:
- All devices. Select this checkbox if you want all devices in the system to be included in this report.
- Organizations. If the All devices checkbox is unselected, select one or more Organizations. The report will contain only the devices in the organizations you select. You can further filter the list of devices to include in the report by selecting devices in the Devices by Organization field.
- Select individual devices. If the All devices checkbox is unselected, the Select individual devices checkbox is available. Select this checkbox if you would like to use the Devices by Organization field to select the individual devices to include in the report.
- Devices by Organization. This field displays a list of all devices in the organizations selected in the Organizations field. If the Select individual devices checkbox is selected, you can select one or more devices to include in the report.
- Device Group Selector. Select one, multiple, or all device groups to include in the report.
- All Device Categories. Select this checkbox if you want to include devices from all device categories in the report.
- Device Categories. Further filters the list of devices selected in the Device Selection field. Only those devices selected in the Device Selection fields that are also from the selected device categories will be included in the report.
- Report Span. Specify a Daily, Weekly, or Monthly span to include in the report. Specify a Starting date and a Duration for the report. Select a time zone for the report.
- Separated By. Group devices by Organization, Device Category, or Device Group.
- Report Sections. Specify how the report will be arranged. Select whether you want the report to display Details Only, Totals Only, or Both.
- Optional Columns. Selecting the IP Address checkbox in this pane will include IP addresses in the report.
This description covers the latest version of this report as shipped by ScienceLogic. This report might have been modified on your Skylar One system.
Devices > Device Availability (Page Per Device)
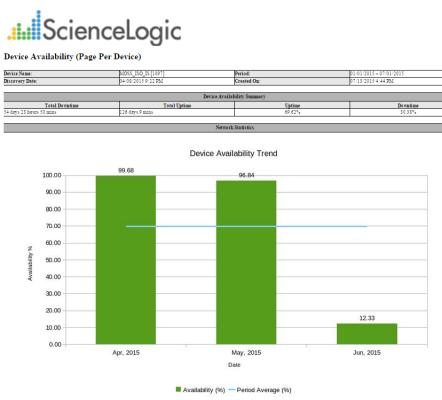
This report displays a list of devices and their availability within a specified time span. The report displays information for each device separately. Information for each device includes the device name, discovery date, creation date, and an availability summary for that device. A Device Availability Trend graph is also included for each device.
You can customize the output of the report to display the device availability by different time spans, or group devices by organization or device category.
- Device Selection: Select the devices that will appear in the report. The choices are:
- All devices. Select this checkbox if you want all devices in the system to be included in this report.
- Organizations. If the All devices checkbox is unselected, select one or more Organizations. The report will contain only the devices in the organizations you select. You can further filter the list of devices to include in the report by selecting devices in the Devices by Organization field.
- Select individual devices. If the All devices checkbox is unselected, the Select individual devices checkbox is available. Select this checkbox if you would like to use the Devices by Organization field to select the individual devices to include in the report.
- Devices by Organization. This field displays a list of all devices in the organizations selected in the Organizations field. If the Select individual devices checkbox is selected, you can select one or more devices to include in the report.
- Device Group Selector: Select the device groups that will appear in the report. The following input elements appear in this component:
- All Device Groups. Select this checkbox if you want to include all device groups in the report.
- Device Groups. If the All Device Groups checkbox is not selected, select one or more device groups. The report will contain only the devices in the device groups you select.
- Device Categories: Select the device categories that will appear in the report. The following input elements appear in this component:
- All Device Categories. Select this checkbox if you want to include all device groups in the report.
- Device Categories. If the All Device Categories checkbox is not selected, select one or more device categories. The report will contain only the devices in the device categories you select.
- Report Span. Specify a Daily, Weekly, or Monthly span to include in the report. Specify a Starting date and a Duration for the report. Select a time zone for the report.
This description covers the latest version of this report as shipped by ScienceLogic. This report might have been modified on your Skylar One system.
Devices > Device by Monitored Service
This report displays a list of devices with Windows service monitoring policies aligned with them. For each device, this report displays default columns of Organization, Device Name, and Alert When.
You can customize the output of the report to display only specified monitored services, and to separate and sort the report by organizations, services, device, or a combination of the three.
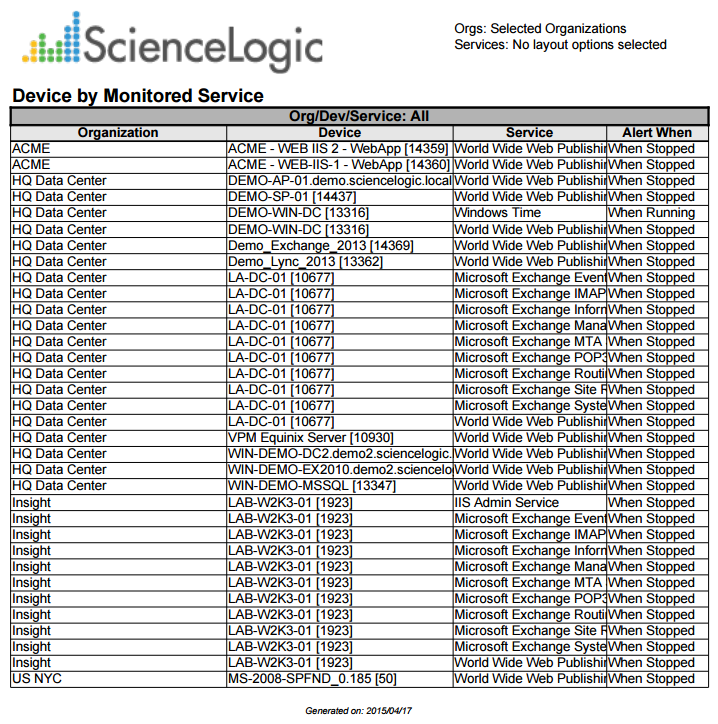
The following input options are available when generating the report:
- Organizations. Specify one or more organizations or all organizations to include in the report.
- Monitored Services. Select one or more monitored services to view in the report. These monitored services will come from the organization(s) selected in the Organizations field. The report will show one table for each service.
- Separate By. Specify whether the report will be separated by Organization and Service, Organization, Service, or will be One Table.
- Sorted By. Specify whether you want the report sorted by Organization/Device/Service, Device/Service, or by Service/Organization/Device.
This description covers the latest version of this report as shipped by ScienceLogic. This report might have been modified on your Skylar One system.
Devices > Device Collector Group Summary
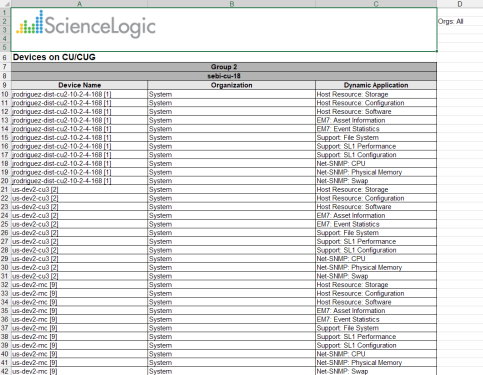
This report displays the devices that are aligned to a collector unit and collector group. You can select one organization, multiple organizations, or all organizations. You can filter by Collector Group and Collector Unit, and you can also list the Dynamic Applications aligned with a device.
The following input options are available when generating the report:
- Organizations. Specify one or more organizations or all organizations to include in the report.
- CUGs. Select one or more Collector Groups to view in the report. These Collector Groups will come from the organizations selected in the Organizations field.
- CUs. Select one or more Collector Units to view in the report.
- Optional. Specify if you want the report sorted by Dynamic Application.
This description covers the latest version of this report as shipped by ScienceLogic. This report might have been modified on your Skylar One system.
Devices > Device Combo
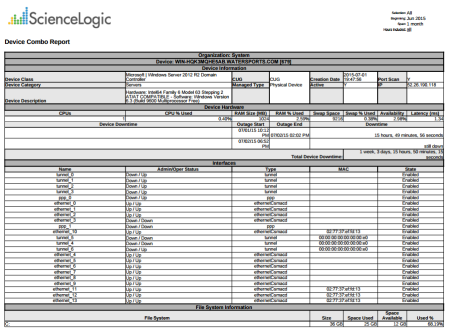
This report displays asset information, CPU utilization, memory utilization, swap utilization, file system information, downtime, and running processes for each selected device, interface, open port, or file system.
You can customize the output of the report and specify the type of statistics to display, and the hours to include in the report.
The following input options are available when generating the report:
- Select By. Select the devices that will appear in the report. The following input elements appear in this component:
- Org/Device; Org/Asset; ESX Server/VM. Your selection will have an affect on the fields described below.
- Org/Device. When selected, you have the option to select all, multiple, or individual organizations, then you can optionally select specific devices in those organizations.
- Org/Asset. When selected, you have the option to select all, multiple, or individual organizations, then you can optionally select specific assets in those organizations.
- ESX Server/VM. When selected, you will have the option to select all, multiple, or individual ESX Servers, then you can optionally select specific Guest VMs on those ESX Servers.
- All Items. Select this checkbox if you want all devices in the system to be included in this report.
- Organizations/ESX Server. If the All Items checkbox is unselected, select multiple or individual Organizations or ESX servers. The report will contain only the devices in the organizations you select, or only Guest VMs on the ESX servers you select. You can further filter the list of devices or guest VMs by selecting the Select individual items checkbox.
You can further reduce the list of assets to include on the report. Depending on your selection in the Org/Device; Org/Asset; ESX Server/VM radio buttons, you can select specific assets, devices, or Guest VMs from the organizations or ESX servers you selected in the Organizations/ESX Server Select list. Use the following fields if you want to select individual items:
- Select individual items. If the All Items checkbox is unselected, the Select individual items checkbox is available. Select this checkbox if you would like to select the individual Devices, Assets, or Guest VMs to include in the report.
- Devices/Assets by Organization, Guest VMs by ESX Server. Select one or multiple devices or assets by organization, or individual guest VMs by ESX server, to include in the report.
- Device Group Selector. Select one or multiple or all device groups to include in the report.
- Statistics Type. Select by Max Hour or Averaged Hours. When gathering data for reports, Skylar One averages all the readings taken during an hour - 24 values per day. This field specifies whether the value for each day should be the highest value of the 24 hour values or whether Skylar One should average the 24 values.
- Separated By. Group devices by Organization or Device Group.
- Other Options. If the Show Hidden File Systems checkbox is selected, hidden file systems will be included in the report.
- Report Span. Select the time span of the report. Choices are Daily, Weekly, and Monthly. Select the starting point for the report, and the Duration for the report. Select the Hours Included. Choices are 24 hours, or specific hours Monday - Friday. You can also select a time zone for the report.
This description covers the latest version of this report as shipped by ScienceLogic. This report might have been modified on your Skylar One system.
Devices > Device Count
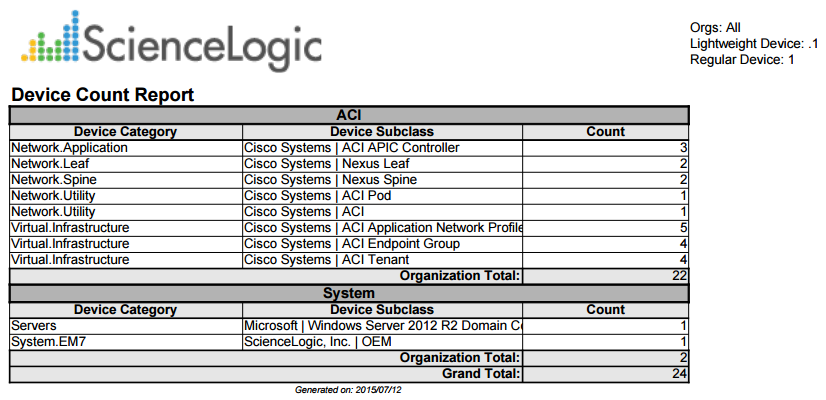
This report displays the number of devices per device category in each selected organization.This report displays default columns of Device Class, Device Subclass, Count, and License Count. The report is divided into tables by organization.
You can customize the output of the report to include only devices from selected organizations.
The following input options are available when generating the report:
- Organizations. Specify one or more organizations or all organizations to include in the report.
This description covers the latest version of this report as shipped by ScienceLogic. This report might have been modified on your Skylar One system.
Devices > Device Outage History
From the list of selected devices, this report determines which devices have had an outage during a specified time period. For each device that has had an outage, displays default columns of Device Name, Device Groups, Outage Start, Outage End, and Downtime.
You can customize the output of the report to include only specific organizations or specific devices, and change the report span. You can also specify the number of missed polls that must occur on a device before the device will appear in the Device Outage History report.

The following input options are available when generating the report:
- Device Selection. Select the device(s) that will appear in the report. The following input elements appear in this component:
- All devices. Select this checkbox if you want all devices in the system to be included in this report.
- Organizations. If the All devices checkbox is unselected, select multiple or individual Organizations.
- Select individual devices. If the All devices checkbox is unselected, the Select individual devices checkbox is available. Select this checkbox if you would like to select the individual devices to include in the report.
- Devices by Organization. Select one or multiple devices by organization to include in the report.
- Device Group Selector. Select one, multiple, or all device groups to include in the report.
- Report Span. Specify a Daily, Weekly, or Monthly span to include in the report. Specify a Starting date and a Duration for the report. Select a time zone for the report.
- Separated By. Group the report by Organization, Device Group, or Device.
- Report Sections. Specify how the report will be arranged. Select whether you want the report to display Details Only, Totals Only, or Both.
-
Missed Polls Required. Select the number of missed polls that must occur on a device before the device will appear in the Device Outage History report.
This description covers the latest version of this report as shipped by ScienceLogic. This report might have been modified on your Skylar One system.
Devices > Device Outage Events History
This report shows a list of device outages using the events table instead of the logs table as in the Device Outage report.
From the list of selected devices, this report determines which devices have had an outage during a specified time period. For each device that has had an outage, displays default columns of Device Name, Device Groups, Outage Start, Outage End, and Downtime.
You can customize the output of the report to include only specific organizations or specific devices, and change the report span. You can also specify the number of missed polls that must occur on a device before the device will appear in the Device Outage History report.

The following input options are available when generating the report:
- Device Selection. Select the device(s) that will appear in the report. The following input elements appear in this component:
- All devices. Select this checkbox if you want all devices in the system to be included in this report.
- Organizations. If the All devices checkbox is unselected, select multiple or individual Organizations.
- Select individual devices. If the All devices checkbox is unselected, the Select individual devices checkbox is available. Select this checkbox if you would like to select the individual devices to include in the report.
- Devices by Organization. Select one or multiple devices by organization to include in the report.
- Device Group Selector. Select one, multiple, or all device groups to include in the report.
- Report Span. Specify a Daily, Weekly, or Monthly span to include in the report. Specify a Starting date and a Duration for the report. Select a time zone for the report.
- Separated By. Group the report by Organization, Device Group, or Device.
- Report Sections. Specify how the report will be arranged. Select whether you want the report to display Details Only, Totals Only, or Both.
-
Missed Polls Required. Select the number of missed polls that must occur on a device before the device will appear in the Device Outage History report.
This description covers the latest version of this report as shipped by ScienceLogic. This report might have been modified on your Skylar One system.
Devices > Device Threshold
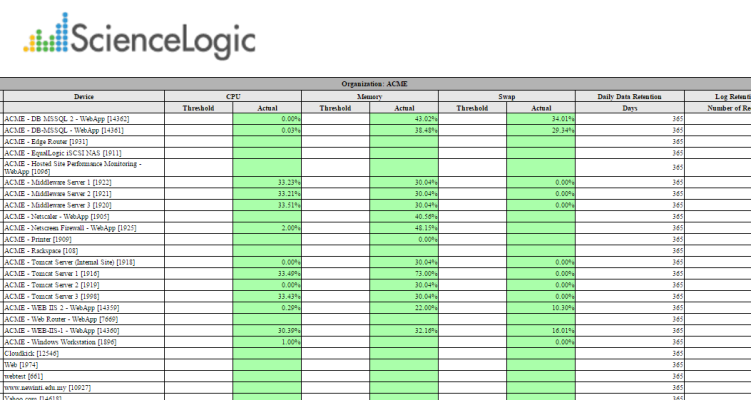
This report displays the threshold information for devices in your system. For each device, this report displays default columns of Device Groups, Device, CPU, Memory, Swap, Data Retention, Log Retention, and Latency.
You can customize the output for the report to include only devices in specific organizations or only specific devices. You can also specify that devices are grouped by organization into separate tables, and that the report include the actual usage value for each threshold for each device.
The following input options are available when generating the report:
- All Devices. If you select this checkbox, all devices will be displayed in the report. If you unselect this checkbox, you will have the following options:
- Organizations. Select one or more organizations for which to view device thresholds.
- Select individual devices. If the All Devices checkbox is unselected, the Select individual devices checkbox is available. Select this checkbox if you would like to select the individual devices to include in the report.
- Devices by Organization. If the select individual devices checkbox is selected, this field is available. You can select one or more devices in this field to include in the report. The report will search for outages among the device(s) specified in this field.
- Options. Select whether to include the actual usage values.
- Separated By. Group devices by Organization or Device Group.
This description covers the latest version of this report as shipped by ScienceLogic. This report might have been modified on your Skylar One system.
Devices > Device Top Metrics
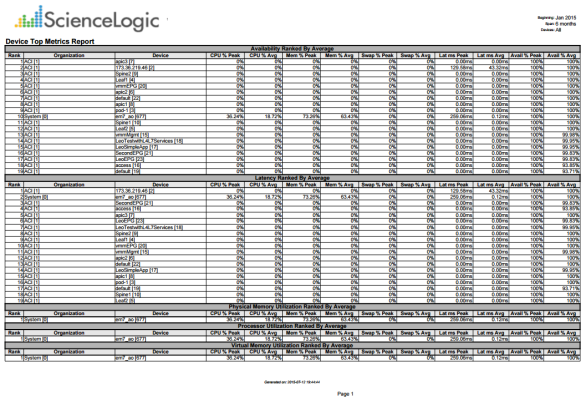
This report displays the Device Leaderboard with the default columns Rank, Organization, Device, CPU % Peak, CPU % Avg.
The following input options are available when generating the report:
- Select By. Select the devices that will appear in the report. The following input elements appear in this component:
- Org/Device; Org/Asset; ESX Server/VM. Your selection will have an affect on the fields described below.
- Org/Device. When selected, you have the option to select all, multiple, or individual organizations, then you can optionally select specific devices in those organizations.
- Org/Asset. When selected, you have the option to select all, multiple, or individual organizations, then you can optionally select specific assets in those organizations.
- ESX Server/VM. When selected, you will have the option to select all, multiple, or individual ESX Servers, then you can optionally select specific Guest VMs on those ESX Servers.
- All Items. Select this checkbox if you want all devices in the system to be included in this report.
- Organizations/ESX Server. If the All Items checkbox is unselected, select multiple or individual Organizations or ESX servers. The report will contain only the devices in the organizations you select, or only Guest VMs on the ESX servers you select. You can further filter the list of devices or guest VMs by selecting the Select individual items checkbox.
You can further reduce the list of assets to include on the report. Depending on your selection in the Org/Device; Org/Asset; ESX Server/VM radio buttons, you can select specific assets, devices, or Guest VMs from the organizations or ESX servers you selected in the Organizations/ESX Server Select list. Use the following fields if you want to select individual items:
- Select individual items. If the All Items checkbox is unselected, the Select individual items checkbox is available. Select this checkbox if you would like to select the individual Devices, Assets, or Guest VMs to include in the report.
- Devices/Assets by Organization, Guest VMs by ESX Server. Select one or multiple devices or assets by organization, or individual guest VMs by ESX server, to include in the report.
- Device Group Selector. Select one, multiple, or all device groups to include in the report.
- Device Selection Options. Select All; Auto-select using the specified filters (below) in the Metrics and Minimum Value Filters section; or Auto-select a specific number by their rank, which allows you to use drop-down menus to select the bottom or top 10–1000 devices.
- Metrics and Minimum Value Filters. Allows you to select which metrics you wish to display in the report. CPU Utilization is the default selection, however you have the option to keep or remove CPU Utilization, and add Memory, Swap, Availability, or Latency. If you have selected Auto-select using the specified filters (below) in the Device Selection Options section, you can specify a value for a filter that all devices in the report must exceed using the drop-down menus.
- Report Span. Specify a Daily, Weekly, or Monthly span to include in the report. Specify a Starting date and a Duration for the report.
- Separated By. Select the checkbox for Device Group if you wish to separate data according to device group.
This description covers version 1 of this report as shipped by ScienceLogic. This report might have been modified on your Skylar One system.
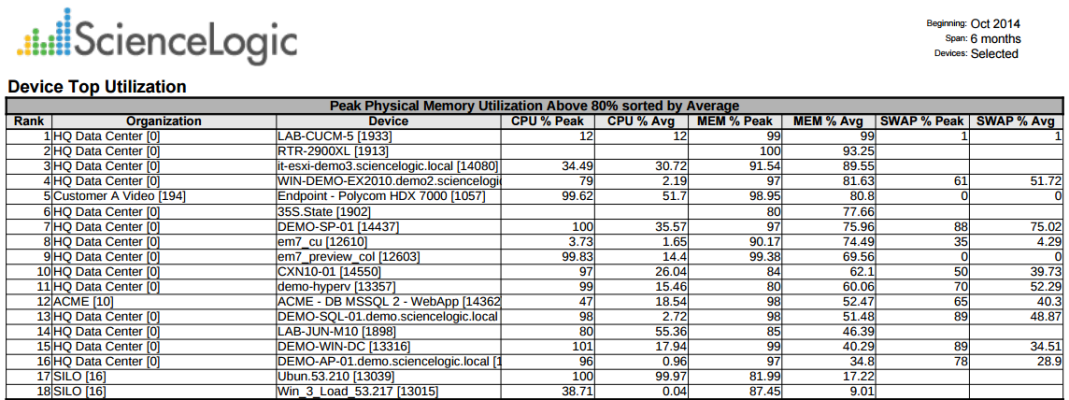
Devices > Device Top Utilization
This report displays the devices with the highest utilization of CPU, Physical Memory, and Virtual Memory. This report can be generated as:
- A "Top N" report, where you select a utilization statistic (CPU, Memory, or Swap) and the number of devices to include on the report. The devices that will be included in the report are those with the highest values for the specified utilization statistic. For each device included in the report, the report displays default columns of Rank, Organization, Device, CPU % Peak, CPU % Average, Memory % Peak, Memory % Average, Swap % Peak, and Swap % Average.
- A "Threshold" report, where you select a percentage threshold for CPU utilization, Memory utilization, and Swap utilization. The report will include a table for each utilization statistic. Each table includes the devices that have a peak percentage value that exceeds the specified threshold for that utilization statistic. For each device included in the report, the report displays default columns of Rank; Organization; Device; CPU, Memory, or Swap % Peak; and CPU, Memory, or Swap % Average.
You can customize the output of the report to limit which devices will be evaluated for inclusion in the report. You can also specify the time span of information to include in the report.
The following input options are available when generating the report:
- Select By. Select the devices that will appear in the report. The following input elements appear in this component:
- Org/Device; Org/Asset; ESX Server/VM. Your selection will have an affect on the fields described below.
- Org/Device. When selected, you have the option to select all, multiple, or individual organizations, then you can optionally select specific devices in those organizations.
- Org/Asset. When selected, you have the option to select all, multiple, or individual organizations, then you can optionally select specific assets in those organizations.
- ESX Server/VM. When selected, you will have the option to select all, multiple, or individual ESX Servers, then you can optionally select specific Guest VMs on those ESX Servers.
- All Items. Select this checkbox if you want all devices in the system to be included in this report.
- Organizations/ESX Server. If the All Items checkbox is unselected, select multiple or individual Organizations or ESX servers. The report will contain only the devices in the organizations you select, or only Guest VMs on the ESX servers you select. You can further filter the list of devices or guest VMs by selecting the Select individual items checkbox.
You can further reduce the list of assets to include on the report. Depending on your selection in the Org/Device; Org/Asset; ESX Server/VM radio buttons, you can select specific assets, devices, or Guest VMs from the organizations or ESX servers you selected in the Organizations/ESX Server Select list. Use the following fields if you want to select individual items:
- Select individual items. If the All Items checkbox is unselected, the Select individual items checkbox is available. Select this checkbox if you would like to select the individual Devices, Assets, or Guest VMs to include in the report.
- Devices/Assets by Organization, Guest VMs by ESX Server. Select one or multiple devices or assets by organization, or individual guest VMs by ESX server, to include in the report.
- Device Group Selector. Select one or multiple or all device groups to include in the report.
- Report Type. You can choose to include all devices that match the specified thresholds or you can choose to include the devices that are top users of CPU, memory, or swap space.
- If you select Threshold, you can then specify the values for CPU Threshold, Memory Threshold, and Swap Threshold. The values range from 0% to 95%. The report will include separate tables for CPU, Memory, and Swap and include devices that have met or exceeded the threshold.
- If you want to select a number of devices, choices range from top 10 to Top 100. Specify the top number of devices to display in the report, then select the utilization statistic (CPU, Memory, or Swap) that will be used to determine which devices will be included in the report.
- Report Span. Specify a Daily, Weekly, or Monthly span to include in the report. Specify a Starting date and a Duration for the report. Select a time zone for the report.
- Separated By. Group devices by Device Group.
This description covers the latest version of this report as shipped by ScienceLogic. This report might have been modified on your Skylar One system.
Devices > Device Uptime
This report displays device uptime for devices in the system. For each selected device, the report displays default columns of Device, Uptime, Up Since, Timeticks, and Last Polled.
You can customize the output of the report to include only devices in selected organizations and to sort devices by organization and device or agent system uptime.

The following input options are available when generating the report:
- Organizations. Specify one or more organizations or all organizations to include in the report.
- Sort By. Sort the report by Organization and Device or Agent System Uptime (the uptime collected during availability collection).
- Options. Select whether to create separate tables for each organization, display all devices, or display only devices restarted within a specified timeframe.
- Timezone. Select a time zone for the report.
This description covers the latest version of this report as shipped by ScienceLogic. This report might have been modified on your Skylar One system.
Devices > Device Utilization
This report displays an overview of device utilization for devices in a system. For each device included in the report, the report displays default columns of Organization, Device Category, Device Groups, Device, CPUs, CPU %, RAM, RAM %, Swap, Swap %, and File System Utilization.
You can customize the output to include the statistics based on peak or average utilization, include separate rows for each file system on a device, and what percentage threshold a device must exceed to be included on the report.

The following input options are available when generating the report:
- Select By. Select the devices that will appear in the report. The following input elements appear in this component:
- Org/Device; Org/Asset; ESX Server/VM. Your selection will have an affect on the fields described below.
- Org/Device. When selected, you have the option to select all, multiple, or individual organizations, then you can optionally select specific devices in those organizations.
- Org/Asset. When selected, you have the option to select all, multiple, or individual organizations, then you can optionally select specific assets in those organizations.
- ESX Server/VM. When selected, you will have the option to select all, multiple, or individual ESX Servers, then you can optionally select specific Guest VMs on those ESX Servers.
- All Items. Select this checkbox if you want all devices in the system to be included in this report.
- Organizations/ESX Server. If the All Items checkbox is unselected, select multiple or individual Organizations or ESX servers. The report will contain only the devices in the organizations you select, or only Guest VMs on the ESX servers you select. You can further filter the list of devices or guest VMs by selecting the Select individual items checkbox.
You can further reduce the list of assets to include on the report. Depending on your selection in the Org/Device; Org/Asset; ESX Server/VM radio buttons, you can select specific assets, devices, or Guest VMs from the organizations or ESX servers you selected in the Organizations/ESX Server Select list. Use the following fields if you want to select individual items:
- Select individual items. If the All Items checkbox is unselected, the Select individual items checkbox is available. Select this checkbox if you would like to select the individual Devices, Assets, or Guest VMs to include in the report.
- Devices/Assets by Organization, Guest VMs by ESX Server. Select one or multiple devices or assets by organization, or individual guest VMs by ESX server, to include in the report.
- Device Group Selector. Select one or multiple or all device groups to include in the report.
- Device Categories. Further filters the list of devices specified in the Select By field by Device Category. Only devices specified in the selected device categories will be included in the report.
- Report Span. Select the time span of the report. Choices are Daily, Weekly, and Monthly. Select the starting point for the report, and the Duration for the report. Select the Hours Included. Choices are 24 hours, or specific hours Monday - Friday.
- Statistics Type. Select whether the usage statistics displayed on the report should be the maximum values, minimum values, or average values. When gathering data for reports, Skylar One averages all the readings taken during an hour - 24 values per day. This field specifies whether the value for each day should be the highest value of the 24 hour values, the lowest value of the 24 hour values, or whether Skylar One should average the 24 hour values.
- File System Output. Select whether file system usage information should be condensed into one cell; displayed with multiple columns for file system name, usage percent, used in GB and size in GB; or not included in the report.
- Show Only. Select a percentage. Devices with a percentage utilization equal or higher than the specified percentage will be included in the report. Select the Show Hidden File Systems checkbox to include hidden file systems in the report.
- Separated By. Group the devices into tables, based on Organization, Device Category, and/or Device Group.
This description covers the latest version of this report as shipped by ScienceLogic. This report might have been modified on your Skylar One system.
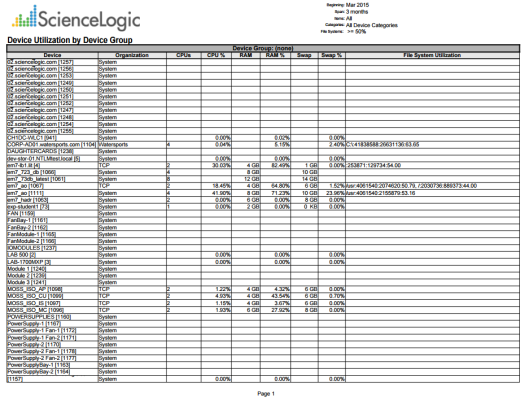
Devices > Device Utilization by Device Group
This report displays device utilization by device group. For each device, the report displays default columns of Device, Organization, CPUs, CPU %, RAM, RAM %, Swap, Swap %, and File System Utilization. By default, devices are grouped by device group.
You can customize the output of the report to display the statistics based on peak or average utilization. You can also include information about each file system on a device, and specify what percentage threshold a device must exceed to be included on the report.
The following input options are available when generating the report:
- Device Group Selector. Select one or multiple or all device groups to include in the report.
- Device Categories. Further filters the list of devices specified in the Select By field by Device Category. Only devices specified in the selected device categories will be included in the report.
- Statistics Type. Select whether the usage statistics displayed on the report should be the peak (maximum) or average values. When gathering data for reports, Skylar One averages all the readings taken during an hour - 24 values per day. This field specifies whether the value for each day should be the highest value of the 24 hour values or whether Skylar One should average the 24 values.
- File System output. Select whether file system usage information should be condensed into One Cell; displayed with multiple columns for file system name, usage percent, used in GB and size in GB; or not included in the report.
- Show Only. Select a percentage. Devices with a percentage utilization equal or higher than the specified percentage will be included in the report.
- Separate By. Groups the devices into tables, based on Device Group and/or Device Category, or neither.
- Report Span. Select the time span of the report. Choices are Daily, Weekly, and Monthly. Select the starting point for the report, and the Duration for the report. Select the Hours Included. Choices are 24 hours, or specific hours Monday - Friday. Select a time zone for the report.
This description covers the latest version of this report as shipped by ScienceLogic. This report might have been modified on your Skylar One system.
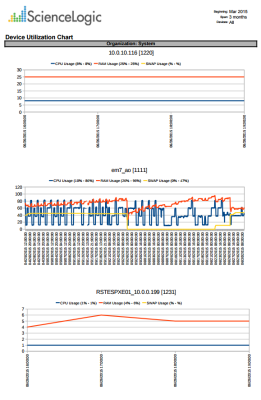
Devices > Device Utilization Chart
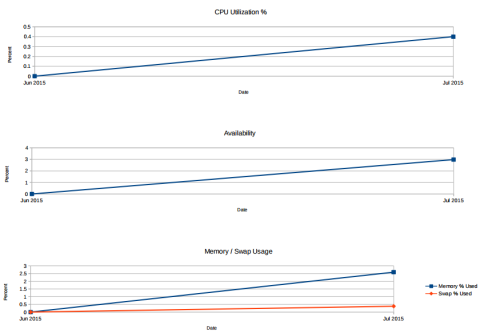
For each selected device, this report displays a graph of CPU, Memory, and Swap usage.
You can customize the output of the report to include charts only for specific devices, and separate the charts by organization. By default, utilization charts for all devices in the system will be displayed.
The following input options are available when generating the report:
- Select By. Select the devices that will appear in the report. The following input elements appear in this component:
- Org/Device; Org/Asset; ESX Server/VM. Your selection will have an affect on the fields described below.
- Org/Device. When selected, you have the option to select all, multiple, or individual organizations, then you can optionally select specific devices in those organizations.
- Org/Asset. When selected, you have the option to select all, multiple, or individual organizations, then you can optionally select specific assets in those organizations.
- ESX Server/VM. When selected, you will have the option to select all, multiple, or individual ESX Servers, then you can optionally select specific Guest VMs on those ESX Servers.
- All Items. Select this checkbox if you want all devices in the system to be included in this report.
- Organizations/ESX Server. If the All Items checkbox is unselected, select multiple or individual Organizations or ESX servers. The report will contain only the devices in the organizations you select, or only Guest VMs on the ESX servers you select. You can further filter the list of devices or guest VMs by selecting the Select individual items checkbox.
You can further reduce the list of assets to include on the report. Depending on your selection in the Org/Device; Org/Asset; ESX Server/VM radio buttons, you can select specific assets, devices, or Guest VMs from the organizations or ESX servers you selected in the Organizations/ESX Server Select list. Use the following fields if you want to select individual items:
- Select individual items. If the All Items checkbox is unselected, the Select individual items checkbox is available. Select this checkbox if you would like to select the individual Devices, Assets, or Guest VMs to include in the report.
- Devices/Assets by Organization, Guest VMs by ESX Server. Select one or multiple devices or assets by organization, or individual guest VMs by ESX server, to include in the report.
- Device Group Selector. Select one or multiple or all device groups to include in the report.
- Report Span. Specify a Daily, Weekly, or Monthly span to include in the report. Specify a Starting date and a Duration for the report. Select a time zone for the report.
- Separated By. If selected, the devices will be grouped by Organization or Device Group.
This description covers version 1.2 of this report as shipped by ScienceLogic. This report might have been modified on your Skylar One system.
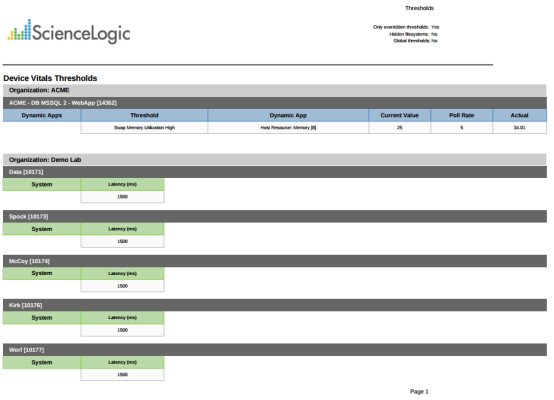
Devices > Device Vitals Thresholds
This report displays the thresholds that have been set for the following vitals: latency, CPU utilization, memory utilization, swap utilization, and file system utilization. For each device, this report displays the organization name, device name, and threshold information.
You can customize the output for the report to include only devices in specific organizations or only specific devices. You can also specify that devices are grouped by organization into separate tables, and that the report include the actual usage value for each threshold for each device.
The following input options are available when generating the report:
- All Devices. If you select this checkbox, all devices with device-level thresholds will be displayed in the report. If you deselect this checkbox, you will have the following options:
- Organizations. Select one or more organizations for which to view device thresholds.
- Select individual devices. If the All Devices checkbox is unselected, the Select individual devices checkbox is available. Select this checkbox if you would like to select the individual devices to include in the report.
- Devices by Organization. If the select individual devices checkbox is selected, this field is available. You can select one or more devices in this field to include in the report. The report will search for outages among the device(s) specified in this field.
- Options. Select whether to include the actual usage values (default), show only overridden thresholds (default), show hidden file systems, or to show global thresholds.
- Separated By. Group devices by Organization (selected by default).
This description covers the latest version of this report as shipped by ScienceLogic. This report might have been modified on your Skylar One system.
Devices > Dynamic App Alerts
This report displays a list of Dynamic Applications alerts, including information on associated event policies. For each alert, the report displays default columns of Dynamic Application, APP GUID, Alert, Alert App GUID, Alert APP ID, Alert Formula, Event, Event App GUID, App ID, and Alert.
You can customize the output of the report to include only alerts associated with specific Dynamic Applications. You can also specify which associated events are included in the report.
The following input options are available when generating the report:
- Select Dynamic Applications. Select all Dynamic Application, or select one or more Dynamic Applications from the list. Alerts from each selected Dynamic Application will be included in the report.
- Report Options. Specify whether or not the report will show all events aligned with alerts, whether or not orphaned events are shown, and whether or not all alerts are shown.
This description covers the latest version of this report as shipped by ScienceLogic. This report might have been modified on your Skylar One system.
Devices > Dynamic App Collection
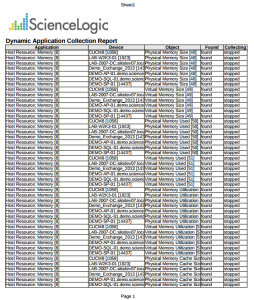
This report displays the collection status for Dynamic Applications on their subscriber devices. The report includes information on each collection object on each subscriber device, including if each collection object has been found on the device and if collection is active. For each instance of the Dynamic Application, the report displays default columns of Application, Device, Object, Found, and Collecting.
You can customize the output of the report so that only devices in specific organizations are included in the report. You can also specify that only objects that have specific Found and Collecting values will be included in the report.
The following input options are available when generating the report:
- Organizations. Specify one or more organizations or all organizations to include in the report.
- Objects Found. Select if only found objects will be displayed, only objects not found will be displayed, or objects with either status will be displayed
- Collecting. Select if only objects currently collecting will be displayed, only objects not currently being collected will be displayed, or objects with either status will be displayed.
This description covers the latest version of this report as shipped by ScienceLogic. This report might have been modified on your Skylar One system.
Devices > Monitored Elements
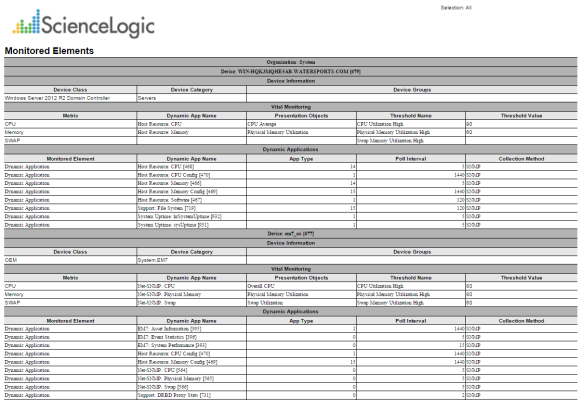
For each selected device, this report displays a list of aligned Dynamic Applications and monitoring policies.
For each Content Verification policy, the report displays columns for Monitored Element, Name, URL, Port, and Expression.
For each Domain Monitor, the report displays columns for Monitored Element, Domain Name, Name server, Record Type, and Result Match.
For each Dynamic Application, the report displays columns for Monitored Element, Dynamic App Name, App Type, Poll Interval, and Collection Method.
For each Email Transaction Monitor, the report displays columns for Monitored Element, Name, Email To Address, Timeout, and Message Body.
For each Monitored Process, the report displays columns for Monitored Element, Process Name, Running, Monitoring, and Alert When.
For each Monitored Service, the report displays columns for Monitored Element, Service Name, Running, Monitored, and Alert When.
For each Port Monitor, the report displays columns for Monitored Element, IP, Port, Procotol, and Critical Poll.
For each SOAP-XML Monitor, the report displays columns for Monitored Element, Policy Name, URL, Expression Check 1, and Expression Check 2.
For each SSL Certificate, the report displays columns for Monitored Element, Cert ID, Certificate Organization, Common Name, and Expiration Date.
The following input options are available when generating the report:
- Device Selection: Select the devices that will appear in the report. The following input elements appear in this component:
- All devices. Select this checkbox if you want all devices in the system to be included in this report.
- Organizations. If the All devices checkbox is unselected, select one or more Organizations. The report will contain only the devices in the organizations you select. You can further filter the list of devices by selecting the Select individual items checkbox.
- Select individual devices. If the All devices checkbox is unselected, the Select individual devices checkbox is available. Select this checkbox if you would like to select the individual devices to include in the report.
- Devices by Organization. If the Select individual devices checkbox is selected, you can select one or more devices (in the organization(s) selected in the Organizations field) to include in the report.
- Device Group Selector. Select one or multiple or all device groups to include in the report.
- Timezone. Select a time zone for the report.
- Separated By. Group elements by Organization and/or Device Group.
This description covers the latest version of this report as shipped by ScienceLogic. This report might have been modified on your Skylar One system.
Devices > Monitored Services
For each selected device, displays a list of discovered Windows Services and system processes. For each Windows service and system process, the report displays default columns of Service/Process Name, Running, Monitored, and Alert When.
You can customize the output of the report to show only services and processes for which a monitoring policy has been set up, only services and processes that are not monitored, or all services and processes.
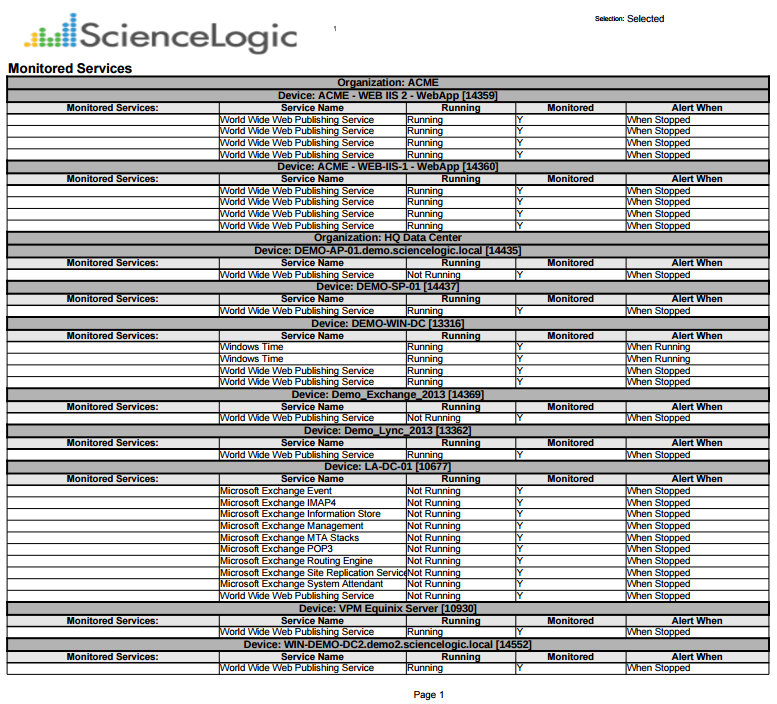
The following input options are available when generating the report:
- Select By. Select the devices that will appear in the report. The following input elements appear in this component:
- Org/Device; Org/Asset; ESX Server/VM. Your selection will have an affect on the fields described below.
- Org/Device. When selected, you have the option to select all, multiple, or individual organizations, then you can optionally select specific devices in those organizations.
- Org/Asset. When selected, you have the option to select all, multiple, or individual organizations, then you can optionally select specific assets in those organizations.
- ESX Server/VM. When selected, you will have the option to select all, multiple, or individual ESX Servers, then you can optionally select specific Guest VMs on those ESX Servers.
- All Items. Select this checkbox if you want all devices in the system to be included in this report.
- Organizations/ESX Server. If the All Items checkbox is unselected, select multiple or individual Organizations or ESX servers. The report will contain only the devices in the organizations you select, or only Guest VMs on the ESX servers you select. You can further filter the list of devices or guest VMs by selecting the Select individual items checkbox.
You can further reduce the list of assets to include on the report. Depending on your selection in the Org/Device; Org/Asset; ESX Server/VM radio buttons, you can select specific assets, devices, or Guest VMs from the organizations or ESX servers you selected in the Organizations/ESX Server Select list. Use the following fields if you want to select individual items:
- Select individual items. If the All Items checkbox is unselected, the Select individual items checkbox is available. Select this checkbox if you would like to select the individual Devices, Assets, or Guest VMs to include in the report.
- Devices/Assets by Organization, Guest VMs by ESX Server. Select one or multiple devices or assets by organization, or individual guest VMs by ESX server, to include in the report.
- Device Group Selector. Select one or multiple or all device groups to include in the report.
- Show. Include all services and processes, monitored services and processes only, or only services and processes that are not monitored.
- Separated By. Group asset records by Organization and/or Device Group.
This description covers the latest version of this report as shipped by ScienceLogic. This report might have been modified on your Skylar One system.
Devices > Performance Multi Object/Device Table
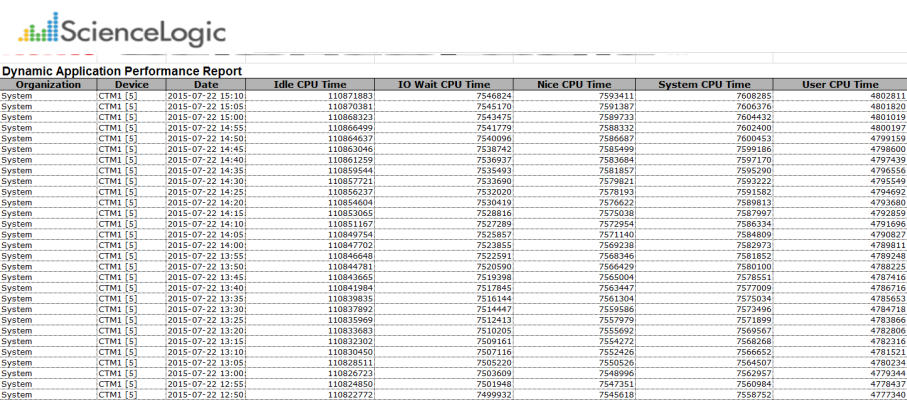
This report displays the collected data from the specified Dynamic Application on each selected device. The first report, Sheet 1: Source Data, displays organization or group, device, date, and the specified collection objects.
The second report, Sheet 2: Control, displays the default rows of Description, Report Version, Generated On, Organizations or Groups, Devices, Dynamic Application, Collection Objects, Categories, Start Date, and Duration.
You can customize the output of the report by selecting devices by group or organization, and selecting the time span of the report.
The following input options are available for this report:
- Selected By: Select the devices that will appear in the report. The following input elements appear in this component:
- Org/Device; Group/Device. Your selection will have an affect on the fields described below.
- Org/Device. When selected, you have the option to select all, multiple, or individual organizations, then you can optionally select specific devices in those organizations.
- Group/Device. When selected, you have the option to select all, multiple, or individual device groups, then you can optionally select specific devices in the device group(s).
You can further reduce the list of devices to include on the report. Depending on your selection in the Org/Device;Group/Device; radio buttons, you can select specific devices from the organizations or device groups you selected in the Organizations/Groups list. Use the following fields if you want to select individual items:
- Select individual devices. Select this checkbox if you would like to select the individual devices to include in the report. The devices will change based on the selection in the Dynamic Application field. You can only select devices that are aligned to the selected Dynamic Application.
- Dynamic Application. Select a Dynamic Application to include in the report. Your selection will change the values displayed in the Collection Objects and Select Individual Devices fields.
- Collection Objects. Select one, multiple, or all collection objects associated with the Dynamic Application.
- Categories. By default, all device categories will be included in the report. Select the Select individual categories checkbox to select one or more device categories.
- Report Span. Specify a Daily, Weekly, or Monthly span to include in the report.
- Starting. Use the Year, Month, and Date fields to specify a Start Date for the report. The Skylar One (formerly SL1) system will use data from that date as the starting point of the report.
- Duration. Specify the duration for the report, from 1 month to 36 months. The Skylar One system will use data from the Starting date as the start point of the report and data from the last day of the Duration as the ending point of the report.
- Timezone. Specify the timezone to use for date and time values in the report. Specify the timezone by number of hours offset from UTC.
This description covers the latest version of this report as shipped by ScienceLogic. This report might have been modified on your Skylar One system.
Devices > Performance Multi-Device
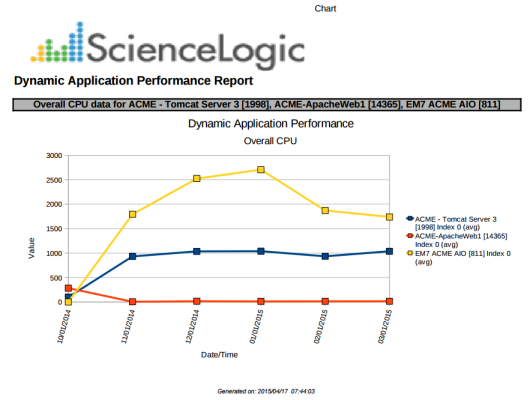
This report displays the collected data from one presentation object from a selected Dynamic Application on one or more selected devices. If you select a time span of one day, the report displays raw data. If you select a weekly or monthly time span, the report displays normalized data, with one value per day.
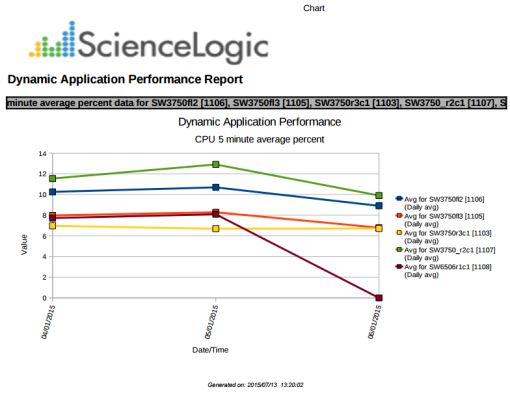
The first report, Sheet 1: Chart, displays a single chart. The single chart displays the value of the single presentation object on each selected device. The chart displays a single line for each device. For presentation objects that return multiple values (indexes), you must specify an instance normalization so that the chart will contain only one line per device.
The second report, Sheet 2: Source, displays a single table for all selected devices. The table displays a column for each device and a row for each time interval. If you selected a time span of one day, the report displays raw data, at the interval at which it was collected. If you selected a weekly or monthly time span, the report displays normalized data, with one value per day.
The third report, Sheet 3: Control, displays the default rows of Description, Report Version, Generated On, Organizations or Groups, Devices, Dynamic Application, Presentation Object, Categories, Start Date, and Duration.
You can customize the output of the report by selecting devices by device group or by organization, filtering the list of devices by device category, selecting the time span of the report, specifying the data normalization (average, sum, minimum, maximum), and instance normalization.
The following input options are available for this report:
- Dynamic Application. Select a Dynamic Application to include in the report. Your selection will change the values displayed in the Presentation Objectand Selected By fields.
- Presentation Object. Select one presentation object from the list of presentation objects in the selected Dynamic Application.
- Selected By: Select the devices that will appear in the report. The following input elements appear in this component:
- Group by Organization; Group by Device Class. Specifies how you want devices to appear in the list of devices in the selection field and in the report.
- Group by Organization. When selected, you have the option to select all, multiple, or individual organizations, then you can optionally select specific devices in those organizations.
- Group by Device Class. When selected, you have the option to select all, multiple, or individual device groups, then you can optionally select specific devices in the device classes(s).
- Categories. To select individual categories to include in the report, select the Select individual categories checkbox, and select the desired categories from the box below.
- Report Span. Specify a Daily, Weekly, or Monthly span to include in the report.
- Starting. Use the Year, Month, and Date fields to specify a Start Date for the report. The Skylar One (formerly SL1) system will use data from that date as the starting point of the report.
- Duration. Specify the duration for the report, from 1 month to 36 months. The Skylar One system will use data from the Starting date as the start point of the report and data from the last day of the Duration as the ending point of the report.
- Timezone. Specify the timezone to use for date and time values in the report. Specify the timezone by number of hours offset from UTC.
- Data Normalization. Specifies the method for creating a daily value for each presentation object. If you selected Daily in the Report Span fields, the report displays a raw value for the presentation object, at the interval at which each value was collected. If you selected Weekly or Monthly in the Report Span fields, the report displays a single normalized value per day for the selected presentation object. In the Data Normalization field, you can specify whether you want the report to include:
- Daily Average. Average of all the values for a presentation object for each 24-hour period.
- Daily Sum. Sum of all the values for a presentation object for each 24-hour period.
- Daily Minimum. Minimum value of all the values for a presentation object for each 24-hour period.
- Daily Maximum. Maximum value of all the values for a presentation object for each 24-hour period.
- Instance Normalization. For presentation objects that return multiple values (indexes), specifies which value to use for each instance. Choices are:
- Maximum. Use the highest value collected at each collection interval. If you selected Weekly or Monthly in the Report Span fields, the report uses these maximum values to calculate the a single normalized value per day (specified in the Data Normalization field) for the selected presentation object.
- Minimum. Use the lowest value collected at each collection interval. If you selected Weekly or Monthly in the Report Span fields, the report uses these minimum values to calculate a single normalized value per day (specified in the Data Normalization field) for the selected presentation object.
- Average. Calculate the average of all values collected at a single collection interval. If you selected Weekly or Monthly in the Report Span fields, the report uses these average values to calculate the a single normalized value per day (specified in the Data Normalization field) for the selected presentation object.
This description covers the latest version of this report as shipped by ScienceLogic. This report might have been modified on your Skylar One system.
Devices > Performance Multi-Device/Instance
This report displays the collected data from one presentation object from a selected Dynamic Application on one or more selected devices. If you select a time span of one day, the report displays raw data. If you select a weekly or monthly time span, the report displays normalized data, with one value per day.
The first report, Sheet 1: Chart, displays a single chart. The single chart displays the value of the single presentation object on each selected device. The chart displays a single line for each device. For presentation objects that return multiple values (indexes), the chart will include a line for each index.
The second report, Sheet 2: Source, displays a single table for all selected devices. The table displays a column for each device and a row for each time interval. For presentation objects that return multiple values (indexes), the chart will include a column for each index on each device. If you selected a time span of one day, the report displays raw data, at the interval at which it was collected. If you selected a weekly or monthly time span, the report displays normalized data, with one value per day.
The third report, Sheet 3: Control, displays the default rows of Description, Report Version, Generated On, Organizations or Groups, Devices, Dynamic Application, Presentation Object, Categories, Start Date, and Duration.
You can customize the output of the report by selecting devices by device group or by organization, filtering the list of devices by device category, selecting the time span of the report, and specifying the data normalization (average, sum, minimum, maximum).
The following input options are available for this report:
- Select By: Select the devices that will appear in the report. The following input elements appear in this component:
- Org/Device; Group/Device. Your selection will have an affect on the fields described below.
- Org/Device. When selected, you have the option to select all, multiple, or individual organizations, then you can optionally select specific devices in those organizations.
- Group/Device. When selected, you have the option to select all, multiple, or individual device groups, then you can optionally select specific devices in the device group(s).
You can further reduce the list of devices to include on the report. Depending on your selection in the Org/Device;Group/Device; radio buttons, you can select specific devices from the organizations or device groups you selected in the Organizations/Groups list. Use the following fields if you want to select individual items:
- Select individual devices. Select this checkbox if you would like to select the individual devices to include in the report. The devices will change based on the selection in the Dynamic Application field. You can select only devices that are aligned to the selected Dynamic Application.
- Dynamic Application. Select a Dynamic Application to include in the report. Your selection will change the values displayed in the Presentation Objects and Select Individual Devices fields.
- Presentation Object. Select one presentation object from the list of presentation objects in the selected Dynamic Application.
- Categories. By default, all device categories will be included in the report. Select the Select individual categories checkbox to select one or more device categories.
- Report Span. Specify a Daily, Weekly, or Monthly span to include in the report.
- Starting. Use the Year, Month, and Date fields to specify a Start Date for the report. The Skylar One (formerly SL1) system will use data from that date as the starting point of the report.
- Duration. Specify the duration for the report, from 1 month to 36 months. The Skylar One system will use data from the Starting date as the start point of the report and data from the last day of the Duration as the ending point of the report.
- Timezone. Specify the timezone to use for date and time values in the report. Specify the timezone by number of hours offset from UTC.
- Data Normalization. Specifies the method for creating a daily value for each presentation object. If you selected Daily in the Report Span fields, the report displays raw value for the presentation object, at the interval at which each value was collected. If you selected Weekly or Monthly in the Report Span fields, the report displays a single normalized value per day for the selected presentation object. In the Data Normalization field, you can specify whether you want the report to include:
- Daily Average. Average of all the values for a presentation object for each 24-hour period.
- Daily Sum. Sum of all the values for a presentation object for each 24-hour period.
- Daily Minimum. Minimum value of all the values for a presentation object for each 24-hour period.
- Daily Maximum. Maximum value of all the values for a presentation object for each 24-hour period.
This description covers the latest version of this report as shipped by ScienceLogic. This report might have been modified on your Skylar One system.
Devices > Performance Multi-Device/Object
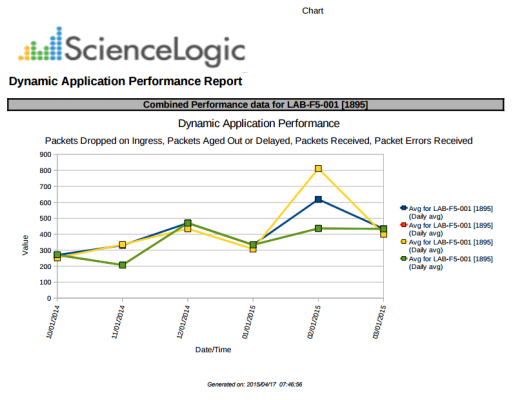
This report displays the collected data from one or more presentation objects from a selected Dynamic Application on one or more selected devices. If you select a time span of one day, the report displays raw data. If you select a weekly or monthly time span, the report displays normalized data, with one value per day.
The first report, Sheet 1: Chart, displays a single chart that shows each selected device. The chart displays a line for each selected presentation object on each device, over time. Each chart displays a single line for each presentation object. For presentation objects that return multiple values (indexes), you must specify an instance normalization so that the chart will contain only one line per presentation object/device.
The second report, Sheet 2: Source, displays a single table for all selected devices. The table displays a column for each presentation object on each device and a row for each time interval. If you selected a time span of one day, the report displays raw data, at the interval at which it was collected. If you selected a weekly or monthly time span, the report displays normalized data, with one value per day.
The third report, Sheet 3: Control, displays the default rows of Description, Report Version, Generated On, Organizations or Groups, Devices, Dynamic Application, Presentation Object, Categories, Start Date, and Duration.
You can customize the output of the report by selecting devices by device group or by organization, filtering the list of devices by device category, selecting the time span of the report, specifying the data normalization (average, sum, minimum, maximum) and instance normalization.
The following input options are available for this report:
- Select By: Select the devices that will appear in the report. The following input elements appear in this component:
- Org/Device; Group/Device. Your selection will have an affect on the fields described below.
- Org/Device. When selected, you have the option to select all, multiple, or individual organizations, then you can optionally select specific devices in those organizations.
- Group/Device. When selected, you have the option to select all, multiple, or individual device groups, then you can optionally select specific devices in the device group(s).
You can further reduce the list of devices to include on the report. Depending on your selection in the Org/Device;Group/Device; radio buttons, you can select specific devices from the organizations or device groups you selected in the Organizations/Groups list. Use the following fields if you want to select individual items:
- Select individual devices. Select this checkbox if you would like to select the individual devices to include in the report. The devices will change based on the selection in the Dynamic Application field. You can select only devices that are aligned to the selected Dynamic Application.
- Dynamic Application. Select a Dynamic Application to include in the report. Your selection will change the values displayed in the Presentation Objects and Select Individual Devices fields.
- Presentation Objects. Select one or more presentation objects from the list of presentation objects in the selected Dynamic Application. To select multiple presentation objects, hold the <Shift> key while selecting with the mouse.
- Categories. By default, all device categories will be included in the report. Select the Select individual categories checkbox to select one or more device categories.
- Report Span. Specify a Daily, Weekly, or Monthly span to include in the report.
- Starting. Use the Year, Month, and Date fields to specify a Start Date for the report. The Skylar One (formerly SL1) system will use data from that date as the starting point of the report.
- Duration. Specify the duration for the report, from 1 month to 36 months. The Skylar One system will use data from the Starting date as the start point of the report and data from the last day of the Duration as the ending point of the report.
- Timezone. Specify the timezone to use for date and time values in the report. Specify the timezone by number of hours offset from UTC.
- Data Normalization. Specifies the method for creating a daily value for each presentation object. If you selected Daily in the Report Span fields, the report displays raw value for the presentation object, at the interval at which each value was collected. If you selected Weekly or Monthly in the Report Span fields, the report displays a single normalized value per day for the selected presentation object. In the Data Normalization field, you can specify whether you want the report to include:
- Daily Average. Average of all the values for a presentation object for each 24-hour period.
- Daily Sum. Sum of all the values for a presentation object for each 24-hour period.
- Daily Minimum. Minimum value of all the values for a presentation object for each 24-hour period.
- Daily Maximum. Maximum value of all the values for a presentation object for each 24-hour period.
- Instance Normalization. For presentation objects that return multiple values (indexes), specifies which value to use for each instance. Choices are:
- Maximum. Use the highest value collected at each collection interval. If you selected Weekly or Monthly in the Report Span fields, the report uses these maximum values to calculate a single normalized value per day (specified in the Data Normalization field) for the selected presentation object.
- Minimum. Use the lowest value collected at each collection interval. If you selected Weekly or Monthly in the Report Span fields, the report uses these minimum values to calculate a single normalized value per day (specified in the Data Normalization field) for the selected presentation object.
- Average. Calculate the average of all values collected at a single collection interval. If you selected Weekly or Monthly in the Report Span fields, the report uses these average values to calculate a single normalized value per day (specified in the Data Normalization field) for the selected presentation object.
This description covers the latest version of this report as shipped by ScienceLogic. This report might have been modified on your Skylar One system.
Devices > Performance Multi-Device/Object/Instance
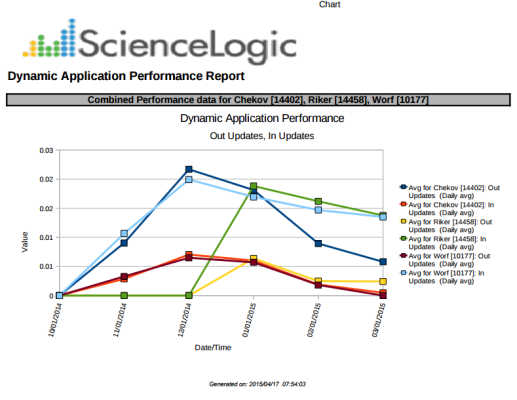
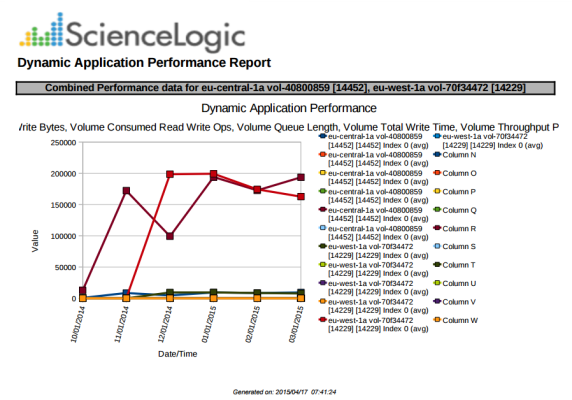
This report displays the collected data from one or more presentation objects from a selected Dynamic Application on one or more selected devices. If you select a time span of one day, the report displays raw data. If you select a weekly or monthly time span, the report displays normalized data, with one value per day.
The first report, Sheet 1: Chart, displays a single chart that shows each selected device. The chart displays a line for each selected presentation object on each device, over time. For presentation objects that return multiple values (indexes), the chart displays a line for each index on each device.
The second report, Sheet 2: Source, displays a single table for all selected devices. The table displays a column for each presentation object on each device and a row for each time interval. For presentation objects that return multiple values (indexes), the table will include a column for each index. If you selected a time span of one day, the report displays raw data, at the interval at which it was collected. If you selected a weekly or monthly time span, the report displays normalized data, with one value per day.
The third report, Sheet 3: Control, displays the default rows of Description, Report Version, Generated On, Organizations or Groups, Devices, Dynamic Application, Presentation Object, Categories, Start Date, and Duration.
You can customize the output of the report by selecting devices by device group or by organization, filtering the list of devices by device category, selecting the time span of the report, and specifying the data normalization (average, sum, minimum, maximum).
The following input options are available for this report:
- Selected By: Select the devices that will appear in the report. The following input elements appear in this component:
- Org/Device; Group/Device. Your selection will have an affect on the fields described below.
- Org/Device. When selected, you have the option to select all, multiple, or individual organizations, then you can optionally select specific devices in those organizations.
- Group/Device. When selected, you have the option to select all, multiple, or individual device groups, then you can optionally select specific devices in the device group(s).
You can further reduce the list of devices to include on the report. Depending on your selection in the Org/Device;Group/Device; radio buttons, you can select specific devices from the organizations or device groups you selected in the Organizations/Groups list. Use the following fields if you want to select individual items:
- Select individual devices. Select this checkbox if you would like to select the individual devices to include in the report. The devices will change based on the selection in the Dynamic Application field. You can select only devices that are aligned to the selected Dynamic Application.
- Dynamic Application. Select a Dynamic Application to include in the report. Your selection will change the values displayed in the Presentation Objects and Select Individual Devices fields.
- Presentation Objects. Select one or more presentation objects from the list of presentation objects in the selected Dynamic Application. To select multiple presentation objects, hold the <Shift> key while selecting with the mouse.
- Categories. By default, all device categories will be included in the report. Select the Select individual categories checkbox to select one or more device categories.
- Report Span. Specify a Daily, Weekly, or Monthly span to include in the report.
- Starting. Use the Year, Month, and Date fields to specify a Start Date for the report. The Skylar One (formerly SL1) system will use data from that date as the starting point of the report.
- Duration. Specify the duration for the report, from 1 month to 36 months. The Skylar One system will use data from the Starting date as the start point of the report and data from the last day of the Duration as the ending point of the report.
- Timezone. Specify the timezone to use for date and time values in the report. Specify the timezone by number of hours offset from UTC.
- Data Normalization. Specifies the method for creating a daily value for each presentation object. If you selected Daily in the Report Span fields, the report displays raw value for the presentation object, at the interval at which each value was collected. If you selected Weekly or Monthly in the Report Span fields, the report displays a single normalized value per day for the selected presentation object. In the Data Normalization field, you can specify whether you want the report to include:
- Daily Average. Average of all the values for a presentation object for each 24-hour period.
- Daily Sum. Sum of all the values for a presentation object for each 24-hour period.
- Daily Minimum. Minimum value of all the values for a presentation object for each 24-hour period.
- Daily Maximum. Maximum value of all the values for a presentation object for each 24-hour period.
This description covers the latest version of this report as shipped by ScienceLogic. This report might have been modified on your Skylar One system.
Devices > Performance Multi-Object
This report displays the collected data from one or more presentation objects from a selected Dynamic Application on one or more selected devices. If you select a timespan of one day, the report displays raw data. If you select a weekly or monthly time span, the report displays normalized data, with one value per day.
The first report, Sheet 1: Chart, displays a chart for each selected device. The chart for each device displays a line for the value of each selected presentation object, over time. Each chart displays a single line for each presentation object. For presentation objects that return multiple values (indexes), you must specify an instance normalization so that the chart will contain only one line per presentation object.
The second report, Sheet 2: Source, displays a table for each selected device. The table for each device displays a column for each presentation object and a row for each time interval. If you selected a time span of one day, the report displays raw data, at the interval at which it was collected. If you selected a weekly or monthly time span, the report displays normalized data, with one value per day.
The third report, Sheet 3: Control, displays the default rows of Description, Report Version, Generated On, Organizations or Groups, Devices, Dynamic Application, Presentation Object, Categories, Start Date, and Duration.
You can customize the output of the report by selecting devices by device group or by organization, filtering the list of devices by device category, selecting the time span of the report, specifying the data normalization (average, sum, minimum, maximum) and instance normalization.
The following input options are available for this report:
- Selected By: Select the devices that will appear in the report. The following input elements appear in this component:
- Org/Device; Group/Device. Your selection will have an affect on the fields described below.
- Org/Device. When selected, you have the option to select all, multiple, or individual organizations, then you can optionally select specific devices in those organizations.
- Group/Device. When selected, you have the option to select all, multiple, or individual device groups, then you can optionally select specific devices in the device group(s).
You can further reduce the list of devices to include on the report. Depending on your selection in the Org/Device;Group/Device; radio buttons, you can select specific devices from the organizations or device groups you selected in the Organizations/Groups list. Use the following fields if you want to select individual items:
- Select individual devices. Select this checkbox if you would like to select the individual devices to include in the report. The devices will change based on the selection in the Dynamic Application field. You can select only devices that are aligned to the selected Dynamic Application.
- Dynamic Application. Select a Dynamic Application to include in the report. Your selection will change the values displayed in the Presentation Objects and Select Individual Devices fields.
- Presentation Objects. Select one or more presentation objects from the list of presentation objects in the selected Dynamic Application. To select multiple presentation objects, hold the <Shift> key while selecting with the mouse.
- Categories. By default, all device categories will be included in the report. Select the Select individual categories checkbox to select one or more device categories.
- Report Span. Specify a Daily, Weekly, or Monthly span to include in the report.
- Starting. Use the Year, Month, and Date fields to specify a Start Date for the report. The Skylar One (formerly SL1) system will use data from that date as the starting point of the report.
- Duration. Specify the duration for the report, from 1 month to 36 months. The Skylar One system will use data from the Starting date as the start point of the report and data from the last day of the Duration as the ending point of the report.
- Timezone. Specify the timezone to use for date and time values in the report. Specify the timezone by number of hours offset from UTC.
- Data Normalization. Specifies the method for creating a daily value for each presentation object. If you selected Daily in the Report Span fields, the report displays raw value for the presentation object, at the interval at which each value was collected. If you selected Weekly or Monthly in the Report Span fields, the report displays a single normalized value per day for the selected presentation object. In the Data Normalization field, you can specify whether you want the report to include:
- Daily Average. Average of all the values for a presentation object for each 24-hour period.
- Daily Sum. Sum of all the values for a presentation object for each 24-hour period.
- Daily Minimum. Minimum value of all the values for a presentation object for each 24-hour period.
- Daily Maximum. Maximum value of all the values for a presentation object for each 24-hour period.
- Instance Normalization. For presentation objects that return multiple values (indexes), specifies which value to use for each instance. Choices are:
- Maximum. Use the highest value collected at each collection interval. If you selected Weekly or Monthly in the Report Span fields, the report uses these maximum values to calculate the a single normalized value per day (specified in the Data Normalization field) for the selected presentation object.
- Minimum. Use the lowest value collected at each collection interval. If you selected Weekly or Monthly in the Report Span fields, the report uses these minimum values to calculate a single normalized value per day (specified in the Data Normalization field) for the selected presentation object.
- Average. Calculate the average of all values collected at a single collection interval. If you selected Weekly or Monthly in the Report Span fields, the report uses these average values to calculate the a single normalized value per day (specified in the Data Normalization field) for the selected presentation object.
- Max Number of Devices. Specify the maximum number of devices to include in the report. Skylar One searches for devices alphabetically, first alphabetically by Organization or Device Group, as specified in the Selected By field, then within the Organization or Device Group, alphabetically by device name.
- Offset from first record. Specify the number of devices to skip before including devices in the report. You must know the first record that Skylar One will find before you can specify a value in this field.
This description covers the latest version of this report as shipped by ScienceLogic. This report might have been modified on your Skylar One system.
Devices > Performance Multi-Object/Instance
This report displays the collected data from one or more presentation objects from a selected Dynamic Application on one or more selected devices. If you select a time span of one day, the report displays raw data. If you select a weekly or monthly time span, the report displays normalized data, with one value per day.
The first report, Sheet 1: Chart, displays a chart for each selected device. The chart for each device displays the value of the selected presentation objects over time. For presentation objects that return multiple values (indexes), the chart for each selected device will include multiple lines for those presentation objects, one for each instance.
The second report, Sheet 2: Source, displays a table for each selected device. The table for each device displays a column for each presentation object. For presentation objects that return multiple values (indexes), the table will include a column for each index. If you selected a time span of one day, the report displays raw data, at the interval at which it was collected. If you selected a weekly or monthly time span, the report displays normalized data, with one value per day.
The third report, Sheet 3: Control, displays the default rows of Description, Report Version, Generated On, Organizations or Groups, Devices, Dynamic Application, Presentation Object, Categories, Start Date, and Duration.
You can customize the output of the report by selecting devices by device group or by organization, filtering the list of devices by device category, selecting the time span of the report, and specifying the data normalization (average, sum, minimum, maximum).
The following input options are available for this report:
- Selected By: Select the devices that will appear in the report. The following input elements appear in this component:
- Org/Device; Group/Device. Your selection will have an affect on the fields described below.
- Org/Device. When selected, you have the option to select all, multiple, or individual organizations, then you can optionally select specific devices in those organizations.
- Group/Device. When selected, you have the option to select all, multiple, or individual device groups, then you can optionally select specific devices in the device group(s).
You can further reduce the list of devices to include on the report. Depending on your selection in the Org/Device;Group/Device; radio buttons, you can select specific devices from the organizations or device groups you selected in the Organizations/Groups list. Use the following fields if you want to select individual items:
- Select individual devices. Select this checkbox if you would like to select the individual devices to include in the report. The devices will change based on the selection in the Dynamic Application field. You can select only devices that are aligned to the selected Dynamic Application.
- Dynamic Application. Select a Dynamic Application to include in the report. Your selection will change the values displayed in the Presentation Objects and Select Individual Devices fields.
- Presentation Objects. Select one or more presentation objects from the list of presentation objects in the selected Dynamic Application. To select multiple presentation objects, hold the <Shift> key while selecting with the mouse.
- Categories. By default, all device categories will be included in the report. Select the Select individual categories checkbox to select one or more device categories.
- Report Span. Specify a Daily, Weekly, or Monthly span to include in the report.
- Starting. Use the Year, Month, and Date fields to specify a Start Date for the report. The Skylar One (formerly SL1) system will use data from that date as the starting point of the report.
- Duration. Specify the duration for the report, from 1 month to 36 months. The Skylar One system will use data from the Starting date as the start point of the report and data from the last day of the Duration as the ending point of the report.
- Timezone. Specify the timezone to use for date and time values in the report. Specify the timezone by number of hours offset from UTC.
- Data Normalization. Specifies the method for creating a daily value for each presentation object. If you selected Daily in the Report Span fields, the report displays raw value for the presentation object, at the interval at which each value was collected. If you selected Weekly or Monthly in the Report Span fields, the report displays a single normalized value per day for the selected presentation object. In the Data Normalization field, you can specify whether you want the report to include:
- Daily Average. Average of all the values for a presentation object for each 24-hour period.
- Daily Sum. Sum of all the values for a presentation object for each 24-hour period.
- Daily Minimum. Minimum value of all the values for a presentation object for each 24-hour period.
- Daily Maximum. Maximum value of all the values for a presentation object for each 24-hour period.
This description covers the latest version of this report as shipped by ScienceLogic. This report might have been modified on your Skylar One system.
Devices > Performance Single Object
This report displays the collected data from a single presentation object from a selected Dynamic Application on one or more selected devices. If you select a time span of one day, the report displays raw data. If you select a weekly or monthly time span, the report displays normalized data, with one value per day.
The first report, Sheet 1: Chart, displays a chart for each selected device. The chart for each device displays the value of the selected presentation object over time. For presentation objects that return multiple values (indexes), the chart for each selected device will include multiple lines, one for each instance.
The second report, Sheet 2: Source, displays a table for each selected device. The table for each device displays a column for each value at each time interval. For presentation objects that return multiple values (indexes), the table will include a column for each index. If you selected a time span of one day, the report displays raw data, at the interval at which it was collected. If you selected a weekly or monthly time span, the report displays normalized data, with one value per day.
The third report, Sheet 3: Control, displays the default rows of Description, Report Version, Generated On, Organizations or Groups, Devices, Dynamic Application, Presentation Object, Categories, Start Date, and Duration.
You can customize the output of the report by selecting devices by device group or by organization, filtering the list of devices by device category, selecting the time span of the report, and specifying the normalization (average, sum, minimum, maximum).
The following input options are available for this report:
- Selected By: Select the devices that will appear in the report. The following input elements appear in this component:
- Org/Device; Group/Device. Your selection will have an affect on the fields described below.
- Org/Device. When selected, you have the option to select all, multiple, or individual organizations, then you can optionally select specific devices in those organizations.
- Group/Device. When selected, you have the option to select all, multiple, or individual device groups, then you can optionally select specific devices in the device group(s).
You can further reduce the list of devices to include on the report. Depending on your selection in the Org/Device;Group/Device; radio buttons, you can select specific devices from the organizations or device groups you selected in the Organizations/Groups list. Use the following fields if you want to select individual items:
- Select individual devices. Select this checkbox if you would like to select the individual devices to include in the report. The devices will change based on the selection in the Dynamic Application field. You can select only devices that are aligned to the selected Dynamic Application.
- Dynamic Application. Select a Dynamic Application to include in the report. Your selection will change the values displayed in the Presentation Object and Select Individual Devices fields.
- Presentation Object. Select a single presentation object from the list of presentation objects in the selected Dynamic Application.
- Categories. By default, all device categories will be included in the report. Select the Select individual categories checkbox to select one or more device categories.
- Report Span. Specify a Daily, Weekly, or Monthly span to include in the report.
- Starting. Use the Year, Month, and Date fields to specify a Start Date for the report. The Skylar One (formerly SL1) system will use data from that date as the starting point of the report.
- Duration. Specify the duration for the report, from 1 month to 36 months. The Skylar One system will use data from the Starting date as the start point of the report and data from the last day of the Duration as the ending point of the report.
- Timezone. Specify the timezone to use for date and time values in the report. Specify the timezone by number of hours offset from UTC.
- Data Normalization. Specifies the method for creating a daily value for each presentation object. If you selected Daily in the Report Span fields, the report displays raw value for the presentation object, at the interval at which each value was collected. If you selected Weekly or Monthly in the Report Span fields, the report displays a single normalized value per day for the selected presentation object. In the Data Normalization field, you can specify whether you want the report to include:
- Daily Average. Average of all the values for a presentation object for each 24-hour period.
- Daily Sum. Sum of all the values for a presentation object for each 24-hour period.
- Daily Minimum. Minimum value of all the values for a presentation object for each 24-hour period.
- Daily Maximum. Maximum value of all the values for a presentation object for each 24-hour period.
This description covers the latest version of this report as shipped by ScienceLogic. This report might have been modified on your Skylar One system.
Devices > Software List
For selected devices, assets, or ESX Server and Guest VMs, this report displays a list of installed software and the install date. For each device, asset or ESX Server and Guest VM, the report displays Software Title and Install Date.
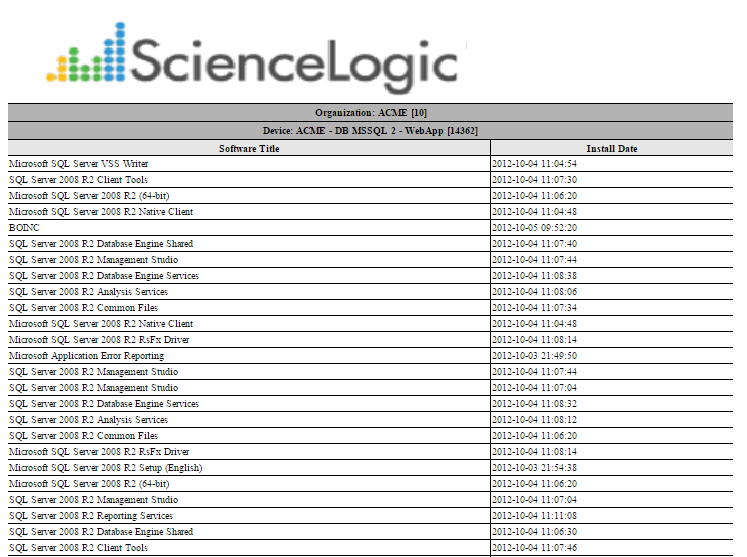
The following input options are available when generating the report:
- Select By. Select the devices that will appear in the report. The following input elements appear in this component:
- Org/Device; Org/Asset; ESX Server/VM. Your selection will have an affect on the fields described below.
- Org/Device. When selected, you have the option to select all, multiple, or individual organizations, then you can optionally select specific devices in those organizations.
- Org/Asset. When selected, you have the option to select all, multiple, or individual organizations, then you can optionally select specific assets in those organizations.
- ESX Server/VM. When selected, you will have the option to select all, multiple, or individual ESX Servers, then you can optionally select specific Guest VMs on those ESX Servers.
- All Items. Select this checkbox if you want all devices in the system to be included in this report.
- Organizations/ESX Server. If the All Items checkbox is unselected, select multiple or individual Organizations or ESX servers. The report will contain only the devices in the organizations you select, or only Guest VMs on the ESX servers you select. You can further filter the list of devices or guest VMs by selecting the Select individual items checkbox.
You can further reduce the list of assets to include on the report. Depending on your selection in the Org/Device; Org/Asset; ESX Server/VM radio buttons, you can select specific assets, devices, or Guest VMs from the organizations or ESX servers you selected in the Organizations/ESX Server Select list. Use the following fields if you want to select individual items:
- Select individual items. If the All Items checkbox is unselected, the Select individual items checkbox is available. Select this checkbox if you would like to select the individual Devices, Assets, or Guest VMs to include in the report.
- Devices/Assets by Organization, Guest VMs by ESX Server. Select one or multiple devices or assets by organization, or individual guest VMs by ESX server, to include in the report.
- Device Group Selector. Select one or multiple or all device groups to include in the report.
- Timezone. Select a time zone for the report.
- Separated By. Group software by Organization and/or Device Group.
This description covers the latest version of this report as shipped by ScienceLogic. This report might have been modified on your Skylar One system.
