Network Interfaces > Blackberry: Top-N Interface Statistics
This report displays the collected metrics data from the specified network interfaces on each selected device. You can further customize the output of the report by selecting devices by group and category, and by selecting interfaces by type and tag.
The following input options are available when generating the report:
- Device Selection: Select the devices that will appear in the report. The following input elements appear in this component:
- All devices. Select this checkbox if you want all devices in the system to be included in this report.
- Organizations. If the All devices checkbox is unselected, select multiple or individual Organizations. The report will contain only the devices in the organizations you select. You can further reduce the list of devices to include on the report by specifying devices from the organizations you select, by selecting the Select individual items checkbox.
- Select individual devices. If the All devices checkbox is unselected, the Select individual devices checkbox is available. Select this checkbox if you would like to select the individual devices to include in the report.
- Devices by Organization. If the Select individual devices checkbox is selected, you can select multiple or a single device in the organization(s) selected about to include in the report.
- Device Group Selector. Select one, multiple, or all device groups to include in the report.
- Device Categories. Select one, multiple, or all device categories to include in the report.
- Interface Types. Select one, multiple, or all interface types to include in the report.
- Interface Tags. Select one, multiple, or all interface tags to include in the report. The report will include only interfaces that have the selected tags aligned.
- Interfaces. Select one, multiple, or all network interfaces to include in the report.
- Top-N. Select the top devices based on average performance or maximum performance, and then select the metrics you want to include in the report.
- Report Span. Specify a Daily, Weekly, or Monthly span to include in the report. Specify a Starting date and a Duration for the report. Select a time zone for the report.
This description covers the latest version of this report as shipped by ScienceLogic. This report might have been modified on your SL1 system.
Network Interfaces > Interface Billing
This report displays billing information for selected Bandwidth Billing Policies over a specified time span. For each policy, the report displays default columns of Policy Name, Organization, Department, Billing ID, SKU Number, Calculated On, Calculation Status, Polls Analyzed, Interfaces, Total Megabytes In, Total Megabytes Out, Bill Period, Billing Start Date, Billing End Date, Measurement Type, Base Rate, Base Commitment, Base Amount, Actual Usage, Usage Units, Net Overage, Overate Rate, Overage Amount, and Total Amount Due.
You can customize the output of the report so that only selected columns are displayed.
The above screenshot has been modified to improve clarity.
The following input options are available when generating the report:
- Policy Selection. Select the policies that will appear in the report. The following input elements appear in this component:
- All Policies. Select this checkbox if you want all policies in the system to be included in this report.
- Organizations. If the All Policies checkbox is unselected, select one or more Organizations. The report will contain only the policies in the organizations you select. You can further filter the list of policies by selecting the Select Individual Policies checkbox.
- Select individual policies. If the All Policies checkbox is unselected, the Select individual policies checkbox is available. Select this checkbox if you would like to select individual policies to include in the report.
- Policies by Organization. If the Select individual devices checkbox is selected, the Policies by Organization field is available. Select one or more policies to include in the report.
- Optional Fields. By default, all of the columns in this field are checked. To remove a column from the report, deselect its checkbox.
- Report Span. Specify a Daily, Weekly, or Monthly span to include in the report. Specify a Starting date and a Duration for the report. Select a time zone for the report.
This description covers the latest version of this report as shipped by ScienceLogic. This report might have been modified on your SL1 system.
Network Interfaces > Interface In Use
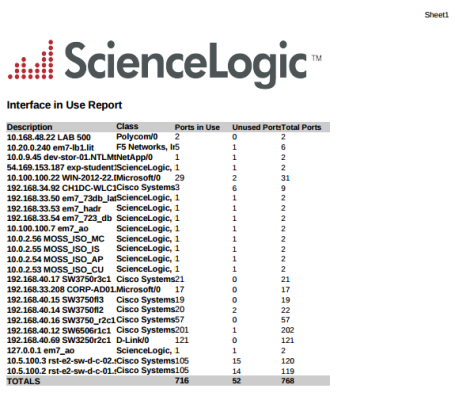
This report displays information about interfaces in use on selected devices, including how many ports are in use, how many unused interfaces are available, and the percentage of full ports.
You can customize the report by adding the optional columns for remote interfaces and remote devices.
The following input options are available when generating the report:
- Select By: Select the interface(s) that will appear in the report. The following input elements appear in this component:
- Org/Device; Org/Network. Your selection will have an affect on the fields described below:
- Org/Device. When selected, you have the option to select all, multiple, or individual organizations, then you can optionally select specific devices in those organizations.
- Org/Network. When selected, with the option to select all, multiple, or individual IP Networks, then you can optionally select specific devices for those IP Networks.
- All Items. Select this checkbox if you want all devices in the system to be included in this report.
- Organizations. If the All Items checkbox is unselected, select one or more Organizations. The report will contain only the devices in the organizations you select. You can further reduce the list of devices to include on the report by selecting individual devices or IP Networks. To do this, select the Select individual items checkbox.
You can further reduce the list of devices to include on the report. Depending on your selection in the Org/Device; Org/Network radio buttons, you can select specific devices or IP Networks from the organizations you selected in the Organizations list. Use the following fields if you want to select individual items:
- Select individual items. If the All Items checkbox is unselected, the Select individual items checkbox is available. Select this checkbox if you would like to select the individual Devices or IP Networks to include in the report.
- Devices/IP Networks by Organization. Select one or multiple devices or IP Networks by organization to include in the report.
- Device Group Selector. Select one or multiple or all device groups to include in the report.
- Optional Columns. Select from the following optional columns to include in the report:
- Remote Device. When selected, this column will display the remote device connected to each interface.
- Remote Interface. When selected, this column will display the remote interface connected to each interface.
- Options. Select from the following options to include in the report. They are all selected by default:
- Show Report Summary. Appears at the top of the report. A list of interfaces with their class, ports in use, unused ports, and total ports.
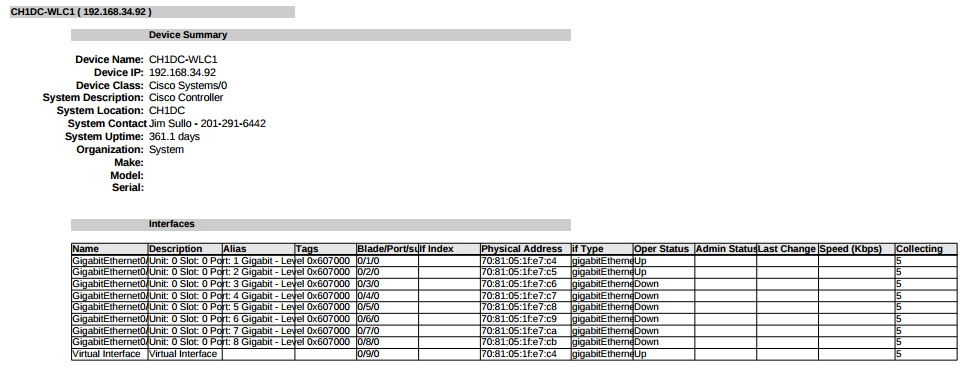
- Show Device Summary. When selected, will appear below the report summary and display a summary of each device included in the report.
- Show Interface Details. When selected, will appear below the report summary and display the name of each device included in the report with details of each interface associated with that device.
- Interfaces currently down only. When selected, will appear below the report summary and display details of interfaces that are currently down.
This description covers the latest version of this report as shipped by ScienceLogic. This report might have been modified on your SL1 system.
Network Interfaces > Interface IP Addresses
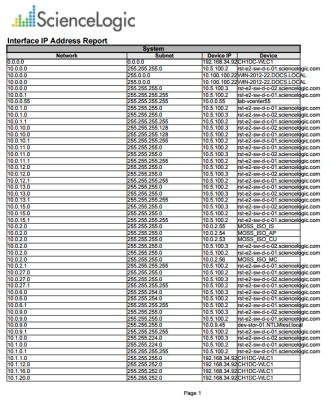
This report displays configuration information for selected IP addresses. For each IP address, this report displays default columns of Network, Subnet, Device IP, and Device.
You can customize the output of the report by selecting the columns to include.
The following input options are available when generating the report:
- IP Network Selection: Select the IP Networks that will appear in the report. The following input elements appear in this component:
- All IP Networks. Select this checkbox if you want all IP Networks in the system to be included in this report.
- Organizations. If the All IP Networks checkbox is unselected, one or more Organizations. The report will contain only the IP Networks in the organizations you select. You can further filter the list of IP Networks to include in the report by, by selecting the Select individual items checkbox and selecting individual IP addresses.
- Select individual items. If the All IP Networks checkbox is unselected, the Select individual items checkbox is available. Select this checkbox if you would like to select the individual IP Networks to include in the report.
- IP Networks by Organization. If the Select individual items checkbox is selected, you can select one or more IP Networks (from the organization(s) selected in Organizations) to include in the report.
- Optional Columns. Select from a list of optional columns to include in their separate columns in the report. Choices include, among others:
- IP Type
- Network Use
- MAC address
- Interface Speed
- Device ID
- IANA Type
This description covers the latest version of this report as shipped by ScienceLogic. This report might have been modified on your SL1 system.
Network Interfaces > Interface IP MAC Map
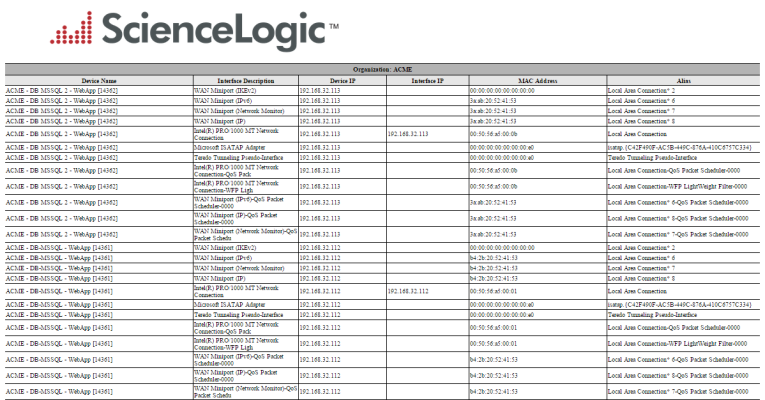
This report displays the MAC and IP Addresses for selected devices. This report is helpful to understand the relationships between devices, interfaces, IP addresses, and MAC addresses. For each device, this report displays default columns of Device Name, Device Groups, Interface Description, Device IP, Interface IP, MAC Address, Alias, Remote Device, Remote Interface Description, and Link Type.
You can customize the output of the report to display only interfaces that match a specific IP or MAC address pattern, to not display NULL IP address, to not display NULL MAC addresses, and to display blade and port information for each device.
The following input options are available when generating the report:
- Device Selection: Select the devices that will appear in the report. The following input elements appear in this component:
- All devices. Select this checkbox if you want all devices in the system to be included in this report.
- Organizations. If the All devices checkbox is unselected, select multiple or individual Organizations. The report will contain only the devices in the organizations you select. You can further reduce the list of devices to include on the report by specifying devices from the organizations you select, by selecting the Select individual items checkbox.
- Select individual devices. If the All devices checkbox is unselected, the Select individual devices checkbox is available. Select this checkbox if you would like to select the individual devices to include in the report.
- Devices by Organization. If the Select individual devices checkbox is selected, you can select multiple or a single device in the organization(s) selected about to include in the report.
- Device Group Selector. Select one or multiple or all device groups to include in the report.
- Interface IP Match Pattern. Specify a regular expression to match against interface IP addresses. Only interfaces with a matching IP address will be displayed in the report.
- MAC Match Pattern. Specify a regular expression to match against interface MAC addresses. Only interfaces with a matching MAC address will be displayed in the report.
- Hide NULL Interface IPs. Not selected by default. If selected, interfaces that do not have an IP address will not appear in the report.
- Hide NULL MAC Addresses. Selected by default. If not selected, interfaces that do not have a MAC address will appear in the report.
- Show Blade/Port. Not selected by default. If selected, the report will show the Blade and Port information for each interface.
- Separated By. Group the report by Organization or Device Group.
This description covers the latest version of this report as shipped by ScienceLogic. This report might have been modified on your SL1 system.
Network Interfaces > Interface Ports
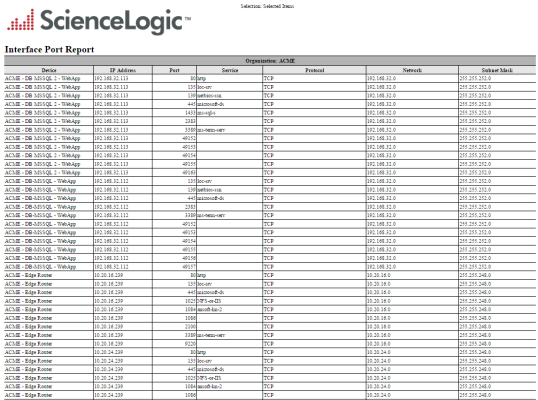
This report displays a list of open ports on all selected devices or all selected networks. For each open port, the report displays default columns of Device, Device Groups, IP Address, Port, Service, Protocol, Network, and Subnet Mask.
You can customize the output of the report so that the port columns - Port, Service, and Protocol - are not included in the report.
The following input options are available when generating the report:
- Select By: Select the devices or Guest VMs that will appear in the report. The following input elements appear in this component:
- Org/Device; Org/Network. Your selection will have an affect on the fields described below:
- Org/Device. When selected, you have the option to select all, multiple, or individual organizations, then you can optionally select specific devices in those organizations.
- Org/Network. When selected, with the option to select all, multiple, or IP Networks, then you can optionally select specific devices for those organizations.
- All Items. Select this checkbox if you want all devices in the system to be included in this report.
- Organizations. If the All Items checkbox is unselected, select multiple or individual Organizations or Networks. The report will contain only the devices in the organizations you select, or only IP Networks you select. You can further reduce the list of devices to include on the report by specifying which devices from the organizations or IP Networks you select, by selecting the Select individual items checkbox.
You can further reduce the list of assets to include on the report. Depending on your selection in the Org/Device; Org/Network radio buttons, you can select specific devices of IP Networks from the organizations you selected in the Organizations list. Use the following fields if you want to select individual items:
- Select individual items. If the All Items checkbox is unselected, the Select individual items checkbox is available. Select this checkbox if you would like to select the individual Devices or IP Networks to include in the report.
- Devices/IP Networks by Organization. Select one or multiple devices or IP Networks by organization, or individual guest VMs by ESX server, to include in the report.
- Device Group Selector. Select one or multiple or all device groups to include in the report.
- Options. If the checkbox is selected, columns for Port, Service, and Protocol will be included in the report. If unselected, the port information will not be included in the report.
- Separated By. Group the report by Organization or Device Group.
This description covers the latest version of this report as shipped by ScienceLogic. This report might have been modified on your SL1 system.
Network Interfaces > Interface Top Metrics
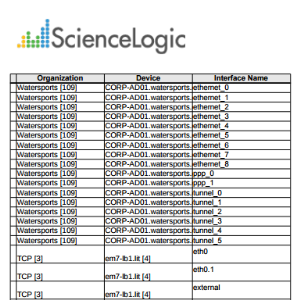
This report displays the top metrics for interfaces on the system. Default columns include Organization; Device; Interface Name; IP Address; Inbound, Outbound, and Total Network Bytes; Inbound, Outbound, and Total Network Packet Loss; and Inbound, Outbound, and Total Network Errored Packed.
The following input options are available when generating the report:
- Select By. Select the devices that will appear in the report. The following input elements appear in this component:
- Org/Device; Org/Asset; ESX Server/VM. Your selection will have an affect on the fields described below.
- Org/Device. When selected, you have the option to select all, multiple, or individual organizations, then you can optionally select specific devices in those organizations.
- Org/Asset. When selected, you have the option to select all, multiple, or individual organizations, then you can optionally select specific assets in those organizations.
- ESX Server/VM. When selected, you will have the option to select all, multiple, or individual ESX Servers, then you can optionally select specific Guest VMs on those ESX Servers.
- All Items. Select this checkbox if you want all devices in the system to be included in this report.
- Organizations/ESX Server. If the All Items checkbox is unselected, select multiple or individual Organizations or ESX servers. The report will contain only the devices in the organizations you select, or only Guest VMs on the ESX servers you select. You can further filter the list of devices or guest VMs by selecting the Select individual items checkbox.
You can further reduce the list of assets to include on the report. Depending on your selection in the Org/Device; Org/Asset; ESX Server/VM radio buttons, you can select specific assets, devices, or Guest VMs from the organizations or ESX servers you selected in the Organizations/ESX Server Select list. Use the following fields if you want to select individual items:
- Select individual items. If the All Items checkbox is unselected, the Select individual items checkbox is available. Select this checkbox if you would like to select the individual Devices, Assets, or Guest VMs to include in the report.
- Devices/Assets by Organization, Guest VMs by ESX Server. Select one or multiple devices or assets by organization, or individual guest VMs by ESX server, to include in the report.
- Device Group Selector. Select one or multiple or all device groups to include in the report.
- Interface Selection Options. The following input elements appear in this component:
- Select Options. Select whether you would like to Manually select the interfaces; Auto-select using the specific threshold; or Auto-select a specific number by their rank.
- Specific Threshold. When the Auto-select using the specific threshold radio button is selected, this section allows you to specify a threshold that all devices must exceed in order to appear in the report.
- Specific Number by Rank. When the Auto-select a specific number by their rank radio button is selected, this allows you to use drop-down menus to indicate that you want the bottom or top 10–1000 devices to appear in the report.
- Optional Columns. This component allows you to select one or more optional columns that you may include in the report.
- Separated By. Group the data by Device Group.
- Report Span. Specify a Daily, Weekly, or Monthly span to include in the report. Specify a Starting date and a Duration for the report. Select a time zone for the report.
This description covers version 1 of this report as shipped by ScienceLogic. This report might have been modified on your SL1 system.
Network Interfaces > Interface Usage
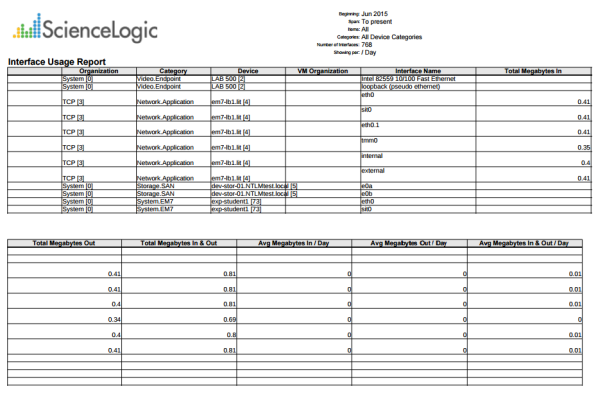
This report displays information about interface usage for each selected device, asset, or VM, including total and average usage.
You can customize the output options to show only interfaces associated with specified organizations and devices, include optional columns such as Interface Speed and Type, and Variables to Display, such as Discards In and Out, Errors In and Out, and Megabytes In and Out.
The above screenshot has been modified to improve clarity.
The following input options are available when generating the report:
- Select By. Select the devices that will appear in the report. The following input elements appear in this component:
- Org/Device; Org/Asset; ESX Server/VM. Your selection will have an affect on the fields described below.
- Org/Device. When selected, you have the option to select all, multiple, or individual organizations, then you can optionally select specific devices in those organizations.
- Org/Asset. When selected, you have the option to select all, multiple, or individual organizations, then you can optionally select specific assets in those organizations.
- ESX Server/VM. When selected, you will have the option to select all, multiple, or individual ESX Servers, then you can optionally select specific Guest VMs on those ESX Servers.
- All Items. Select this checkbox if you want all devices in the system to be included in this report.
- Organizations/ESX Server. If the All Items checkbox is unselected, select multiple or individual Organizations or ESX servers. The report will contain only the devices in the organizations you select, or only Guest VMs on the ESX servers you select. You can further filter the list of devices or guest VMs by selecting the Select individual items checkbox.
You can further reduce the list of assets to include on the report. Depending on your selection in the Org/Device; Org/Asset; ESX Server/VM radio buttons, you can select specific assets, devices, or Guest VMs from the organizations or ESX servers you selected in the Organizations/ESX Server Select list. Use the following fields if you want to select individual items:
- Select individual items. If the All Items checkbox is unselected, the Select individual items checkbox is available. Select this checkbox if you would like to select the individual Devices, Assets, or Guest VMs to include in the report.
- Devices/Assets by Organization, Guest VMs by ESX Server. Select one or multiple devices or assets by organization, or individual guest VMs by ESX server, to include in the report.
- Device Group Selector. Select one or multiple or all device groups to include in the report.
- Device Categories. Further filters the list of devices, assets, or Guest VMs by device category. You can select all device categories or you can select one or more device categories. Only devices, assets, or VMs that belong to the selected device categories will appear in the report.
- Interface Types. Select one, multiple, or all interface types to include in the report.
- Interface Tags. Select one, multiple, or all interface tags. The report will include only interfaces that have the selected tags aligned.
- Optional Columns. Choose from a list of optional columns to include in the report:
- Device IP Address
- Interface Name
- Interface Alias
- MAC Address
- Interface Type
- Interface Tags
- Interface Speed
- Separated By. Group asset records by Organization/ESX Server, Category, Device Group, or Device.
- Report Sections. Specify how the report will be arranged. Select whether you want the report to display Details Only, Totals Only, or Both.
- Report Settings. Select which performance metric to include on the report from the Variable to Display drop-down, including:
- Megabytes In and Out
- Discards In and Out
- Errors In and Out
In the second drop-down menu, select one of the following:
- Show per Day (Mb/day)
- Show per Second (Mb/s)
- Show per Second (Utilization %)
- Select from a list of checkboxes:
- Average by interface. Show total average interface usage for each device, asset, or Guest VM.
- Non-Zero only. Do not show results with zero usage.
- Report Span. Specify a Daily, Weekly, or Monthly span to include in the report. Specify a Starting date and a Duration for the report. Select a time zone for the report.
This description covers the latest version of this report as shipped by ScienceLogic. This report might have been modified on your SL1 system.

