EM7 Administration > Collection Count
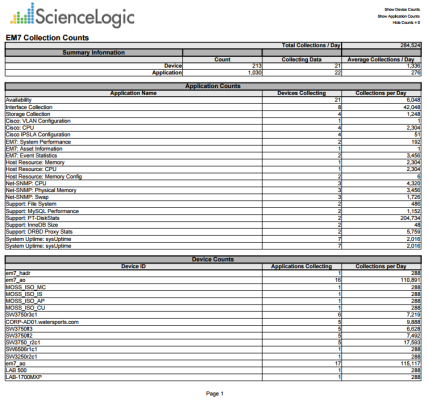
This report displays information about the number of collections performed by SL1. The report can include the following tables:
- A summary of the number of collections being performed by SL1. This table is always included in the report. This table includes the following rows:
- Devices. Displays the number of devices in the system, the number of devices for which SL1 is currently performing collection, and the average number of data points being collected per day for each device.
- Applications. Displays the number of monitoring elements (Dynamic Applications, Monitoring Policies, Availability Collection Policies, Interface Collection Policies, and File System Collection Policies) currently aligned to devices in SL1, the number of monitoring elements for which SL1 is currently performing collection, and the average number of data points being collected per day for each monitoring element.
- A table that displays a list of all monitoring elements (Dynamic Applications, Monitoring Policies, Availability Collection Policies, Interface Collection Policies, and File System Collection Policies) currently aligned to devices in SL1. For each monitoring element, the report displays the number of devices with which that monitoring element is aligned and the average number of data points being collected per day for each monitoring element. This table is optional.
- A table that displays a list of all devices for which SL1 is performing collection. For each device, the report displays the number of monitoring elements aligned with the device and the average number of data points being collected per day for each device. This table is optional.
The following input options are available when generating the report:
- Show Counts by Application. If selected, the table that displays a list of all monitoring elements is included in the report.
- Show Counts by Device. If selected, the table that displays a list of all devices is included in the report.
- Hide Zero Counts. If selected, rows that would have a value of zero in the "Collections per Day" column are excluded from the report.
This description covers the latest version of this report as shipped by ScienceLogic. This report might have been modified on your SL1 system.
EM7 Administration > Config Dynamic App
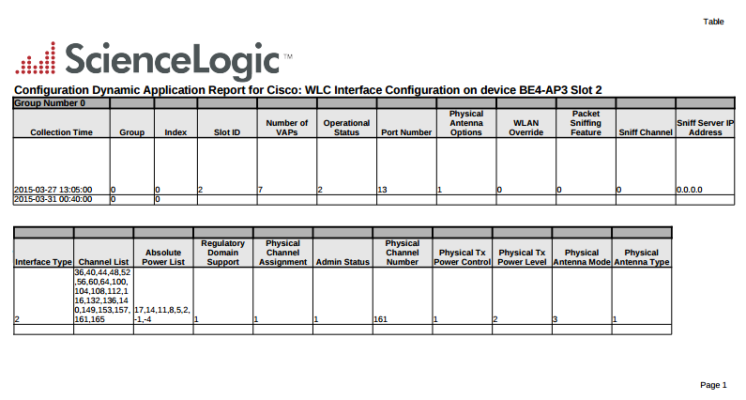
This report displays configuration data collected from a device using a Dynamic Application. For each table of data defined in the Dynamic Application, the report displays columns for collection time, group, and index, plus a column for each collection object.
You can customize the output of the report by specifying which collection objects to include and the time span of data to include.
The above screenshot has been modified to improve clarity.
The following input options are available when generating the report:
- Organizations. Specify one or more organizations or all organizations to include in the report.
- Contents. Specify the configuration Dynamic Application, the collection objects you want to include in the report, and the device for which you want to generate the report.
- Report Span. Specify a Daily, Weekly, or Monthly span to include in the report. Specify a Starting date and a Duration for the report. Select a time zone for the report.
This description covers the latest version of this report as shipped by ScienceLogic. This report might have been modified on your SL1 system.
EM7 Administration > Inactive User
This report shows users that have not logged in after a specified timestamp, or for a user created before the timestamp, whether that user has ever logged in. You can select a date span, such as monthly, weekly, or daily, and from the start date SL1 will calculate the timespan. You can also select a specific date as the starting timestamp for the report.
The report displays users who have logged in during the specific timespan and the timestamp of their last login. You can also choose to list the users' organization, user policy, user policy ID, and user creation date.
The following input options are available when generating the report:
- Organizations. Specify one or more organizations or all organizations to include in the report.
- Report Span. Specify a Daily, Weekly, or Monthly span to include in the report, or select an Absolute Date Time for the timestamp used by the report.
- Optional Columns. You can choose to include the following columns: User Policy, User Policy ID, and User Creation Date.
- Sort by. You can choose to sort by User Name or Last Login, in ascending or descending order.
This description covers the latest version of this report as shipped by ScienceLogic. This report might have been modified on your SL1 system.
EM7 Administration > Journal Dynamic Application Report
This report displays a list of journal entries collected from multiple devices that are aligned with the same journal Dynamic Application. For each journal entry, the report displays the Device ID, Device Name, Organization, Device Group, State, and the collected data associated with the journal entry.
You can customize the output of the report by selecting the devices to include, which pieces of collected data will be displayed, and the time span of the report. You can also limit the report to include only journal entries that have a specific state.
The following input options are available when generating the report:
- Application. Select the journal Dynamic Application for the report in the Select Journal Dynamic Application field and then select one or more pieces of collected data to include in the report in the Select Fields for Report field.
- Devices: Select the devices that will appear in the report. The following input elements appear in this component:
- Org/Device or Grp/Device. Select whether you want to choose devices by organization or by device group.
- All items. Select this checkbox if you want all devices in the system to be included in this report.
- Organizations or Groups. If the All items checkbox is unselected, select one or more organizations or device groups. The report will contain only the devices in the organizations or device groups you select. You can further filter the list of devices to include in the report by selecting devices in the Devices by Organization or Devices by Groups field.
- Select individual items. If the All devices checkbox is unselected, the Select individual devices checkbox is available. Select this checkbox if you would like to select the individual devices to include in the report.
- Devices by Organization or Devices by Group. This field displays a list of all devices in the organizations or device groups selected in the Organizations or Groups field. If the Select individual devices checkbox is selected, you can select one or more devices to include in the report.
- Report Span. Specify a Daily, Weekly, or Monthly span to include in the report. Specify a Starting date and a Duration for the report. Select a time zone for the report.
- Journal States. You can limit the report to include only journal entries that are in specific states. Select the journal entry states to include from the list of all possible journal entry states.
This description covers the latest version of this report as shipped by ScienceLogic. This report might have been modified on your SL1 system.
EM7 Administration > Logged Notifications
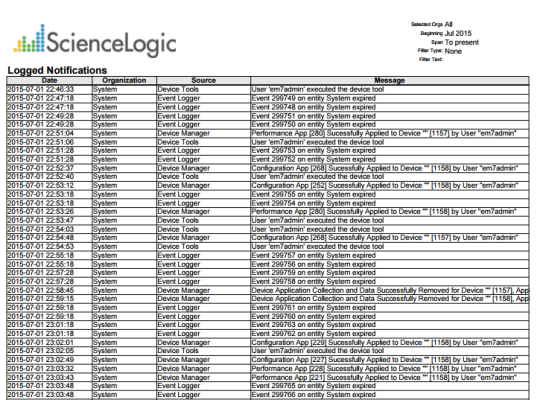
This report displays a list of messages in SL1 audit logs. Each entry includes the message description. The default input options for this report are Date, Organization, Source and Message.
You can customize the output options of the report by filtering that messages that will be displayed in the report, and the sources of the logged messages.
The following input options are available when generating the report:
- Filter Messages By. Specify the messages that will appear in the report based on the text they contain. Choices are:
- Contains. Only log messages that contain the specified text will be included in the report.
- Begins With. Only log messages that begin with the specified text will be included in the report.
- Ends With. Only log messages that end with the specified text will be included in the report.
- Exact Words. Only log messages that match the specified text will be included in the report.
- Report Span. Specify a Daily, Weekly, or Monthly span to include in the report. Specify a Starting date and a Duration for the report. Select a time zone for the report.
- Notification Sources. Select the source of the log notifications. The following input options are available for this component:
- All Sources. Select this checkbox to include all notification sources in the report.
- Notification Sources. If the All Sources checkbox is unselected, this pane is available. Select one or more notification sources to be included in the report.
- Organizations. Select the organizations to be included in the report. The following input options are included in the component:
- All Organizations. Select this checkbox to include all organizations in this report.
- Organizations. If the All Organizations checkbox is unselected, this pane is available. Select one or more organizations to be included in the report.
This description covers the latest version of this report as shipped by ScienceLogic. This report might have been modified on your SL1 system.
EM7 Administration > Missed Polls
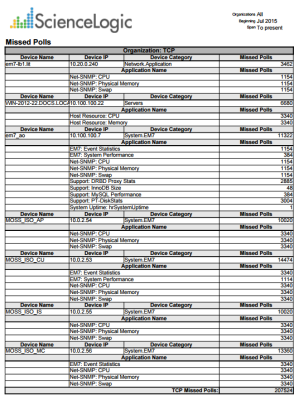
This report displays the missed polls and their related devices in SL1. The default input options are Device Name, Device IP, Device Category, and Missed Polls.
You can customize the output of the report by selecting the time period of missed polls the report displays.
The following input options are available for this report:
- Organizations. Specify one or more organizations or all organizations to include in the report.
- Report Span. Specify a Daily, Weekly, or Monthly span to include in the report. Specify a Starting date and a Duration for the report. Select a time zone for the report.
- Show Missed Polls by Application. If you do not select this checkbox, the report will display the overall number of missed polls for each device. If you select this checkbox, the report will display the overall number of missed polls for each device and a list of Dynamic Applications aligned with each device, with the number of missed polls displayed for each Dynamic Application.
- Show Only Apps with Missed Polls. If you do not select this checkbox, the list of Dynamic Applications aligned with each device will include all Dynamic Applications. If you select this checkbox, the list of Dynamic Applications aligned with each device will include only Dynamic Applications that have a number of missed polls greater than one. This option has no effect if you do not select the Show Missed Polls by Application checkbox.
This description covers the latest version of this report as shipped by ScienceLogic. This report might have been modified on your SL1 system.
EM7 Administration > PowerPack Information
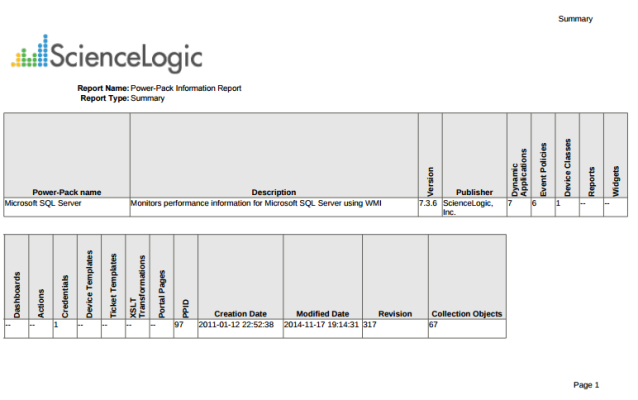
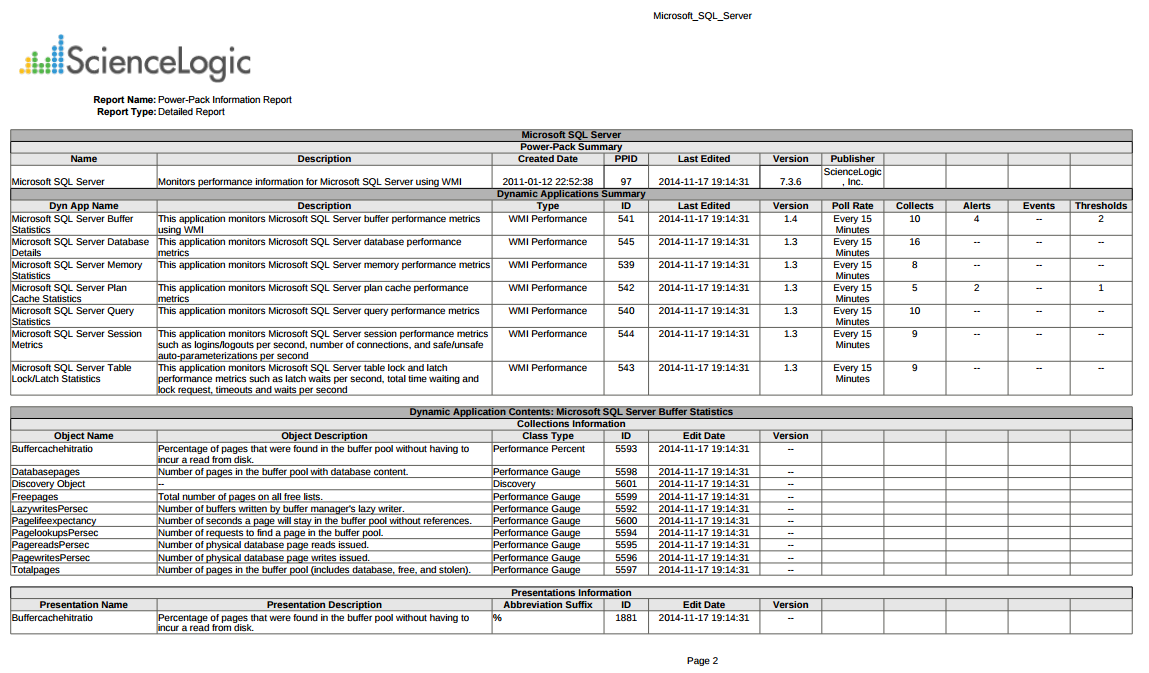
This report displays a list of installed PowerPacks in the SL1 system and includes details about each PowerPack. For each PowerPack, the report displays information about each content item in the PowerPack.
The above screenshot has been modified to improve clarity.

The following input options are available for this report:
- Select PowerPacks. Select an installed PowerPacks to be included in the report.
- Report Type Selector. Select one or more tabs to appear on the report.
- Summary Tab. Select this checkbox if you want the Summary tab to appear on the report. This tab summarizes the PowerPack details, including its name, description, version number, and the number of each PowerPack component type that are included in the PowerPack, among other information.
- Release Notes Tab. Select this checkbox if you want the Release Notes tab to appear on the report. This tab includes information about the PowerPack's release, including its creation and modified date, the vendors and models supported, technical notes, and so forth.
- PowerPack Details. Select this checkbox if you want the PowerPack details tab to appear on the report. This tab is labeled with the PowerPack name and lists each component included in the PowerPack in detail. You can select which specific components are detailed on this tab by making selections in the PowerPack Details Selector field.
- Not Aligned-to-PP Tab. Select this checkbox if you want the Not Aligned to PowerPack tab to appear on the report. This tab includes a list of components that are included for potential use in the PowerPack but not aligned to it by default.
- PowerPack Details Selector. Select one or more PowerPack components to be included in the PowerPack Details section of the report.
- Dynamic Apps Summary. This section lists all of the Dynamic Applications included in the PowerPack and a summary that includes the Description, Type, ID, Last Edited date, Version number, Poll Rate, and the number of Collection Objects, Alerts, Events, and Thresholds for each Dynamic Application.
- Dynamic Apps Details. This section lists all of the Dynamic Applications included in the PowerPack and a detailed description of each Collection Object, Presentation Object, Alert, Event Policy, and Threshold for each Dynamic Application.
- Event Policies. This section lists all of the Event Policies included in the PowerPack.
- Device Classes. This section lists all of the Device Classes included in the PowerPack.
- Reports. This section lists all of the Reports included in the PowerPack.
- Dashboard Widgets. This section lists all of the Dashboard Widgets included in the PowerPack.
- Dashboards. This section lists all of the Dashboards included in the PowerPack.
- SL1 Dashboards. This section lists all of the SL1 Dashboards included in the PowerPack.
- ScienceLogic Libraries. This section lists all of the ScienceLogic Libraries included in the PowerPack.
- Actions. This section lists all of the Run Book Actions included in the PowerPack.
- Credentials. This section lists all of the Credentials included in the PowerPack.
- Sort Results By. Select the method by which you want the report details to be sorted in the generated report.
This description covers the latest version of this report as shipped by ScienceLogic. This report might have been modified on your SL1 system.
EM7 Administration > Report Schedule
This report displays a list of scheduled reports from the Report Scheduler and details about each scheduled report. For each scheduled report, this Quick Report displays default columns of Next Run Scheduled, Schedule Name, Report Name, Version, and Schedule.
You can customize the output of the report to sort the scheduled reports by a selected column.
The following input options are available when generating the report:
- Sort By. Sort the information by Next Run Time, Report Name, Schedule Name, or Event ID.
- Timezone. Select a time zone for the report.
This description covers the latest version of this report as shipped by ScienceLogic. This report might have been modified on your SL1 system.
EM7 Administration > Subscription License Usage Report by Device
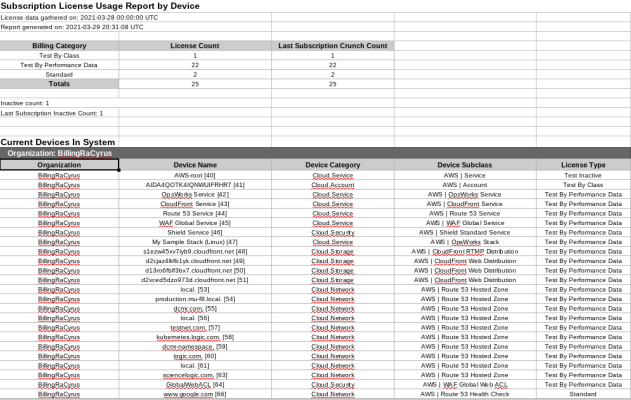
This report displays the number of active and inactive licenses, by device. The report displays the default columns of Billing Category, Organizations, Device Name, Device Category, Device Subclass, and License Type.
You can customize the output to include a baseline or to separate license totals by type.
The following input options are available when generating the report:
- Organizations. Specify one or more organizations or all organizations to include in the report.
- Options. Separate the report into tables, with a table for each organization.
This description covers the latest version of this report as shipped by ScienceLogic. This report might have been modified on your SL1 system.
EM7 Administration > Subscription License Usage Report by Type
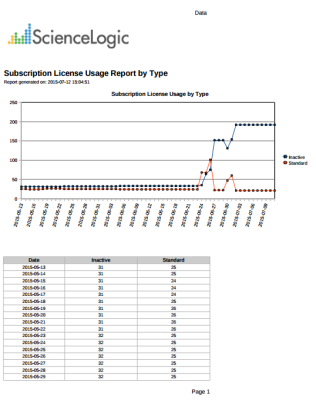
This report displays the number of licenses, by type, in a line graph and also includes a table that displays the number of licenses by date and the number of average licenses over time.
The following input options are available when generating the report:
- Timespan. Select the number of days to include in the report. Choices are 30 days, 60 days, 90 days, 120 days, 180 days, and 365 days. The default value is 60 days.
This description covers the latest version of this report as shipped by ScienceLogic. This report might have been modified on your SL1 system.
EM7 Administration > System Usage
This report displays System Usage statistics for your SL1 system. This report displays the number of Managed Elements, Vital Monitors, Synthetic Monitors, Dynamic Monitors, Interface Monitors, and Custom Elements. Displays a total of all modeling elements in a system. There are no input or output options for this report.
This description covers the latest version of this report as shipped by ScienceLogic. This report might have been modified on your SL1 system.
