Virtualization > vSphere Infrastructure
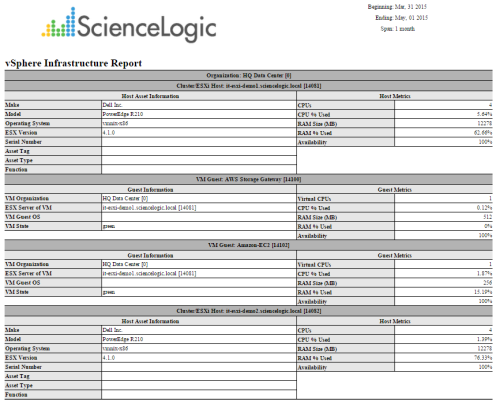
This report displays information for selected ESXi Hosts, including information about all Guest VMs running on the ESX server. This report also displays asset and usage information for each selected ESXi Host. For each ESXi Host and Guest VM, the report displays default rows of Make, Model, Operating System, ESX Version, Serial Number, Asset Tag, Asset Type, Function, CPUs, CPU % Used, RAM Size, RAM % Used, and Availability.
The following input options are available when generating the report:
- Select ESXi Host. By default, if the Select Individual Hosts checkbox is NOT selected, the report will include all hosts in the report. Select the Select Individual Hosts checkbox if you want to include only specific hosts in the report.
- Device Group Selector. Select one, multiple, or all device groups to include in the report. Select the All Device Groups checkbox if you want to include devices from all device groups in the report.
- Device Groups. If the All Device Groups checkbox is not selected, this field allows the user to select specific Device Groups.
- Device Categories. Select one, multiple, or all device categories to include in the report. Select the All Device Categories checkbox if you want to include devices from all device categories in the report.
- Device Categories. Further filters the list of devices selected in the Device Selection field. Only those devices selected in the Device Selection fields that are also from the selected device categories will be included in the report.
- Report Span. Specify a Daily, Weekly, or Monthly span to include in the report. Specify a Starting date and a Duration for the report. Select a time zone for the report.
- Separated By. Group devices by Organization or Device Group. The Organization checkbox is selected by default.
This description covers the latest version of this report as shipped by ScienceLogic. This report might have been modified on your Skylar One system.
Virtualization > vSphere Interface Usage
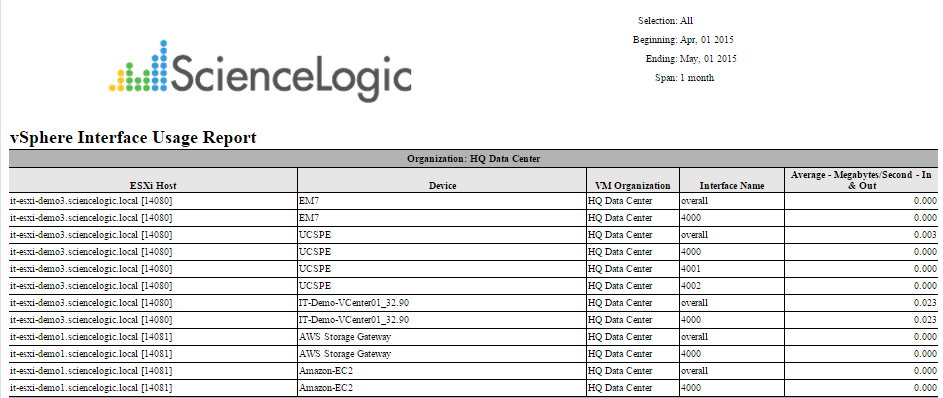
This report displays interface usage for selected ESXi Hosts, including total and average usage. For each ESXi Host, this report displays default columns of ESXi Host, Device, VM Organization, Interface Name, and Average - Megabytes/Second - In & Out.
You can customize the report output to include optional columns such as Organization, and Variables to Display, such as Megabytes/Second In and Out and Total Packets In and Out.
The following input options are available when generating the report:
- Select ESXi Host. By default, if the Select Individual Hosts checkbox is NOT selected, the report will include all hosts in the report. Select the Select Individual Hosts checkbox if you want to include only specific hosts in the report.
- Device Group Selector. Select one, multiple, or all device groups to include in the report. Select the All Device Groups checkbox if you want to include devices from all device groups in the report.
- Device Groups. If the All Device Groups checkbox is not selected, this field allows the user to select specific Device Groups.
- Report Span. Specify a Daily, Weekly, or Monthly span to include in the report. Specify a Starting date and a Duration for the report. Select a time zone for the report.
- Separated By. Group devices by Organization, Cluster/ESXi Host, Device Group, or VM Guest. The Organization checkbox is selected by default.
- Optional Columns. Select the Device IP Address checkbox to include this column in the report.
- Report Settings. Select which performance metric to include on the report from the Variable to Display drop-down, including:
- Megabytes/Second In and Out
- Total Packets In and Out
- Total Packets Dropped In and Out
- Select from a list of checkboxes:
- Show Totals. Displays the sum total of the performance metric selected in the report.
- Average by interface. Show total average interface usage for each device, asset, or Guest VM.
- Non-Zero only. Do not show results with zero usage.
This description covers the latest version of this report as shipped by ScienceLogic. This report might have been modified on your Skylar One system.
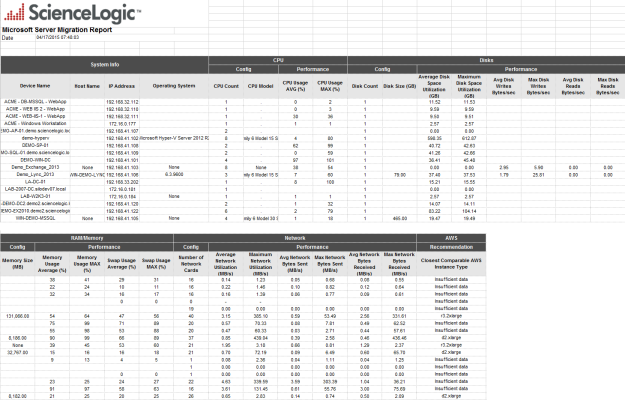
Virtualization > vSphere Migration
This report displays a list of guest ESXi Hosts that have moved from one ESX server to another. The report includes the following columns: Device Name of the VM, VM name, Migration Date/Time, Old ESX Server, and New ESX Server.
You can customize this report by including only specific ESXi Hosts or VMs and by selecting the time span of the report.
The following screenshots have been modified to improve clarity.
NOTE: This report is only available to administrators at this time.
The following input options are available when generating the report:
- Select ESXi Host. By default, if the Select Individual Hosts checkbox is NOT selected, the report will include all hosts in the report. Select the Select Individual Hosts checkbox if you want to include only specific hosts in the report.
- Device Group Selector. Select one, multiple, or all device groups to include in the report. Select the All Device Groups checkbox if you want to include devices from all device groups in the report.
- Device Groups. If the All Device Groups checkbox is not selected, this field allows the user to select specific Device Groups.
- Report Span. Specify a Daily, Weekly, or Monthly span to include in the report. Specify a Starting date and a Duration for the report. Select a time zone for the report.
- Separated By. Group devices by Organization, Device Group, and separate these selections further by ESXi Host or VM Guest.
- Sort by. Sort the report by Migration Date/Time, Old Server, or New Server.
- Options. Select the checkbox to include migrations for ESXi hosts and VMs that are not mapped to EM7 devices.
This description covers the latest version of this report as shipped by ScienceLogic. This report might have been modified on your Skylar One system.
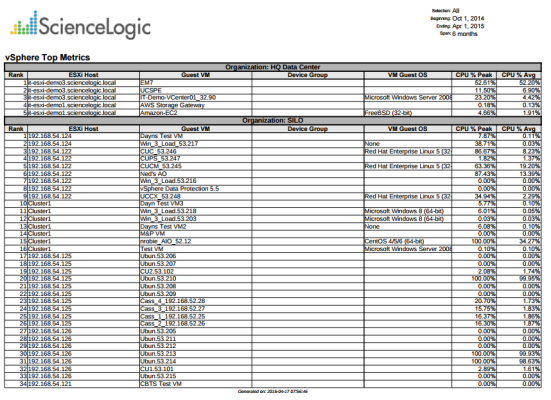
Virtualization > vSphere Top Metrics
This report displays the top metrics of selected ESXi Hosts, with the default columns Rank, ESXi Host, Guest VM, Device Group, VM Guest OS, CPU % Peak, CPU % Avg.
The following input options are available when generating the report:
- Select ESXi Host. By default, if the Select Individual Hosts checkbox is NOT selected, the report will include all hosts in the report. Select the Select Individual Hosts checkbox if you want to include only specific hosts in the report.
- Device Group Selector. Select one, multiple, or all device groups to include in the report. Select the All Device Groups checkbox if you want to include devices from all device groups in the report.
- Device Groups. If the All Device Groups checkbox is not selected, this field allows the user to select specific Device Groups.
- Report Span. Specify a Daily, Weekly, or Monthly span to include in the report. Specify a Starting date and a Duration for the report. Select a time zone for the report.
- Separated By. Group devices by Organization, Device Group, or Cluster & ESXi Host.
- Device Selection Options. Select All; Auto-select using the specified thresholds (below) in the Metrics and Thresholds section; or Auto-select a specific number by their rank, which allows you to use drop-down menus to select the bottom or top 10–1000 devices.
- Metrics and Thresholds. Allows you to select which metrics you wish to display in the report. CPU Utilization is the default selection, however you have the option to keep or remove CPU Utilization, and add Memory or Availability. If you have selected Auto-select using the specified thresholds (below) in the Device Selection Options section, you can specify a value for a threshold that all devices in the report must exceed using the drop-down menus.
This description covers the latest version of this report as shipped by ScienceLogic. This report might have been modified on your Skylar One system.
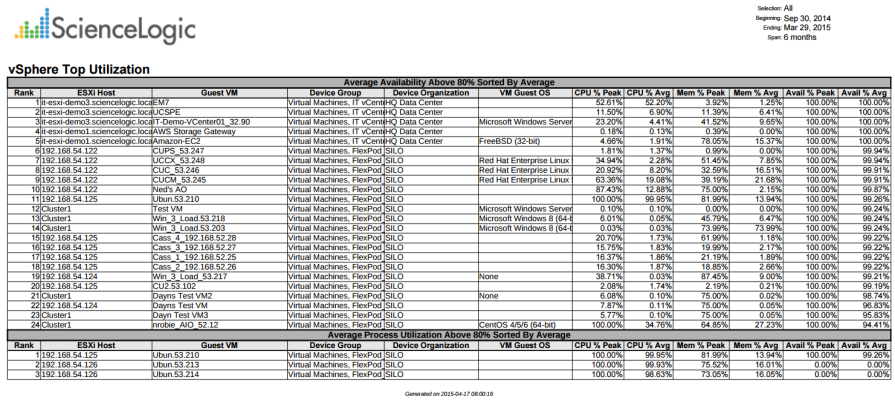
Virtualization > vSphere Top Utilization
This report displays the ESXi Hosts with the highest utilization. This report can be generated as:
- A "Top N" report, where you select a utilization statistic (CPU, Memory, or Availability) and the number of guest ESXi Hosts to include on the report. The Hosts that will be included in the report are those with the highest values for the specified utilization statistic. For each ESXi Host included in the report, the report displays default columns of Rank, ESXi Host, Guest VM, Device Group, Device Organization, VM Guest OS, CPU % Peak, CPU % Average, Memory % Peak, Memory % Average, Availability % Peak, and Availability % Average.
- A "Threshold" report, where you select a percentage threshold for CPU utilization, Memory utilization, and Availability utilization. The report will include a table for each utilization statistic. Each table includes the devices that have a peak percentage value that exceeds the specified threshold for that utilization statistic. For each device included in the report, the report displays default columns of Rank; ESXi Host; Guest VM; Device Group; Device Organization; VM Guest OS; CPU, Memory, or Availability % Peak; and CPU, Memory, or Availability % Average.
You can customize the output of the report to limit which ESXi Hosts will be evaluated for inclusion in the report. You can also specify the time span of information to include in the report.
The following input options are available when generating the report:
- Select ESXi Host. By default, if the Select Individual Hosts checkbox is NOT selected, the report will include all hosts in the report. Select the Select Individual Hosts checkbox if you want to include only specific hosts in the report.
- Device Group Selector. Select one, multiple, or all device groups to include in the report. Select the All Device Groups checkbox if you want to include devices from all device groups in the report.
- Device Groups. If the All Device Groups checkbox is not selected, this field allows the user to select specific Device Groups.
- Report Span. Specify a Daily, Weekly, or Monthly span to include in the report. Specify a Starting date, a Duration for the report, and specify Hours Included. Select a time zone for the report.
- Report Type. You can choose to include all devices that match the specified thresholds or you can choose to include the devices that are top users of CPU, memory, or available space.
- If you select Threshold, you can then specify the values for CPU Threshold, Memory Threshold, and Availability Threshold. The values range from 0% to 95%. The report will include separate tables for CPU, Memory, and Availability and include devices that have met or exceeded the threshold.
- If you want to select a number of devices, choices range from top 10 to Top 100. Specify the top number of devices to display in the report, then select the utilization statistic (CPU, Memory, or Availability) that will be used to determine which devices will be included in the report.
- Separated By. Group devices by Organization, Device Group, and/or Cluster & ESXi Host.
This description covers the latest version of this report as shipped by ScienceLogic. This report might have been modified on your Skylar One system.
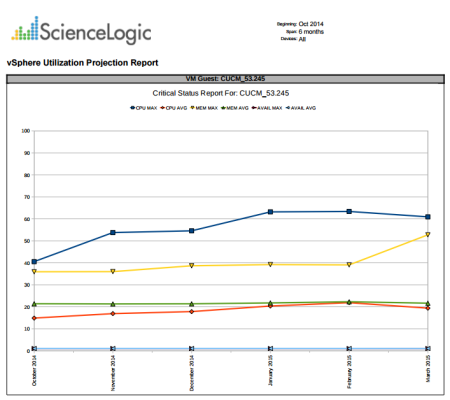
Virtualization > vSphere Utilization Projection
For each selected ESXi Host, this report displays a chart of CPU, Memory and Availability usage.
You can modify the output of the report to include charts only for specific ESXi Hosts, and group the chart by Organization, Device Group, or Cluster & ESXi Host. By default, utilization charts for all Guest VMs in the system will be displayed.
The following input options are available when generating the report:
- Select ESXi Host. By default, if the Select Individual Hosts checkbox is NOT selected, the report will include all hosts in the report. Select the Select Individual Hosts checkbox if you want to include only specific hosts in the report.
- Device Group Selector. Select one, multiple, or all device groups to include in the report. Select the All Device Groups checkbox if you want to include devices from all device groups in the report.
- Device Groups. If the All Device Groups checkbox is not selected, this field allows the user to select specific Device Groups.
- Report Span. Specify a Daily, Weekly, or Monthly span to include in the report. Specify a Starting date and a Duration for the report. Select a time zone for the report.
- Separated By. Group devices by Organization, Device Group, and/or Cluster & ESXi Host.
This description covers the latest version of this report as shipped by ScienceLogic. This report might have been modified on your Skylar One system.
