Introduction to Linux SSH User-Initiated Automations

Download this manual as a PDF file

This section describes how to use the automation policies found in the Linux SSH User-Initiated Automation PowerPack

This PowerPack requires a subscription to one of the following solutions:

  • Datacenter Automation Pack
  • ScienceLogic Standard solution

What is the Linux SSH User-Initiated Automation PowerPack?

The Linux SSH User-Initiated Automation PowerPack includes automation policies that you can use to run Linux diagnostic commands from the SL1 event console , using Event Tools. This PowerPack is supplemental to the Linux SSH Automation PowerPack and is not meant for standalone use.

In addition to using the standard content, you can customize the automation policies, or you can create your own automation policies using any available automation actions.

Installing the Linux SSH User-Initiated Automation PowerPack

Before completing the steps in this section, you must import and install the latest version of the Linux SSH Automation PowerPack and the Linux Base Pack  PowerPack.

The Linux SSH User-Initiated Automation PowerPack requires SL1 version 10.1.0 or later. For details on upgrading SL1, see the appropriate SL1Release Notes.

You must also install the Datacenter Automation Utilities PowerPack, which provides the output formats for the automation actions included in this PowerPack.

By default, installing a new version of a PowerPack overwrites all content from a previous version of that PowerPack that has already been installed on the target system. You can use the Enable Selective PowerPack Field Protection setting in the Behavior Settings page (System > Settings > Behavior) to prevent new PowerPacks from overwriting local changes for some commonly customized fields. For more information, see the section on Global Settings.

To download and install the PowerPack:

  1. Search for and download the PowerPack from the PowerPacks page (Product Downloads > PowerPacksSyncPacks) at the ScienceLogic Support Site.
  2. In SL1, go to the PowerPacks page (System > Manage > PowerPacks).
  3. Click the Actions button and choose Import PowerPack. The Import PowerPack dialog box appears.
  4. Click [Browse] and navigate to the PowerPack file from step 1.
  5. Select the PowerPack file and click Import. The PowerPack Installer modal displays a list of the PowerPack contents.
  6. Click Install. The PowerPack is added to the PowerPacks page.

If you exit the PowerPack Installer modal without installing the imported PowerPack, the imported PowerPack will not appear in the PowerPacks page. However, the imported PowerPack will appear in the Imported PowerPacks modal. This page appears when you click the Actions menu and select Install PowerPack.

Standard Automation Policies

The Linux SSH User-Initiated Automation PowerPack includes standard automation policies that trigger automation actions that will run Linux diagnostic commands from the SL1 event console.

The automation policies available in this release of the PowerPack are tied to included ScienceLogic SL1 events generated by the Dynamic Applications from the Linux Base Pack PowerPack.

The automation policies are of Policy Type, "User Initiated". This means that for an event that matches the criteria, you can run these automation policies from the Event Console.

For these automation policies to be visible from the Event Tools in the Event's drawer, the following three things must be true between the event and the automation policy configuration:

  • Organization. The organization associated with the event must match the organization configured in the automation policy. Policies in the "System" organization match all organizations.
  • Aligned Devices. The device for which the event is triggered must be configured as a Aligned Device in the automation policy.
  • Aligned Event. The event must match one of the Aligned Events configured in the automation policy.

The following table shows the automation policies, their aligned events, and the automation actions that run in response to the events.

The aligned events are included as part of the Linux Base Pack PowerPack and are not installed with the SL1 platform. You must install the PowerPack to obtain these events.

Automation Policy Name Aligned Events Automation Action
Restart Process via SSH
  • Poller: required process not running
  • Linux Proces Restart Remediations
  • Datacenter Automation: Format Output as HTML
Run CPU Diagnostics (SSH)
  • Linux SSH: CPU utilization above threshold
  • Host Resource: CPU has exceeded threshold
  • Net-SNMP: CPU has exceeded threshold
  • Linux CPU Diagnostic Commands
  • Datacenter Automation: Format Output as HTML
Run File System Diagnostics (SSH)
  • Poller: File system usage exceeded (critical) threshold
  • Poller: File system usage exceeded (major) threshold
  • Linux File System Diagnostic Commands
  • Datacenter Automation: Format Output as HTML
Run Interface Error/Discard Diagnostics (SSH)
  • Interface inbound discards has exceeded the Falling-High threshold
  • Interface inbound discards has exceeded the Rising-High threshold
  • Interface inbound discards percentage has exceeded the Falling-High threshold
  • Interface inbound discards percentage has exceeded the Rising-High threshold
  • Interface inbound errors has exceeded the Falling-High threshold
  • Interface inbound errors has exceeded the Rising-High threshold
  • Interface inbound errors percentage has exceeded the Falling-High threshold
  • Interface inbound errors percentage has exceeded the Rising-High threshold
  • Interface outbound discards has exceeded the Falling-High threshold
  • Interface outbound discards has exceeded the Rising-High threshold
  • Interface outbound discards percentage has exceeded the Falling-High threshold
  • Interface outbound discards percentage has exceeded the Rising-High threshold
  • Interface outbound errors has exceeded the Falling-High threshold
  • Interface outbound errors has exceeded the Falling-High threshold
  • Interface outbound errors percentage has exceeded the Falling-High threshold
  • Interface outbound errors percentage has exceeded the Rising-High threshold
  • Interface inbound discards has exceeded the Falling-Medium threshold
  • Interface inbound discards has exceeded the Rising-Medium threshold
  • Interface inbound discards percentage has exceeded the Falling-Medium threshold
  • Interface inbound discards percentage has exceeded the Rising-Medium threshold
  • Interface inbound errors has exceeded the Falling-Medium threshold
  • Interface inbound errors has exceeded the Rising-Medium threshold
  • Interface inbound errors percentage has exceeded the Falling-Medium threshold
  • Interface inbound errors percentage has exceeded the Rising-Medium threshold
  • Interface outbound discards has exceeded the Falling-Medium threshold
  • Interface outbound discards has exceeded the Rising-Medium threshold
  • Interface outbound discards percentage has exceeded the Falling-Medium threshold
  • Interface outbound discards percentage has exceeded the Rising-Medium threshold
  • Interface outbound errors has exceeded the Falling-Medium threshold
  • Interface outbound errors has exceeded the Falling-Medium threshold
  • Interface outbound errors percentage has exceeded the Falling-Medium threshold
  • Interface outbound errors percentage has exceeded the Rising-Medium threshold
  • Interface inbound discards has exceeded the Falling-Low threshold
  • Interface inbound discards has exceeded the Rising-Low threshold
  • Interface inbound discards percentage has exceeded the Falling-Low threshold
  • Interface inbound discards percentage has exceeded the Rising-Low threshold
  • Interface inbound errors has exceeded the Falling-Low threshold
  • Interface inbound errors has exceeded the Rising-Low threshold
  • Interface inbound errors percentage has exceeded the Falling-Low threshold
  • Interface inbound errors percentage has exceeded the Rising-Low threshold
  • Interface outbound discards has exceeded the Falling-Low threshold
  • Interface outbound discards has exceeded the Rising-Low threshold
  • Interface outbound discards percentage has exceeded the Falling-Low threshold
  • Interface outbound discards percentage has exceeded the Rising-Low threshold
  • Interface outbound errors has exceeded the Falling-Low threshold
  • Interface outbound errors has exceeded the Falling-Low threshold
  • Interface outbound errors percentage has exceeded the Falling-Low threshold
  • Interface outbound errors percentage has exceeded the Rising-Low threshold
  • Poller: Interface reporting discards
  • Poller: Interface reporting packet errors
  • Linux Interface Error/Discard Diagnostic Commands
  • Datacenter Automation: Format Output as HTML
Run Interface Utilization Diagnostics (SSH)
  • Interface inbound usage percentage has exceeded the Falling-High threshold
  • Interface inbound usage percentage has exceeded the Rising-High threshold
  • Interface inbound usage rate has exceeded the Falling-High threshold
  • Interface inbound usage rate has exceeded the Rising-High threshold
  • Interface outbound usage percentage has exceeded the Falling-High threshold
  • Interface outbound usage percentage has exceeded the Rising-High threshold
  • Interface outbound usage rate has exceeded the Falling-High threshold
  • Interface outbound usage rate has exceeded the Rising-High threshold
  • Interface inbound usage percentage has exceeded the Falling-Medium threshold
  • Interface inbound usage percentage has exceeded the Rising-Medium threshold
  • Interface inbound usage rate has exceeded the Falling-Medium threshold
  • Interface inbound usage rate has exceeded the Rising-Medium threshold
  • Interface outbound usage percentage has exceeded the Falling-Medium threshold
  • Interface outbound usage percentage has exceeded the Rising-Medium threshold
  • Interface outbound usage rate has exceeded the Falling-Medium threshold
  • Interface outbound usage rate has exceeded the Rising-Medium threshold
  • Poller: Bandwidth usage exceeded threshold
  • Interface inbound usage percentage has exceeded the Falling-Low threshold
  • Interface inbound usage percentage has exceeded the Rising-Low threshold
  • Interface inbound usage rate has exceeded the Falling-Low threshold
  • Interface inbound usage rate has exceeded the Rising-Low threshold
  • Interface outbound usage percentage has exceeded the Falling-Low threshold
  • Interface outbound usage percentage has exceeded the Rising-Low threshold
  • Interface outbound usage rate has exceeded the Falling-Low threshold
  • Interface outbound usage rate has exceeded the Rising-Low threshold
  • Poller: Bandwidth usage exceeded threshold
  • Automation Utilities: Calculate Memory Size for Each Action
  • Linux Interface Utilization Diagnostic Commands
  • Linux Tcpdump Command
  • Datacenter Automation: Format Output as HTML
Run Memory/Swap Diagnostics (SSH)
  • Host Resource: Swap Memory has exceeded threshold
  • Linux SSH: Swap usage above threshold
  • Net-SNMP: Swap has exceeded threshold
  • Host Resource: Physical Memory has exceeded threshold
  • Net-SNMP: Physical Memory exceeded threshold
  • Automation Utilities: Calculate Memory Size for Each Action
  • Linux Memory/Swap Diagnostic Commands
  • Linux Memory Dmidecode Command
  • Datacenter Automation: Format Output as HTML
Run System Storage Diagnostics (SSH)
  • Linux SSH: File System over usage threshold
  • Linus System-Storage Diagnostic Commands
  • Datacenter Automation: Format Output as HTML
Stop Illicit Process via SSH
  • Poller: Illicit process running
  • Linux Illicit Process Remediation
  • Datacenter Automation: Format Output as HTML


Running a User Initiated Automation Policy

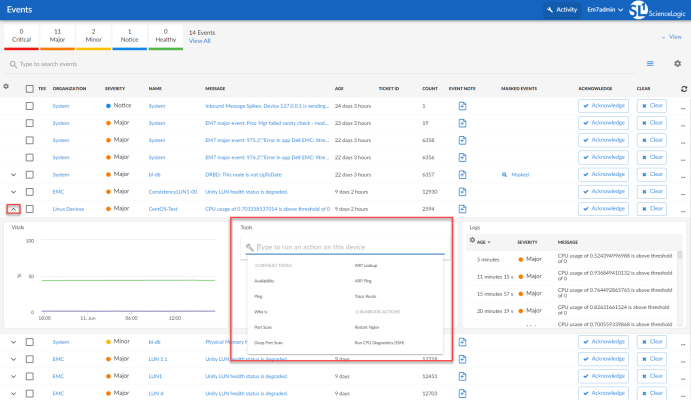
To run a user initiated automation policy, open the drawer for the event and click in the Tools section. Any available user initiated automation policy will be available to run on demand.

Viewing Automation Actions for an Event

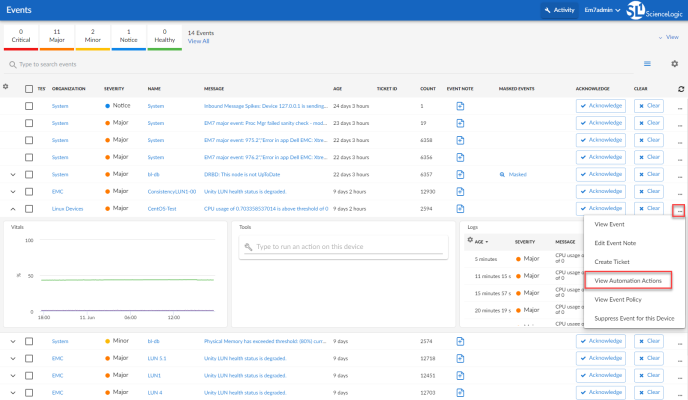
The following figure shows a VMware event with major criticality on the Events page. Click the [Actions] button () for an event, and select View Automation Actions to see the automation actions triggered by the events.

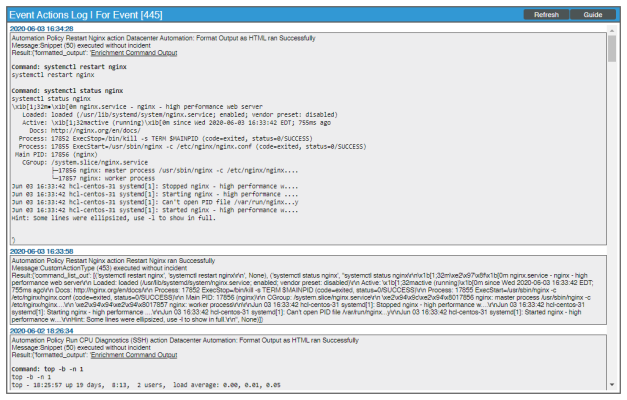
The results shown for this event, in the Event Actions Log, include the automation policy that ran (shown at the top of the following figure), along with the collected data. The following figure shows an example of this output.

To learn more about which logs are collected by default for a given automation action, see the Customizing Linux SSH Actions section.

Although you can edit the automation policy described in this section, it is a best practice to use "Save As" to create a new automation policy, rather than to customize the standard automation policies.