![]()
This
Standard Automation Policies
The Network Connectivity AutomationsPowerPack includes six standard automation policies, shown in the figure below. These automation policies run automatically in response to network availability events to diagnose problems. To use these standard policies, you do not have to do any additional configuration after you install the PowerPack.

The following table shows the standard automation policies, their aligned events, and the automation action that runs by default in response to the events.
| Automation Policy Name | Aligned Events | Automation Action (Default) |
|---|---|---|
| Network Connectivity: Run NMAP on Affected Port |
|
|
| Network Connectivity: Run IPv6 NMAP on Affected Port |
|
|
| Network Connectivity: Run NMAP on Common Ports |
|
|
| Network Connectivity: Run IPv6 NMAP on Common Ports |
|
|
| Network Connectivity: Run NMAP on Monitored Ports |
|
|
| Network Connectivity: Run IPv6 NMAP on Monitored Ports |
|
|
| Network Connectivity: Run Nslookup (IPv4) |
|
|
| Network Connectivity: Run Ping (IPv4) |
|
|
| Network Connectivity: Run Ping (IPv6) |
|
|
| Network Connectivity: Run Traceroute (IPv4) |
|
|
| Network Connectivity: Run Traceroute (IPv6) |
|
|
For every device that has an IP address, SL1 monitors availability every five minutes. If you have enabled Critical Ping for a device and enabled the event "Poller: Device not responding to ping (high frequency)", you can monitor availability at a higher frequency than five minutes. The automation policies included in this PowerPack respond to events from Critical Ping, as well.
The following figure shows some network availability events on the Events page:

To see the automation actions triggered by an event, click the [Actions] button (![]() ) and select View Automation Actions. The Event Actions Log page appears. Notice the highlighted NMAP, Ping, and Nslookup information in the following figure. The log indicates that the following actions ran successfully and indicates which SL1 appliance ran the action:
) and select View Automation Actions. The Event Actions Log page appears. Notice the highlighted NMAP, Ping, and Nslookup information in the following figure. The log indicates that the following actions ran successfully and indicates which SL1 appliance ran the action:
- Run Nslookup (IPv4): Default Options and Datacenter Automation: Format Command Output as HTML
- Run NMAP on Common Ports and Datacenter Automation: Format Command Output as HTML
- Run Ping (IPv4): Default Options and Datacenter Automation: Format Command Output as HTML

Although you can edit the automation actions described in this section, best practice is to "Save As" to create a new, renamed automation action, instead of customizing the standard automation policies.
Standard Ping Automation Policy
The "Network Connectivity: Run Ping (IPv4)" or "Network Connectivity: Run Ping (IPv6)" automation policies are triggered by the following events, depending on the address type of the device:
- Poller: Availability and Latency checks failed
- Poller: Availability Check Failed
- Poller: Availability Flapping
- Poller: Device not responding to ping (high frequency)
- Poller: Network Latency Exceeded Threshold
- Poller: TCP connection time above threshold
- Poller: TCP/UDP port not responding
- Poller: TCP/UDP port not responding (SMTP)
- Transactions: Round trip mail did not arrive within threshold
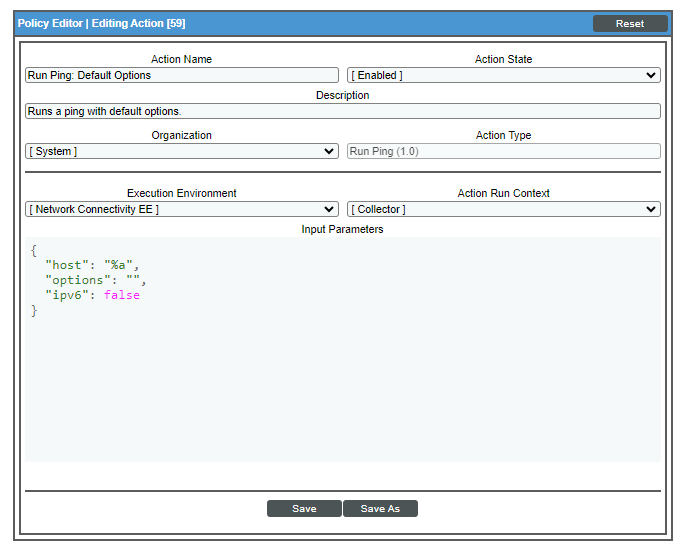
Default Behavior. When these events occur, the appropriate automation policy "Network Connectivity: Run Ping (IPv4)" or "Network Connectivity: Run Ping (IPv6)" executes the action "Run Ping: Default Options" or "Run Ping6: Default Options", respectively, and formats the output with "Datacenter Automation: Format Command Output as HTML". The output of the command is formatted for display in the SL1 Events page, or in an incident ticket on an external system.
The following figure shows the details of the IPv4 ping action:
Standard Traceroute Automation Policy
The "Network Connectivity: Run Traceroute (IPv4)" or "Network Connectivity: Run Traceroute (IPv6)" automation policies are triggered by the following events:
- Poller: Availability and Latency checks failed
- Poller: Availability Check Failed
- Poller: Availability Flapping
- Poller: Device not responding to ping (high frequency)
- Poller: Network Latency Exceeded Threshold
- Poller: TCP connection time above threshold
- Poller: TCP/UDP port not responding
- Poller: TCP/UDP port not responding (SMTP)
- Transactions: Round trip mail did not arrive within threshold
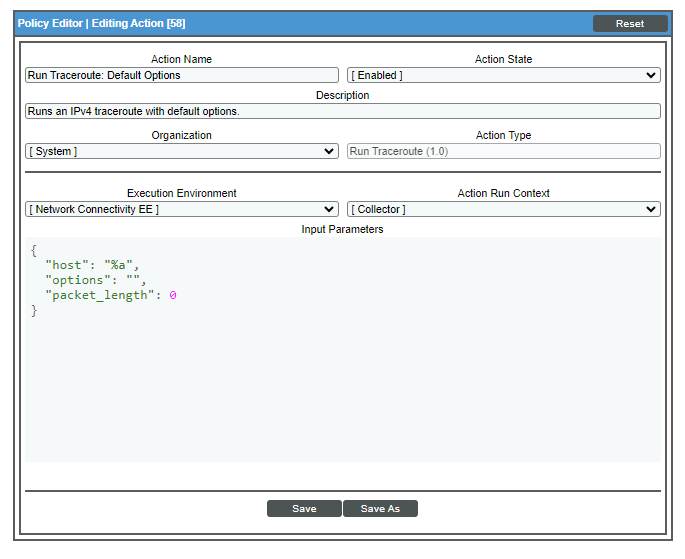
Default Behavior. When these events occur, the automation policy "Network Connectivity: Run Traceroute (IPv4") or "Network Connectivity: Run Traceroute (IPv6)" executes the "Run Traceroute: Default Options" or "Run IPv6 Traceroute: Default Options" action, depending upon the type of network address of the device that triggered the event. These actions run a standard traceroute command automatically. The output of the command is formatted for display in the SL1 Events page, or in an incident ticket on an external system.
The following figure shows the details of the IPv4 traceroute action:
Standard NSLOOKUP Automation Policy
The "Network Connectivity: Run Nslookup (IPv4)" automation policy is triggered by the following events:
- Poller: Availability and Latency checks failed
- Poller: Availability Check Failed
- Poller: Availability Flapping
- Poller: Device not responding to ping (high frequency)
- Poller: DNS hostname resolution time above threshold
- Poller: Failed to resolve hostname
- Poller: TCP/UDP port not responding
- Poller: TCP/UDP port not responding (SMTP)
- Transactions: Round trip mail did not arrive within threshold
Default Behavior. When these events occur, the automation policy "Network Connectivity: Run Nslookup (IPv4") executes the action "Run Nslookup: Default Options" and formats the output with "Enrichment: Util: Format Command Output as HTML". This action runs a standard NSLOOKUP (IPv4) command automatically. The output of the command is formatted for display in the SL1Events page, or in an incident ticket on an external system.
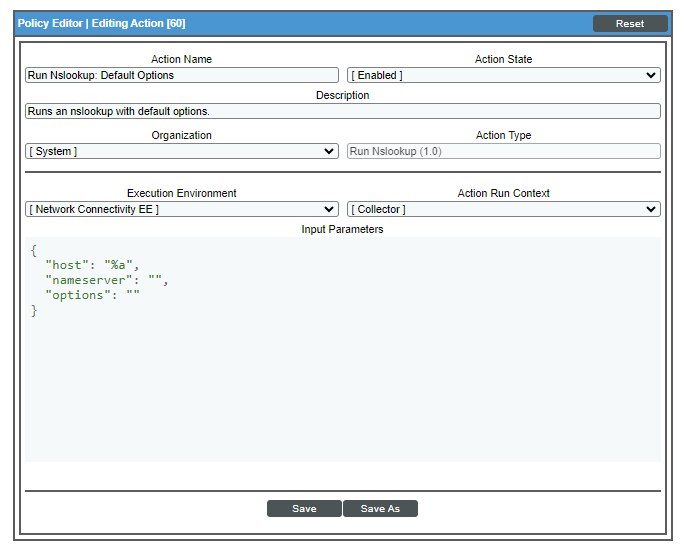
Options. In some cases, you may want to modify the action that is run in response to the triggering events. For example, you can run NSLOOKUP with plaintext output.
Standard NMAP Automation Policies
Three NMAP automation policies for IPv4 devices and three NMAP automation policies for IPv6 devices are included with this PowerPack. Each policy is described in more detail in this section.
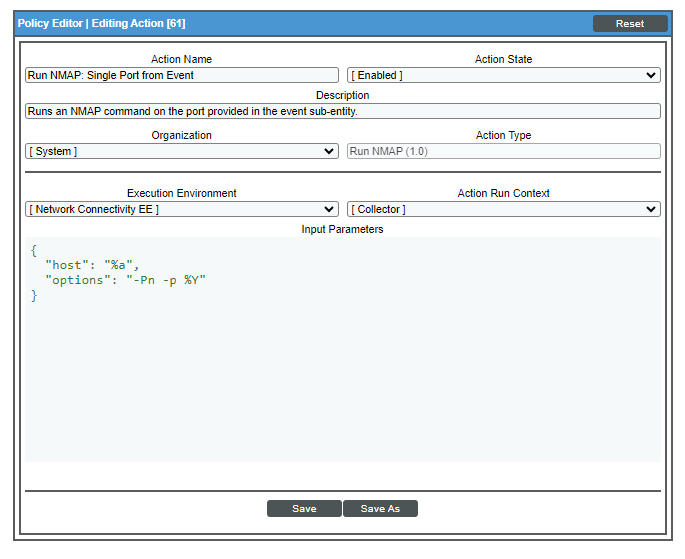
Run NMAP on Affected Port
The "Network Connectivity: Run NMAP on Affected Port" or "Network Connectivity: Run IPv6 NMAP on Affect Port" automation policies are triggered by the following events:
- Poller: TCP/UDP port not responding
- Poller: TCP/UDP port not responding (SMTP)
Default Behavior. When these events occur for IPv4 devices, the automation policy "Network Connectivity: Run NMAP on Affected Port" executes the action "Run NMAP: Single Port from Event" and formats the output with "Datacenter Automation: Format Command Output as HTML". For IPv6 devices, the automation policy "Network Connectivity: Run IPv6 NMAP on Affected Port" executes the "Run IPv6 NMAP: Single Port from Event" action and formats the output with "Datacenter Automation: Format Command Output as HTML". Either action runs a standard NMAP command on the port provided in the event. The output of the command is formatted for display in the SL1 Events page, or in an incident ticket on an external system.
The following figure shows the details of the IPv4 NMAP action:
For information about customizing automation policies, see Customizing an Automation Policy.
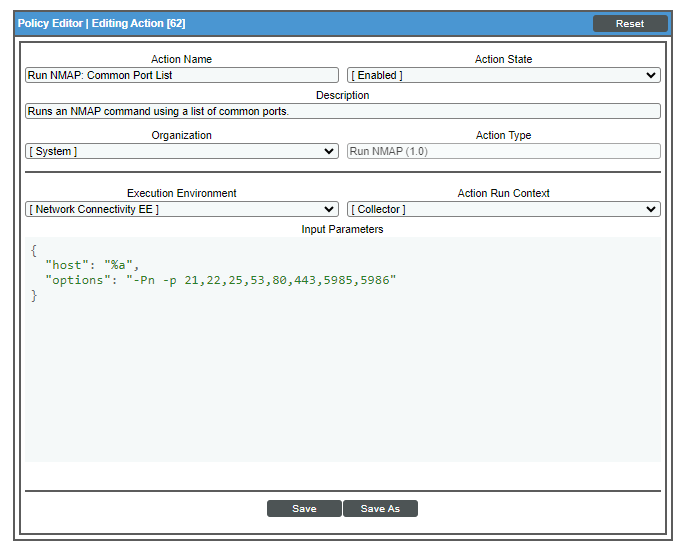
Run NMAP on Common Port List
The "Network Connectivity: Run NMAP on Common Port List" or "Network Connectivity: Run IPv6 NMAP on Common Port List" automation policies are triggered by the following events:
- Poller: Availability and Latency checks failed
- Poller: Device not responding to ping (high frequency)
- Poller: Availability Check Failed
- Poller: Availability Flapping
- Poller: TCP/UDP port not responding
- Poller: TCP/UDP port not responding (SMTP)
- Transactions: Round trip mail did not arrive within threshold
Default Behavior. When these events occur for IPv4 devices, the automation policy "Network Connectivity: Run NMAP on Common Port List" executes the action "Run NMAP: Common Port List" and formats the output with "Datacenter Automation: Format Command Output as HTML". When these events occur for IPv6 devices, the automation policy "Network Connectivity: Run IPv6 NMAP on Common Port List" executes the action "Run IPv6 NMAP: Common Port List" and formats the output with "Datacenter Automation: Format Command Output as HTML". Either action runs a standard NMAP command on ports 21, 22, 25, 53, 80, 443, 5985, and 5986. The output of the command is formatted for display in the SL1Events page, or in an incident ticket on an external system.
The following figure shows the details of the IPv4 NMAP action:
Run NMAP on Monitored Ports
The "Network Connectivity: Run NMAP on Monitored Ports" or "Network Connectivity: Run IPv6 NMAP on Monitored Ports" automation policies are triggered by the following events:
- Poller: Availability and Latency checks failed
- Poller: Device not responding to ping (high frequency)
- Poller: Availability Check Failed
- Poller: Availability Flapping
- Poller: TCP/UDP port not responding
- Poller: TCP/UDP port not responding (SMTP)
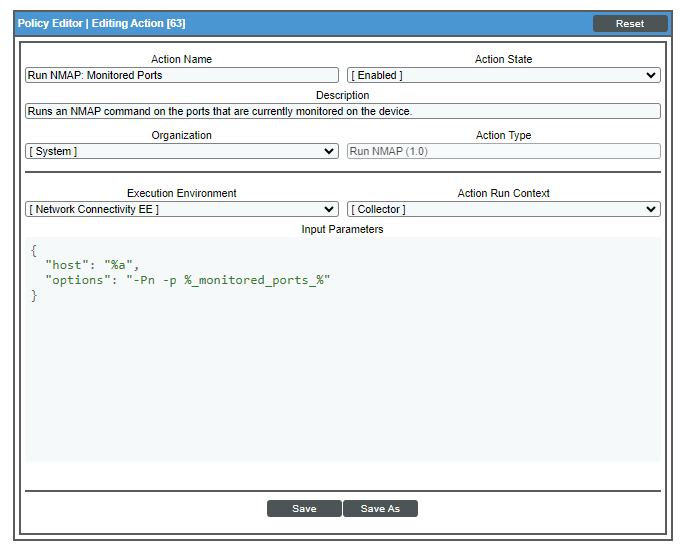
Default Behavior. When these events occur for IPv4 devices, the automation policy "Network Connectivity: Run NMAP on Monitored Ports" executes the action "Run NMAP: Monitored Ports" and formats the output with "Datacenter Automation: Format Command Output as HTML". When these events occur for IPv6 devices, the automation policy "Network Connectivity: Run IPv6 NMAP on Monitored Ports" executes the action "Run IPv6 NMAP: Monitored Ports" and formats the output with "Datacenter Automation: Format Command Output as HTML". Either action runs a standard NMAP command on any ports that are currently monitored with a port monitoring policy on the triggering device. The output of the command is formatted for display in the SL1 Events page, or in an incident ticket on an external system.
The following figure shows the details of the IPv4 NMAP action: