![]()
This chapter describes how to view and interact with the Event Insights page (Events > Event Insights).
Use the following menu options to navigate the Skylar One user interface:
- To view a pop-out list of menu options, click the menu icon (
 ).
). - To view a page containing all of the menu options, click the Advanced menu icon (
 ).
).
-
To view additional information within this page's widgets, click the Tooltip icon (
 ).
).
How Skylar One Provides Event Insights Data
The Event Insights page provides a global view of the alerts generated by Skylar One, the events created as the result of specific alert conditions, and the number of events that are currently active. You can use this page to track the source of your events and monitor the noise reduction that Skylar One is providing for you.
Noise reduction is the percentage of alerts that did not become events in Skylar One. A mature, tuned Skylar One system will have a high noise reduction percentage, as Skylar One is sharing only the events that matter to your environment.
Comparing alerts and events in Skylar One:
- An alert is defined by a formula that Skylar One evaluates each time data is collected. If the formula evaluates to "true" while Skylar One is collecting data on the devices in your environment, Skylar One generates an alert.
- Events are messages that are triggered when a specific condition is met. For example, an event can signal if a server has gone down, if a device is exceeding CPU or disk-space thresholds, or if communication with a device has failed. Alternately, an event can simply display the status of a managed element.
- Not every alert will trigger an event. An alert must have an event policy in Skylar One that defines the conditions for the event, and when an alert meets the conditions in the event policy, Skylar One generates an event.
The Event Insights page (Events > Event Insights) lets administrator users see how Skylar OneSkylar One evaluates alerts ("alarms") and reduces data noise. Skylar One identifies noise as any extraneous data collected by a large system that provides little insight to the admin user. The Event Insights page aims to sift and identify any of this extraneous data; thus, resulting in a more-valuable and refined event generation process. All of this fine-tuned data is viewable in the Overview tab of the Event Insights page.
NOTE: You can select one or more organizations to filter by clicking on the Event Insights page.
You can edit the time range for the data displayed on this page.
To apply a time range to your desired insights-data collection:
-
Click the drop-down at the top-right of the page. The Time Selector page appears.
-
View your time range options to enter into the and fields.
-
You can manually enter the specific time range by typing in the and fields; or you can select one of the time ranges listed underneath the and headers.
-
If your time range requires a specific time of day for collection, select .
-
If your time range requires collection from a specific date up until current time, select . If working within a selected time range previous to current date, leave the checkbox unmarked.
-
Click to update the page to your selected time range's data.
You can also filter the page's displayed data by Organization(s) as well.
To apply a filter for desired Organization(s) to your insights-data collection:
-
Click the icon located next to the Time Selector drop-down at the top right of the page. A window appears.
-
View your Organization options for selection.
-
Select your specific Organizations(s) fields to filter the page's data collection.
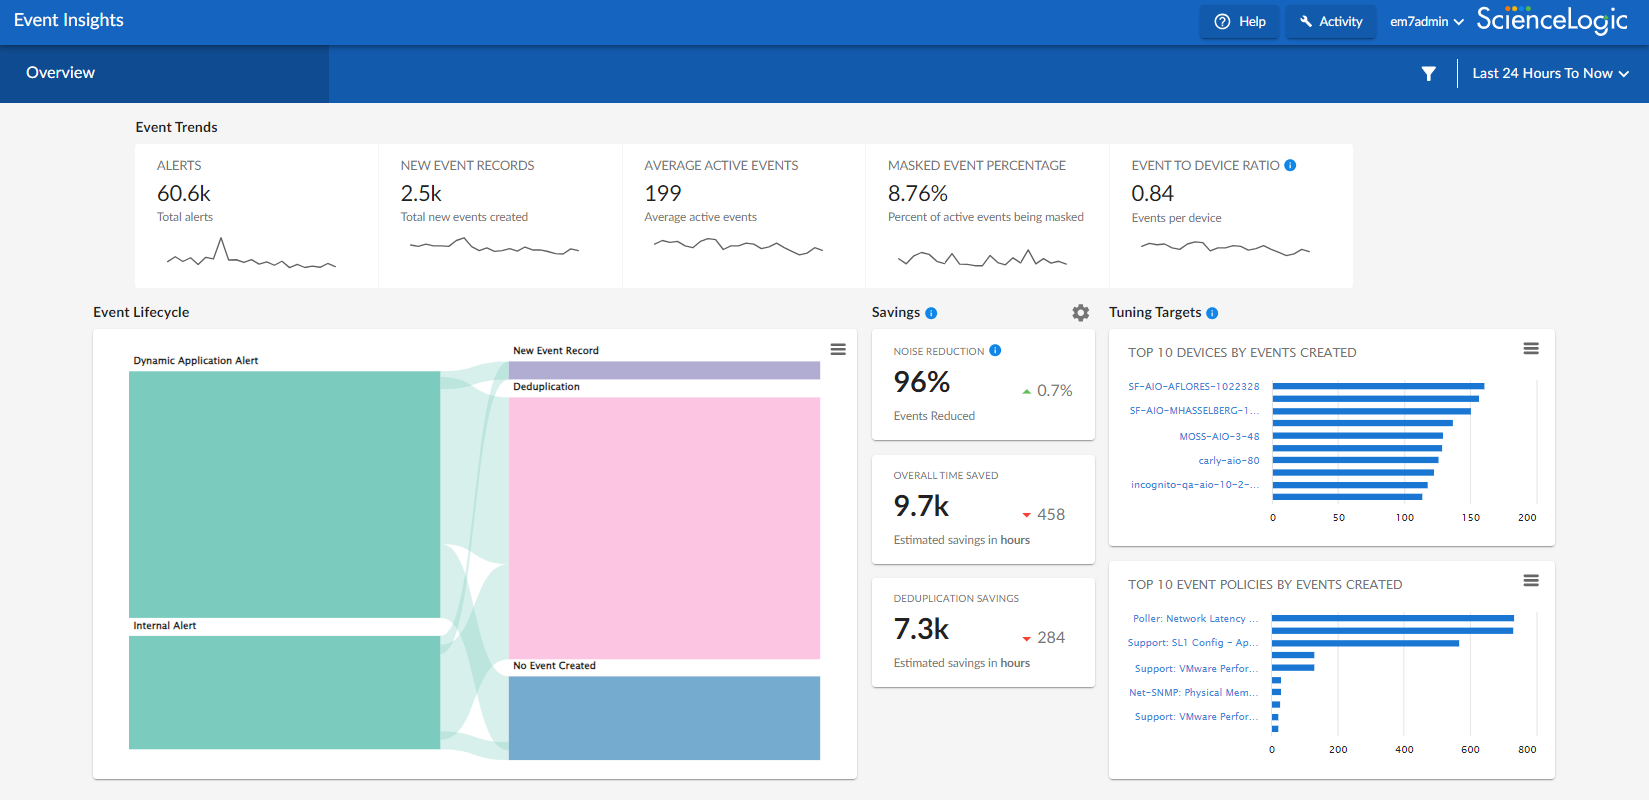
Elements of the Event Insights Page
The widgets displayed on the Event Insights page include:
- Event Trends. Displays a device's alert and event metrics in number and line-chart form.
- Event Lifecycle. Provides a visual Sankey chart containing metrics for source alerts and their event life-cycle's results.
- Savings. Highlights a system's "Noise Reduction" percentage, "Overall Time Saved" estimate, and "Deduplication Savings" estimate. These estimates are based on the defined-time estimate taken to triage a Skylar One event.
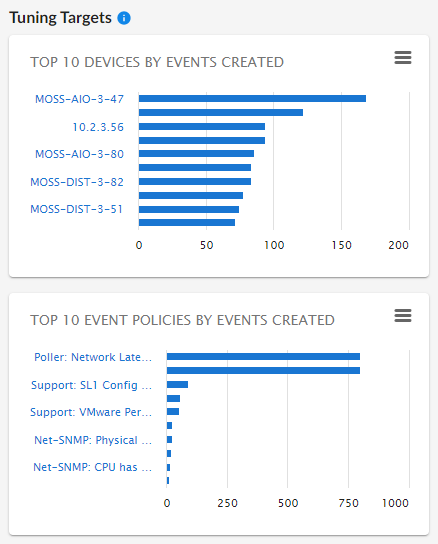
- Tuning Targets. Displays two bar-charts: the top-10 most utilized Event Policies and top-10 noisiest devices by event volume. These two charts are based on the page's time context.
Event Trends
The Event Trends widget includes data metrics based on your organizational alignment.
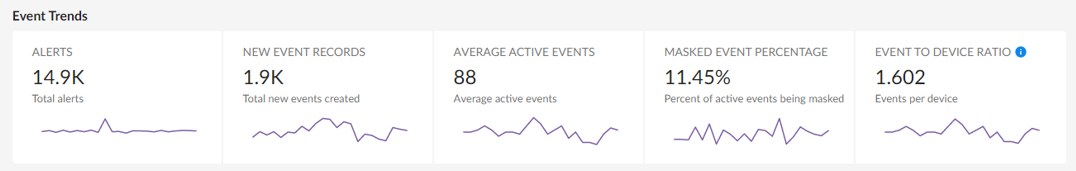
The data metrics include the following:
- Alerts. Displays the total number of alerts generated from the formula in Skylar One.
- New Events Records. Specifies the total number of actual new events created.
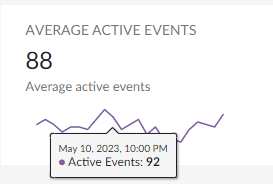
- Average Active Events. Displays the average number of active events.
- Masked Event Percentage. Shows the ratio of masked events to the total events created; this ratio is also displayed over a time series. The closer this value is to 1, the higher the number of masked events.
- Event to Device Ratio. Displays the ratio of total events created to the number of active devices; it is also displayed over a time series. The closer this value is to 0, the fewer the events per device.
NOTE: Not every alert will trigger an event, and some alerts could trigger more than one event record.
Event Lifecycle
The Event Lifecycle widget provides a visual Sankey chart for event lifecycle metrics.
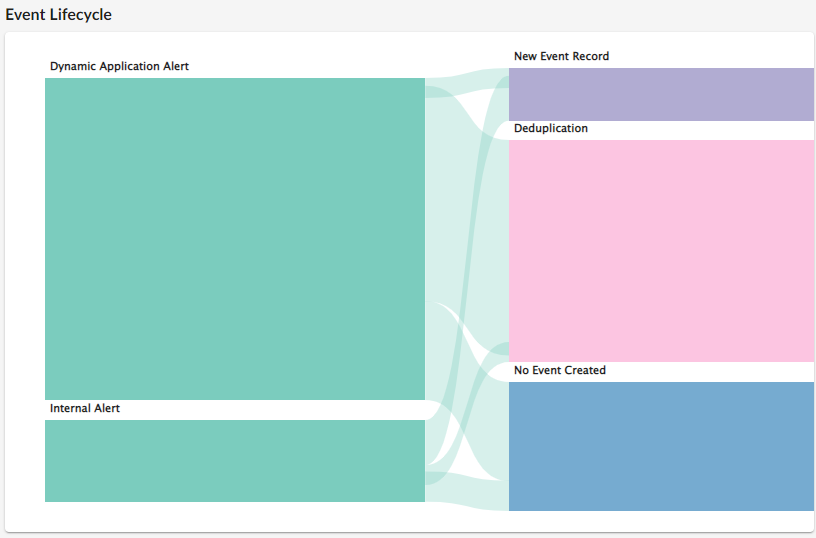
The screen above only shows two types of alerts for this specific system: a Dynamic Application Alert and Internal Alert. However, a system can contain a wide variety of alerts. See them listed below.
The first column of this chart depicts the total number of alerts generated by your system; the blocks displayed are broken into the following source alerts:
- API. Message is generated by inserting a message into the main database. These messages can be inserted by a snippet automation action, a snippet Dynamic Application, or by a request to the ScienceLogic API. For more information on snippet automation actions,
- Dynamic Application. Message is generated by a Dynamic Application alert. Dynamic Applications are customizable policies that tell Skylar One how to monitor applications and devices. You can define alerts in Dynamic Applications. An alert can trigger events based on the data collected by the Dynamic Application. Alerts allow you to examine and manipulate values retrieved by Dynamic Applications. When an alert evaluates to TRUE, the alert inserts a message in the associated device's device log. Skylar One examines each new message in the device log and determines if the message matches an event definition. If the message matches an event definition, Skylar One generates an instance of that event. For example, an alert might be defined to evaluate to TRUE if the temperature of a chassis exceeds 100 degrees Fahrenheit. If the chassis temperature exceeds 100 degrees at some point in the future, Skylar One inserts a message in the associated device's log files. Skylar One then matches that message with an existing event, and then triggers the event.
- Internal. Internal Collections, such as Availability, Latency, Network Interface Collection, Monitors, and more. Skylar Onemanifests "internal" alerts that result in events aligned against devices.
- SNMP Trap. Message is generated by an SNMP trap. SNMP traps can be sent by devices and proxy devices like MoMs. An SNMP trap is an unsolicited message from a device to Skylar One. A trap indicates that an emergency condition or a condition that merits immediate attention has occurred on the device. For more information on traps,
- Syslog. Message is generated by the syslog protocol. Syslogs can be sent by devices and proxy devices such as managers of managers (MoM). A syslog is an unsolicited message from a device to Skylar One. Syslog is a standard log format supported by most networking and UNIX-based devices and applications. Windows log files can be converted to syslog format using conversion tools. For more information on syslogs,
- Email. Message is generated by an email message sent to Skylar One.
- Skylar One agent. Message is generated by log file messages collected by the Skylar One agent.
The second column of this chart depicts data-blocks revealing the next step in the Event Lifecycle process:
- New Event Record. Total number of actual new events created.
- Deduplication. Total number of event occurrences, on the active event record, that appeared multiple times on the same device. Since Skylar One does not create new records for each occurrence (unless specified to do so), it updates the existing active event record, along with an incrementing count, to show an updated number of occurrences.
- No Event Created. Total number of events that were not created from the alerts.
NOTE: If a type of source alert does not show up in the Event Lifecycle widget, it means that specific source alert wasn't available to pull from the device.
Click the list icon(![]() ) to download either graph into a CSV report.
) to download either graph into a CSV report.
Savings
The Savings widget highlights an estimated amount of time saved in hours through Skylar One's built-in noise reduction mechanisms like deduplication. These calculations have been made using 10 minutes as the time taken to triage a single event record; they are also calculated based on the assertion that every alert resulted in a unique event record.
NOTE: The Savings widget's calculations are based on a subset of events, not all events total.
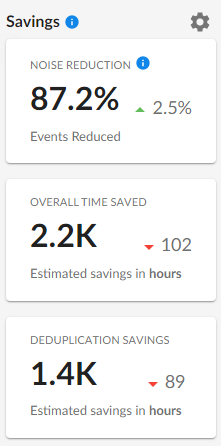
These tiles include:
-
Noise Reduction. Noise Reduction is the percentage of alerts that did not become new event records. A mature, tuned system will have a higher noise reduction percentage.
-
Overall Time Saved. Estimated time savings (in hours) from Skylar One's noise reduction mechanisms.
-
Deduplication Savings. Estimated deduplication savings (in hours) from Skylar One's noise reduction mechanisms.
This widget includes a modal where you can apply a set-time value to the Savings section's calculations. To view how to apply a set-time value, see the below section.
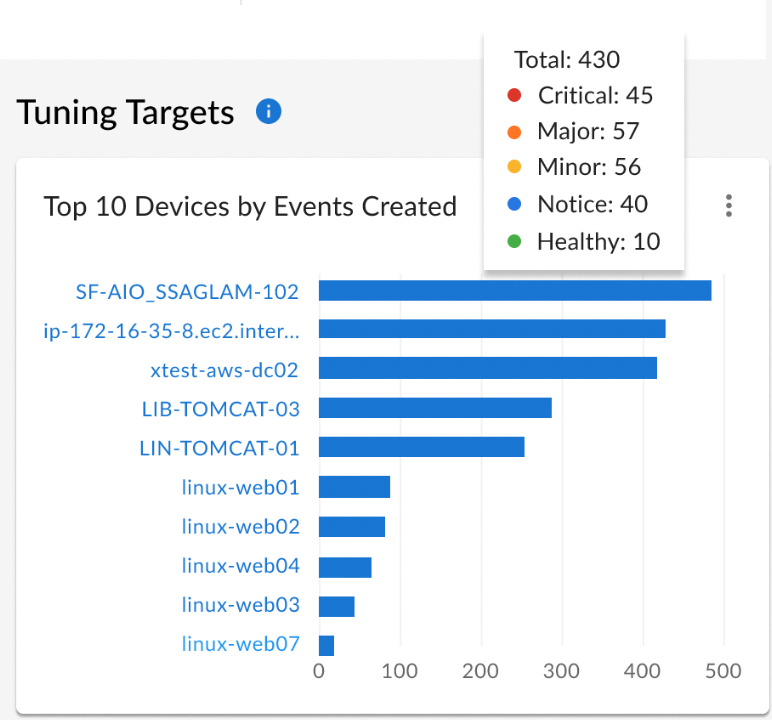
Tuning Targets
The Tuning Targets widget displays two graphs that depict the top 10 noisiest devices and top-10 event policies in your system. These two charts are based on the page's time context.
Click the list icon(![]() ) to download either graph into a CSV report.
) to download either graph into a CSV report.
Interacting with the Event Insights Widgets
From the Event Insights page (Events > Event Insights), you can interact with the various data-metric widgets by selecting line-chart data points and hovering over Sankey chart information.
To view the Event Trends widget's line-chart data points:
- Go to the Event Insights page (Events > Event Insights).
- Select a data point along either of the line-charts associated with your desired Event Trends widget.
The following data point's text-box appears and displays a specific time stamp and its number of alerts:
To view specific Event Lifecycle widget's bar-chart information:
-
Go to the Event Insights page (Events > Event Insights).
-
Hover your mouse over a desired Sankey chart metric in the widget.
The following chart metric pop-up appears and displays a bar-chart text box containing relational values from alert links and reviewable severity numbers for new event-records created: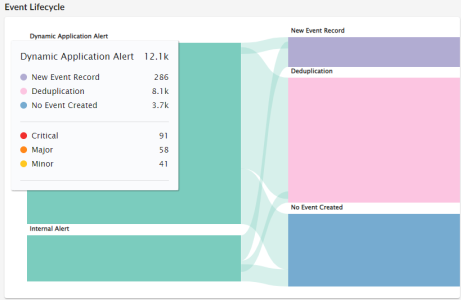
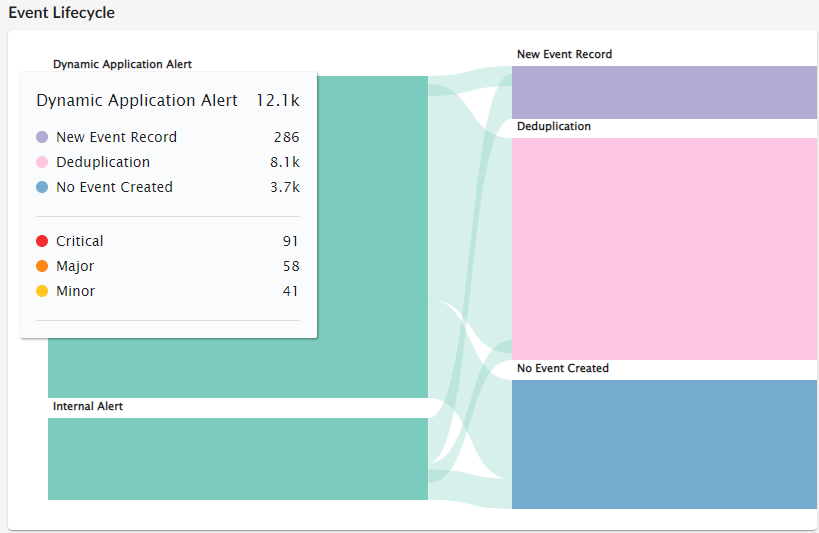
NOTE: The height of a chart's nodes reflects higher volumes of the metric. The thickness of the connectors shows you what is happening to the majority of the data, such as deduplication, event created, and so on.
To edit Savings widget calculations and savings information:
-
Go to the Event Insights page (Events > Event Insights).
-
Click the gear icon (
 ) located to the right of the widget.
The Savings Settings modal appears. -
Enter the amount of time that your organization takes to triage a single event. The default value shows 10 (in minutes).
-
Click to complete. You can click to reset the default values.
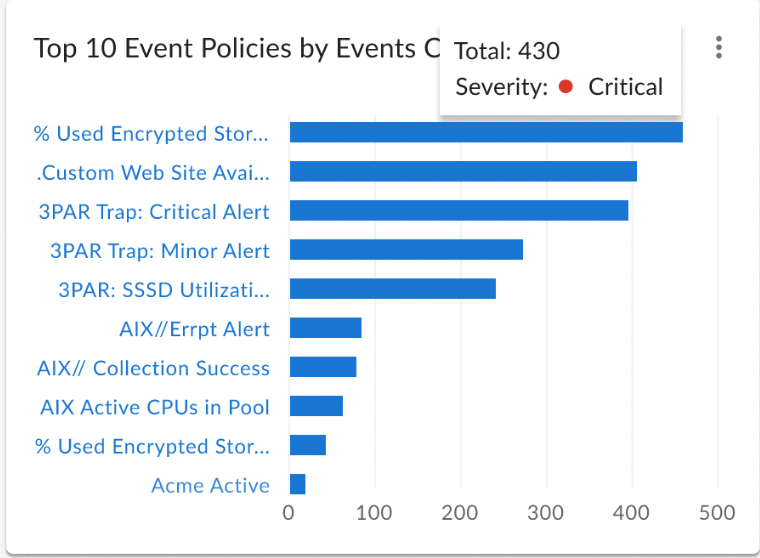
To view specific or further information within the Tuning Targets widget's charts:
-
Go to the Event Insights page (Events > Event Insights).
-
Select a data point within the bar-chart(s) that is associated with your desired device and/or event policy. The following data point's text-box appears and displays a specific count for that device or event policy:

-
To view further Device or Event Policy information within the Tuning Targets widget, you can click the linked device or event policy. After your selection, Skylar One will redirect you to the appropriate device or event policy page.
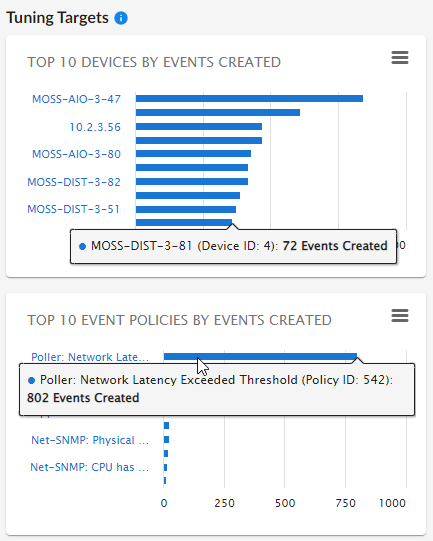
To access even more data that is included in the Tuning Targets widgets' bar graphs, hover your mouse over either the “Top 10 Devices by Events Created” or “Top 10 Event Policies by Events Created” bar-graph widgets to view different points in the graph that display the count of events created for each severity, as well as the overall event total count for each device/event policy.