![]()
Use the following menu options to navigate the Skylar One user interface:
- To view a pop-out list of menu options, click the menu icon (
 ).
). - To view a page containing all of the menu options, click the Advanced menu icon (
 ).
).
Business Services Have Empty Values
All Business Services Have Empty Values
If all of your business services show empty values, ensure that you have given your admin processes adequate time to complete. To populate these values, both the "Business Services: Service Management Engine" and "Business Services: Service Topology Engine" processes must run once. With default settings, it could take up to 30 minutes to see your first results.
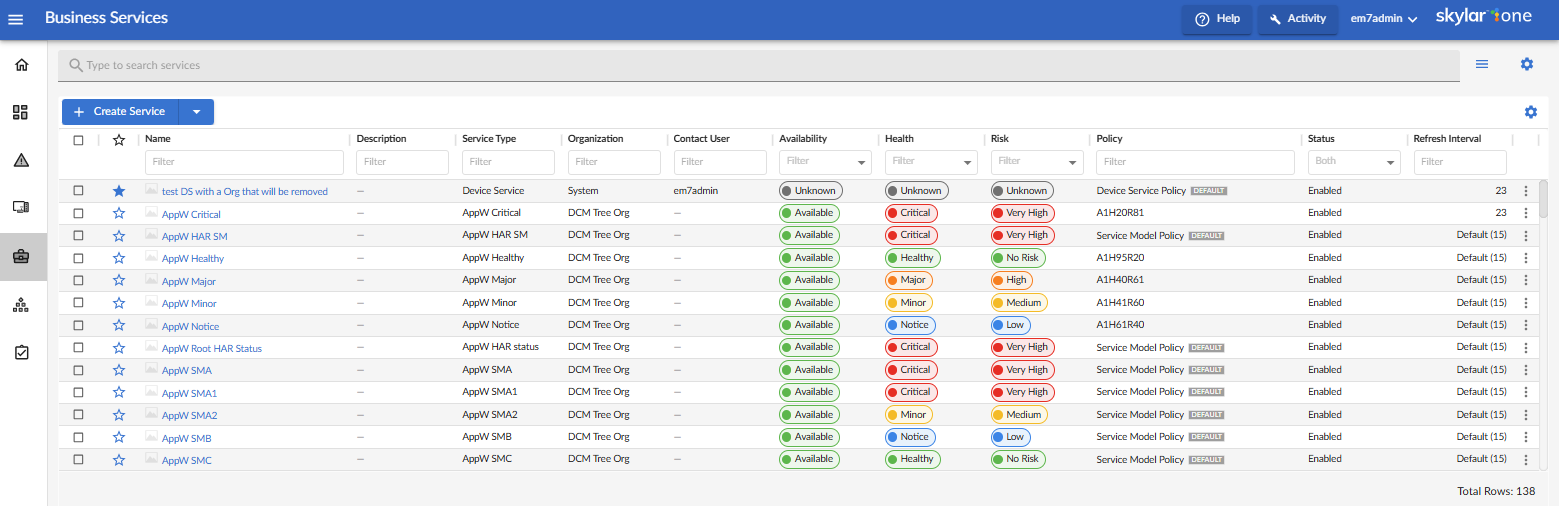
Services are not evaluated if they have an empty filter. For more information on using a filter, see the section on Creating a Service. The figure below shows the results of using a filter to find all devices for which the IP address begins with "10.2.":

Some Business Services Have Empty Values
If only some of your business services are missing values, troubleshoot using the following procedure:
-
Ensure that your business service has some constituents:
-
Go to the Business Services page (
 ).
). -
Select the service that is missing values. The Service Investigator appears.
-
Click .
-
Click the or tab and review the devices or services listed. Modify your query as needed.
-
Ensure that your service policy results in some constituents. Click on the tab and modify your service policy as needed.
-
Click .

Services Missing Up-to-Date Values
If you have disabled the default administrator account ("em7admin"), you will need to identify another account to use for running business services and run a database query to change the account used for internal communication in Skylar One.
To change the internal account:
-
Go to the User Accounts page (Registry > Accounts > User Accounts).
-
Identify the account you want Skylar One to use for internal communication. Take note of the value that appears in the User ID column for that user account.
-
Update the internal account.
-
Go to the Database Tool page (System > Tools > DB Tool).
-
Select "master" as the database.
-
Enter the following SQL Query and then click :
UPDATE
   master.system_settings_core
SET
   api_internal_account =<account_id>
Where <account_id> is the ID number of the account you want to use.
The Database Tool page is available only in versions of Skylar One prior to 12.2.1 and displays only for users that have sufficient permissions to access the page. Alternatively, if you are not a SaaS user, you can use SSH or a separate software to access the Database Server.
Some Services Fail to Generate Health, Availability, or Risk Values
Access Log Messages For Warnings or Errors
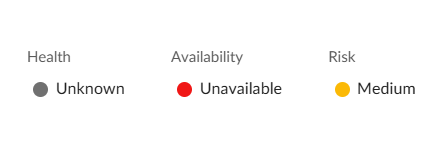
In this situation, some services in Skylar One do not generate any values for Health, Availability, or Risk. For example, "Unknown" might appear instead of a value in one of the widgets on the Service Investigator page:
To address this issue, review the following settings and suggestions:
Step 1: Turn up the log level to trace:
- Either go to the console of the Skylar One server or use SSH to access the Skylar One appliance.
- Log in as user em7admin.
- Open the nextui.env file with vi or another text editor:
If you are a SaaS user, you cannot access the Skylar One appliance with SSH. Instead, go to the Developer Logs page (System > Tools > Skylar One Developer Logs) to obtain trace-level logs.
sudo vi /usr/local/silo/nextui/nextui.env
- Change the log setting to the following: NEXT_UI_LOG_LEVEL=all:trace
- Restart Skylar One and GraphQL with the following command:
sudo systemctl restart nextui
- Tail the log with the following command:
sudo journalctl -u nextui -f
Step 2: Ensure that your service policy is valid:
- In Skylar One, go to the Business Services page.
- Select your service. The Service Investigator appears.
- Click .
- Click the tab.
- Review the policy used by that service for any validation errors.
- Address any errors in the service policy, and then click .
Step 3: Ensure that your service contains at least one service or device:
-
Go to the Business Services page.
-
Select your service. The Service Investigator appears.
-
Click .
-
Click the or tab for the service or services that are not displaying values.
-
Ensure that at least one device or service appears in the Preview section. If not, create a new filter to search for devices or services.
-
When you are finished, click Save.
Step 4: Generate audit data by running onDemandProcessing with GraphQL:
The onDemandProcessing GraphQL query currently retrieves data by calculating the "lastValue" in the last three intervals. If the value of the two most recent intervals is null, the system will log the calculation as incomplete because the metrics did not exist during that time.
-
Go to the GQL Browser page (System > Tools > GQL Browser).
-
In the left pane, type the following query:
query onDemand {
  harProviderOnDemandProcessing(ids: []) {
    results {
      serviceId
      timestamp
      health
      availability
      risk
    }
    auditHistory {
      serviceId
      ruleSetId
      ruleId
      timestamp
      sequence
      message
    }
  }
}
- Click the (Play) button.
- Review the resulting audit information in the right pane.
- If you know the service ID you are looking for, search for it by clicking inside the right pane and pressing Ctrl+F. The GQL Browser highlights the services that match the ID you searched for:

- Scroll down to see the audit information for this service (look for the highlighted information):

The onDemandProcessing GraphQL query displays timing data. This includes the total number of services examined, the maximum time required to calculate these values for all included services, and the individual time taken for each service.


- After running the onDemandProcessing query and updating the log settings on the server to do all:trace, you can now see trace-level log messages in the terminal where you ran sudo journalctl -u nextui -f in Step 1.
If you are a SaaS user, you can download the log files from the Developer Logs page (System > Tools > Skylar One Developer Logs).
- Review the log messages for errors and warnings:

Check if Services Have Over 100 Constituents
Services will overload if they have over 100 constituents. Ensure that all of your business, IT, device, and custom (N-tier) services have less than or equal to 100 constituents.
To check if a service has over 100 constituents:
- Go to the Business ServicesBusiness Services page.
- Select the service you are reviewing. The Service Investigator appears.
- Click .
- Click the or tab.
- Make sure that the chosen service does not have more than 100 constituents.
You can also check if your services have over 100 constituents by running SQL commands to search and return your results.
- Either go to the console of the Skylar One Database Server or use SSH to access the Skylar One appliance.
- Run the following SQL queries to check if the types of services you are searching for have over 100 constituents:
For Device services: SELECT parent_id, count(child_id) FROM master_ap2.topo_service_relationships where link_type = 200 group by parent_id having count(*) > 100;
For IT or Business services: SELECT parent_id, count(child_id) FROM master_ap2.topo_service_relationships where link_type = 201 group by parent_id having count(*) > 100;
For N-tier services: SELECT parent_id, count(child_id) FROM master_ap2.topo_aggregate_services group by parent_id having count(*) > 100;
ScienceLogic recommends searching for services that have over 80 constituents to identify those services approaching the 100-constituent limit.
If you are a SaaS user, you cannot access the Skylar One appliance via SSH. Instead, go to the Developer Logs page (System > Tools > Skylar One Developer Logs) to obtain trace-level logs.
All Services Fail to Generate Health, Availability, and Risk Values
If you are a SaaS user experiencing this issue, contact ScienceLogic Support: https://support.sciencelogic.com/s/contactsupport
In this situation, all of your services in Skylar One fail to generate any values for health, availability, or risk.
To address this issue, review the following settings and suggestions.
Step 1: Confirm that the Business Services processes exist:
- Go to the Process Manager page (System > Settings > Admin Processes) and start typing "Business" in the Process Name filter.
- Ensure that the "Business Services: Service Management Engine" and "Business Services: Service Topology Engine" processes appear and are enabled.
Step 2: Follow the steps in Generate audit data using GraphQL, above. If the process times out, then the processing has taken more than two minutes to complete, and no computed results are stored.
Step 3: Look for logs from the Python process:
- The Python process calls the onDemandProcessing GraphQL query. If Python is having trouble connecting to GraphQL, it could be an authentication problem or some other code-related issue.
- Look in /var/log/em7 for newly created logs, and use the command ls -lrt to see if any new error logs were created with "business" in the file name.
- Also check the silo.log for messages related to the business_service_management process by using the following command:
grep service /var/log/em7/silo.log
Device Services Fail to Load After an Upgrade
If you have upgraded Skylar One from an earlier version and your device services are not loading on the Business Services page, you might have outdated device class filters in your user preferences.
To clear the older device class filters:
-
Go to the GQL Browser page (System > Tools > GQL Browser).
-
In the left pane, type the following mutation:
mutation deletePreference{ deletePreference(preferenceId: "services.detaildevices.table.sort.order") { id preferenceValue } } -
Click the (Play) button.
502, 503, or 504 Errors: Health, Availability, and Risk Values are All the Same or are Inaccurate
If you are a SaaS user experiencing this issue, contact ScienceLogic Support: https://support.sciencelogic.com/s/contactsupport
Step 1: Check the number of services you have configured. If you are seeing 503 errors in the nextui log or within the Skylar One user interface, use the following procedure to check the number of services you have configured on your Skylar One system.
To determine the number of services you have:
-
Go to the GQL Browser page (System > Tools > GQL Browser).
-
In the left pane, type the following query:
query harProviders {
  harProviders {
    pageInfo {
      matchCount
    }
  }
}
-
Click the [Execute Query] (Play) button to see the number of services. In this example, the results shows that 10 services are configured.
"data": {
  harProviders {
    pageInfo {
      matchCount: 10
    }
  }
}
Step 2: (503 Errors) Confirm that the nginx configuration has an appropriate limit set. In some cases, the limit_conn value might be set to 20. Increase the value to 200.
To address this issue:
-
Either go to the console of the Skylar One server or use SSH to access the Skylar One appliance.
-
Log in as user em7admin.
-
Confirm that the nginx config file has the limit_conn perip value set to 200 instead of 20:
sudo vi /etc/nginx/conf.d/em7_limits.conf
-
If needed, update the line to say:
limit_conn perip 200;
-
Run the following command:
sudo systemctl restart nginx
Step 3: (503 Errors) Check to see if the nginx server is rate-limiting you.
-
Either go to the console of the Skylar One server or use SSH to access the Skylar One appliance.
-
Log in as user em7admin.
-
Enter the following command:
sudo grep excess /var/log/em7/ngx.log
-
If you see any results from the above command, then the nginx proxy is rate-limiting requests to your database. In that case, you should increase the rate limit to 100 requests per second. Edit the em7_limits.conf file:
sudo vi /etc/nginx/conf.d/em7_limits.conf
-
Change the following line to 100r/s from the default 5 r/s:
limit_req_zone $binary_remote_addr zone-addr_req:10m rate=100r/s;
-
Restart your Skylar One system:
sudo systemctl restart nextui
Step 4: (502 Errors) Check node memory usage.
-
Either go to the console of the Skylar One server or use SSH to access the Skylar One appliance.
-
Log in as user em7admin.
-
Enter the following command:
sudo journalctl -u nextui|grep "JavaScript heap out of memory"
-
If you see any results form the above command, the node.js process is running out of memory. In that case, you should increase the space limit allocated. Edit the nextui.service to increase memory to 4096 or 8192 MB, depending on how much memory you have at your disposal:
ExecStart=/usr/bin/node --max-old-space-size=4096 /usr/local/silo/nextui/index.js
-
Restart your Skylar One system:
sudo systemctl restart nextui
Step 5: (504 Errors) Check Nginx timeout.
-
Either go to the console of the Skylar One server or use SSH to access the Skylar One appliance.
-
Log in as user em7admin.
-
Edit the nextui.fragment file:
sudo vi /opt/em7/share/config/nginx.d/nextui.fragment
-
Change the proxy_read_timeout under "location /gql" to 900 as follows:
proxy_read_timeout 900;
-
Restart your Skylar One system:
sudo systemctl restart nextui
Advanced Troubleshooting
If you are a SaaS user experiencing any of the following issues, contact ScienceLogic Support: https://support.sciencelogic.com/s/contactsupport.
Customization for Environments with More Than 2,500 Services
If you have an environment that has more than 2,500 services, you might need to modify some default settings in Skylar One, as described in this section.
Update Settings and Increase Default Values
To update your settings and increase your default values:
- Either go to the console of the Skylar One server or use SSH to access the Skylar One appliance.
- Log in as user em7admin.
- Increase the maximum service count variable. (The default value is 2500.)
-
At the command line, enter:
sudo vi /opt/em7/nextui/nextui.env
-
Add the following line (or modify it, if it already exists), where <new_service_limit> is the maximum number of services you need in your environment:
BUSINESS_SERVICES_MAX_SERVICES=<new_service_limit>
- Increase the Node.js memory limit.
-
At the command line, enter:
sudo vi /etc/systemd/system/multi-user.target.wants/nextui.service
-
Change the ExecStart line to the following, where the size is either 4096 or 8192, depending on how much memory you have available:
ExecStart=/usr/bin/node --max-old-space-size=size /usr/local/silo/nextui/index.js
-
Restart nextui by entering the following at the command line:
sudo systemctl restart nextui
Modify NGINX Rate Limit
If you have a large number of services in your environment and are seeing 503 errors, you might need to increase your NGINX rate limit.
To increase your NGINX rate limit:
- Either go to the console of the Skylar One server or use SSH to access the Skylar One appliance.
- Log in as user em7admin.
-
At the command line, enter the following:
sudo grep excess /var/log/em7/ngx.log
-
If you see any results from this command, consider increasing your NGINX rate limit to 100 requests per second.
-
Enter the following at the command line to edit the limit file:
sudo vi /etc/nginx/conf.d/em7_limits.conf
-
Change the <value> in the following line to "300r/s" from the default value of "100r/s":
limit_req_zone $binary_remote_addr zone=addr_req:10m rate=<value>
If this value is set too high, the database will begin experiencing errors for too many connections.
-
-
Restart NGINX:
sudo systemctl restart nginx