![]()
Version 102 of the Amazon Web Services: SL1 Dashboards PowerPack includes the addition of forecast widgets to some dashboards.
NOTE: These dashboards are intended for use only in the new SL1 user interface and will not load in the classic ScienceLogic platform user interface.
- Minimum Required SL1 Version: 8.12.1
- Minimum Required AP2 Version: 5.125.44
- Minimum Required Widget Components Version: 2.174.3
- Minimum Required Amazon Web Services PowerPack Version: 114
Before You Install or Upgrade
Before installing Amazon Web Services: SL1 Dashboards PowerPack version 102, you must first ensure that you are running version 8.12.1 or later of SL1.
NOTE: For details on upgrading SL1, see the appropriate Release Notes.
You must also import and install the Amazon Web Services PowerPack version 114 or later before installing the PowerPack.
Installing the PowerPack
To install this PowerPack:
- Familiarize yourself with the Known Issues for this release.
- See the Before You Install or Upgrade section. If you have not done so already, upgrade your system to the 8.12.1 or later release.
- Download the "Amazon Web Services: SL1 Dashboards" version 102PowerPack from the Support Site to a local computer.
- Go to the PowerPack Manager page (System > Manage > PowerPacks). Click the menu and choose Import PowerPack. When prompted, import "Amazon Web Services: SL1 Dashboards" version 102.
- Click the button. For details on installing PowerPacks, see the chapter on Installing a PowerPack in the PowerPacks manual.
Features
The following dashboards are included in version 102 of the Amazon Web Services: SL1 Dashboards PowerPack:
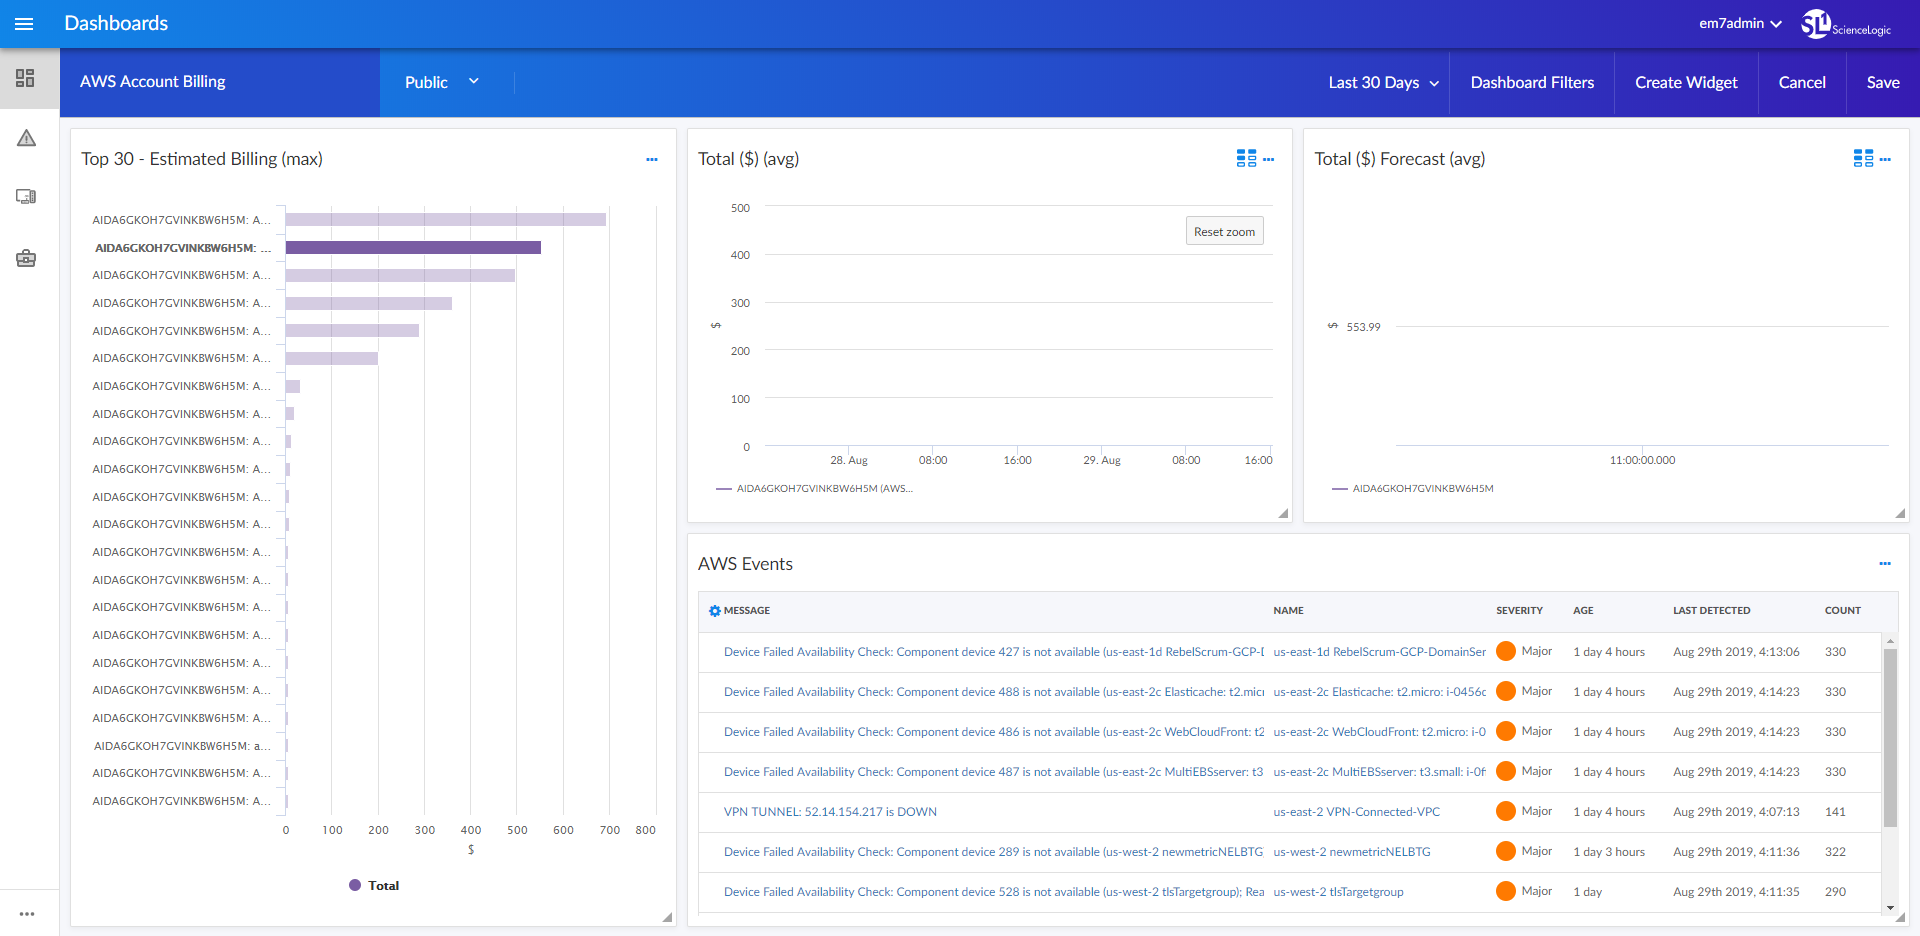
- An "AWS Account Billing" dashboard, which includes the following widgets that display data about your AWS account billing information:
- Top 30 - Estimated Billing (max)
- Total ($) (avg)
- Total ($) Forecast (avg)
- AWS Events
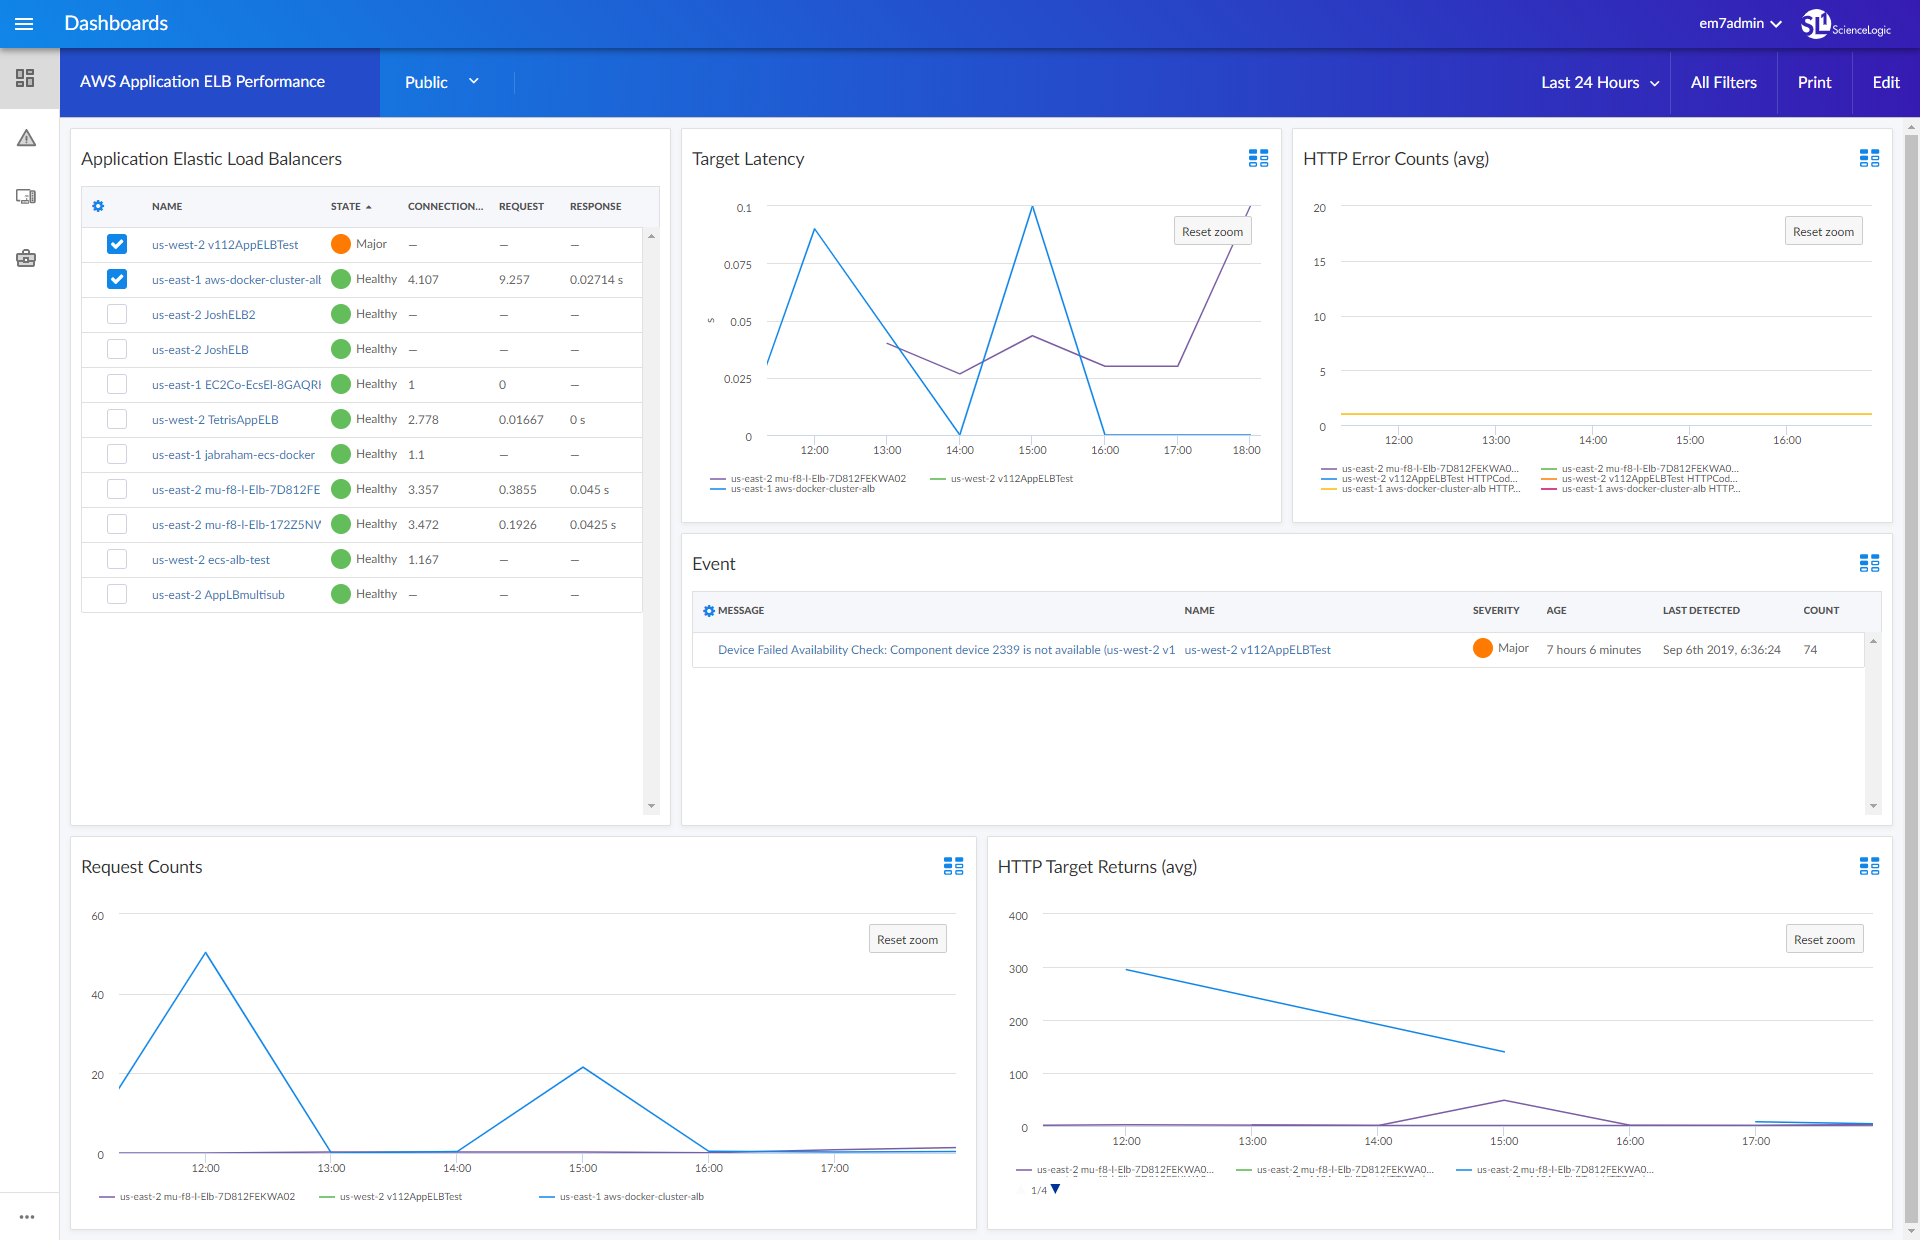
- An "AWS Application ELB Performance" dashboard, which includes the following widgets that display data about your AWS application ELB services:
- Application Elastic Load Balancers
- Target Latency
- HTTP Error Counts (avg)
- Events
- Request Counts
- HTTP Target Returns (avg)
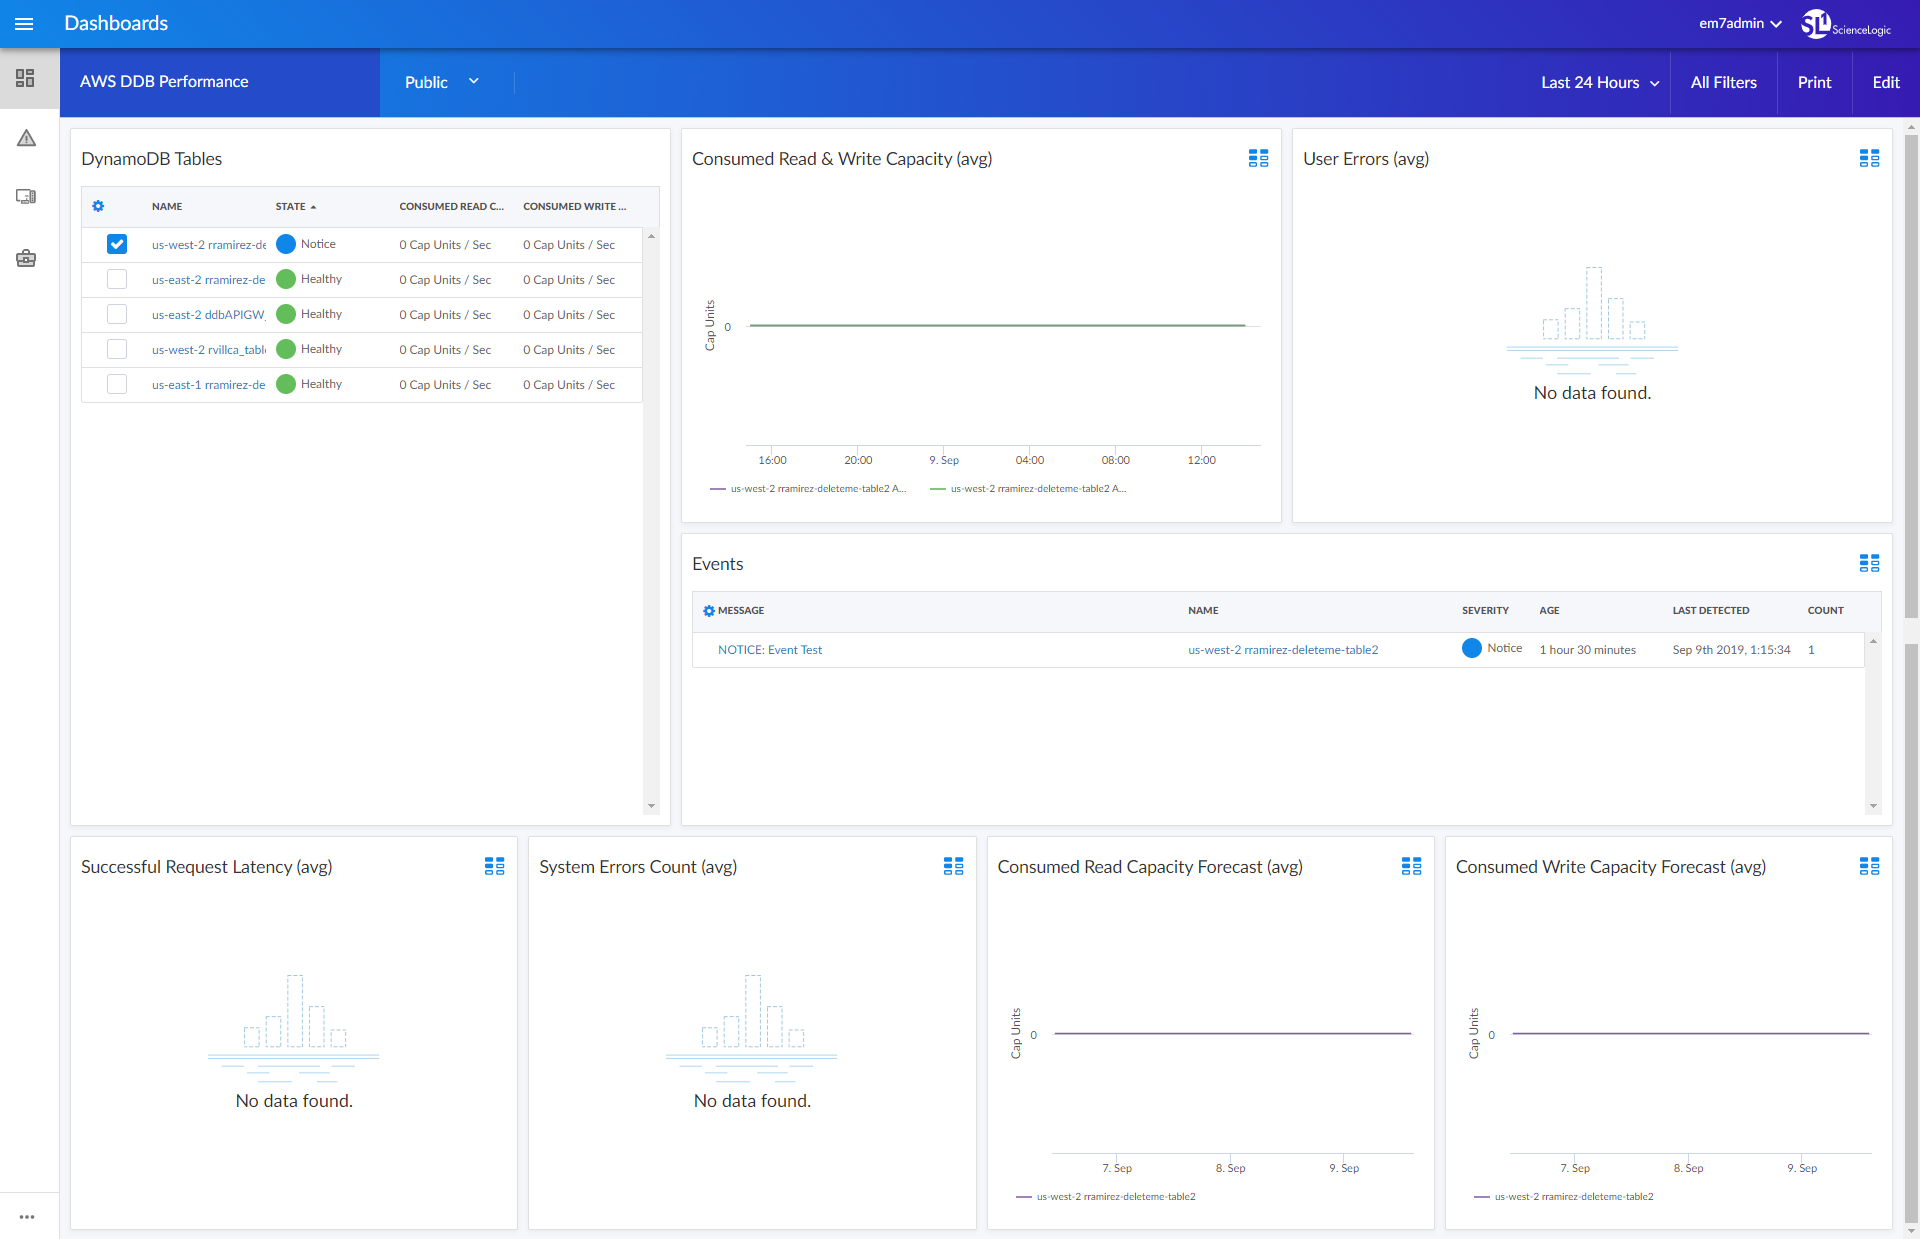
- An "AWS DDB Performance" dashboard, which includes the following widgets that display data about your AWS DDB tables:
- DynamoDB Tables
- Consumed Read & Write Capacity (avg)
- User Errors (avg)
- Events
- Successful Request Latency (avg)
- System Errors (avg)
- Consumed Read Capacity Forecast (avg)
- Consumed Write Capacity Forecast (avg)
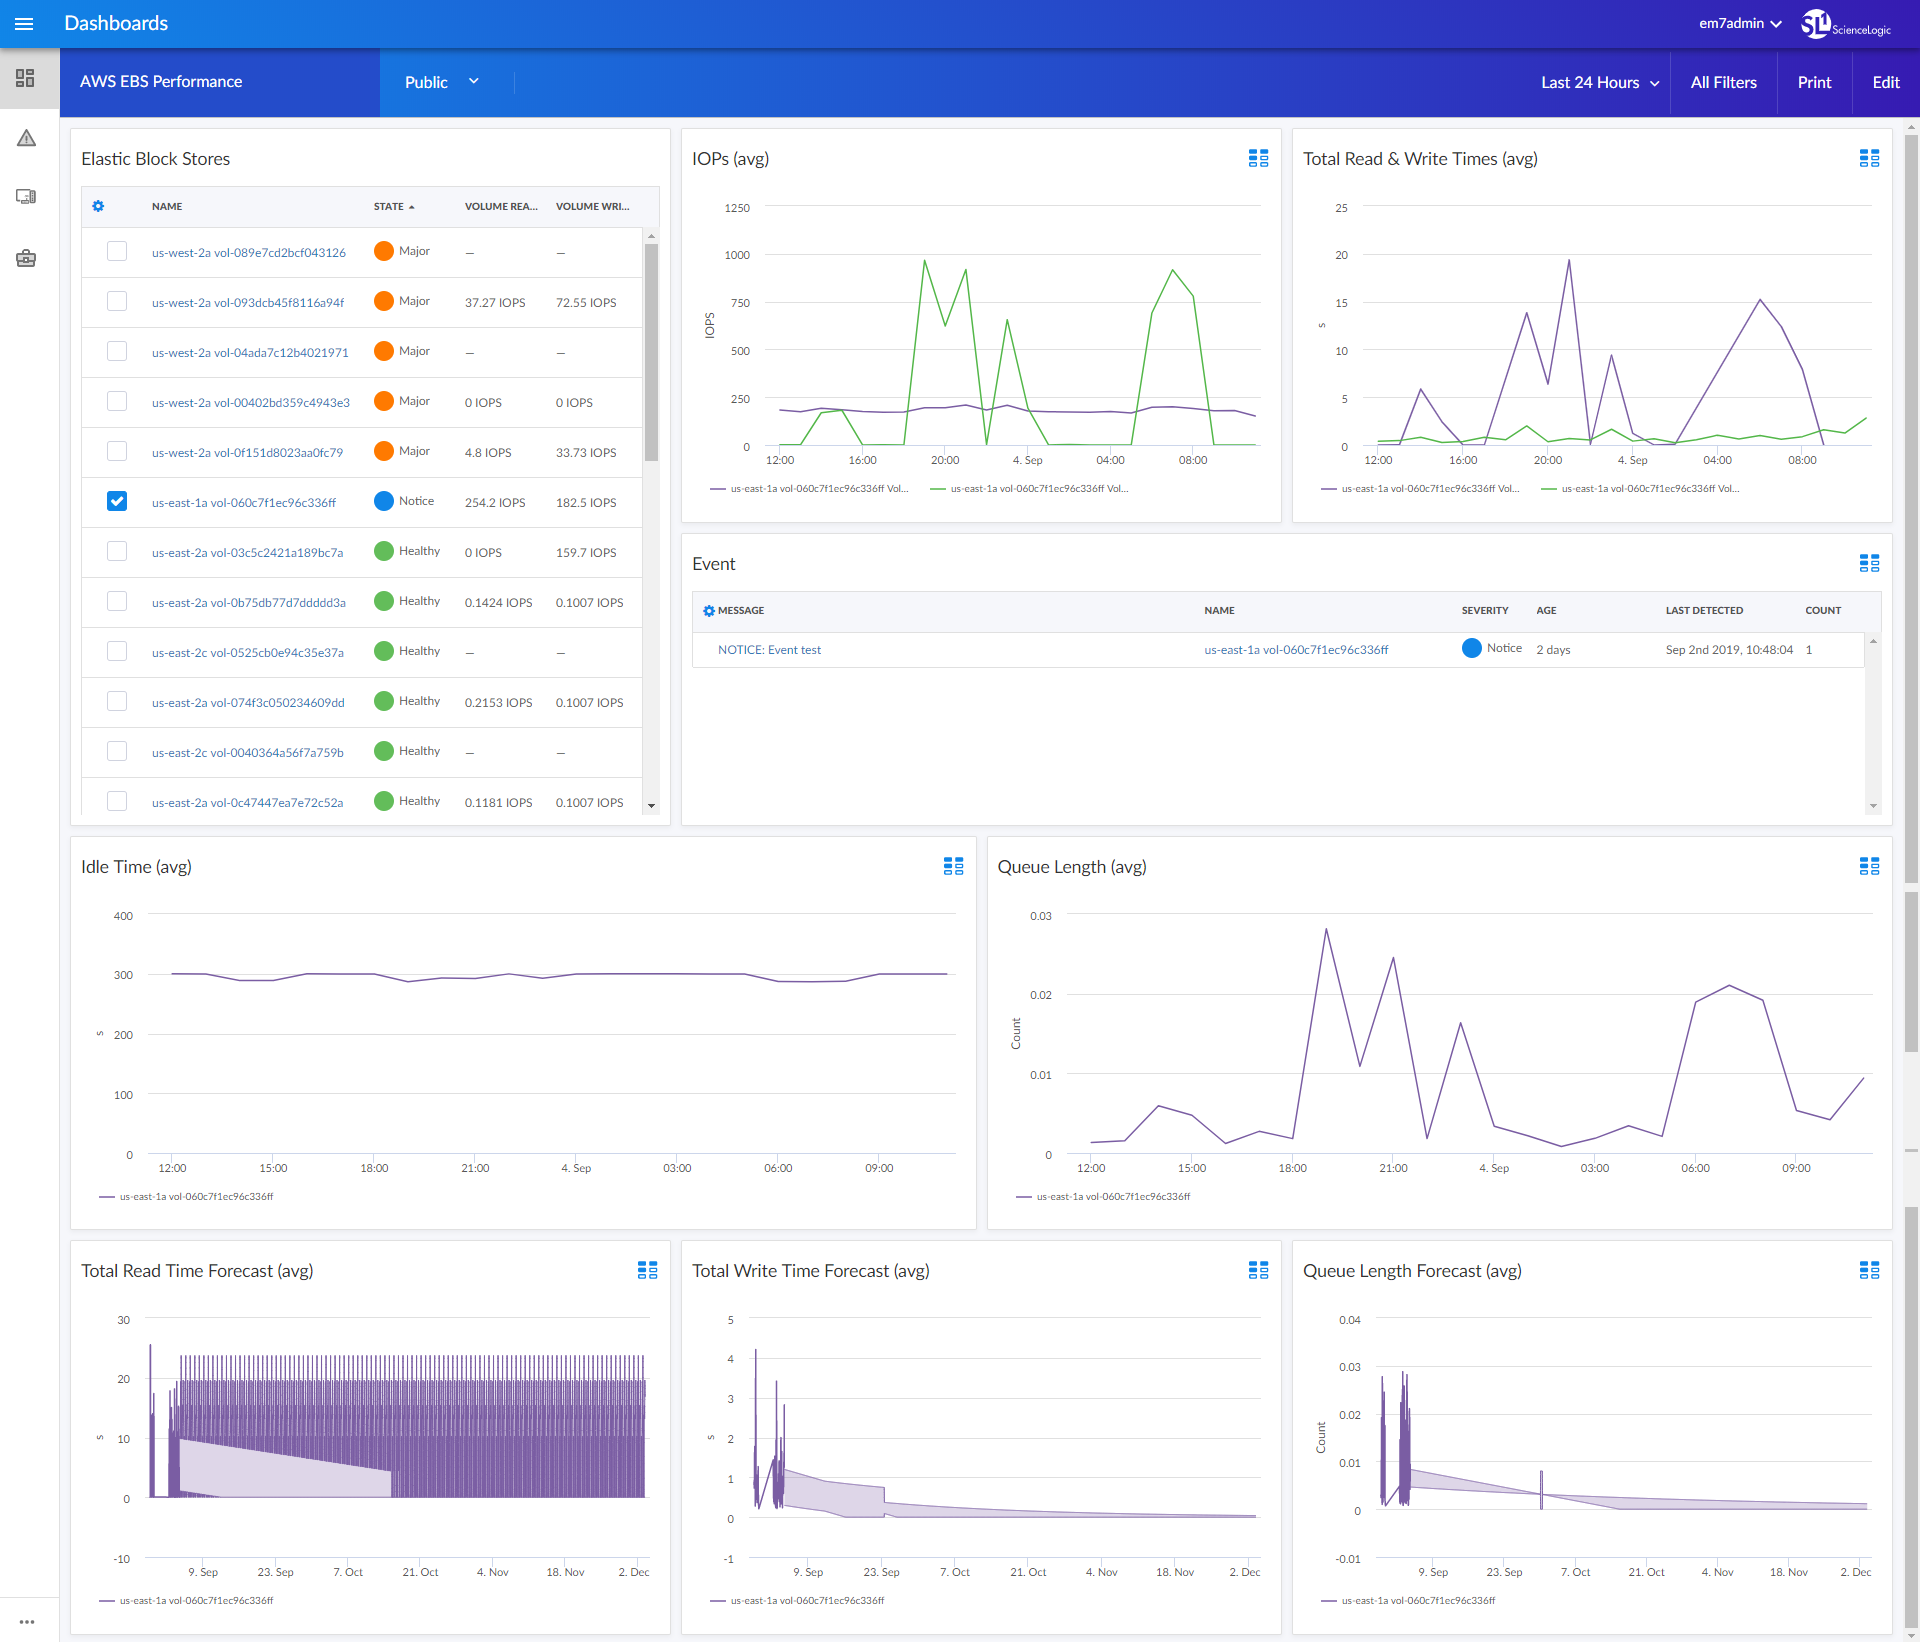
- An "AWS EBS Performance" dashboard, which includes the following widgets that display data about your AWS EBS volumes:
- Elastic Block Stores (avg)
- Input/Output per Second (avg)
- Total Read & Write Times (avg)
- Events
- Idle Time (avg)
- Queue Length (avg)
- Total Read Time Forecast (avg)
- Total Write Time Forecast (avg)
- Queue Length Forecast (avg)
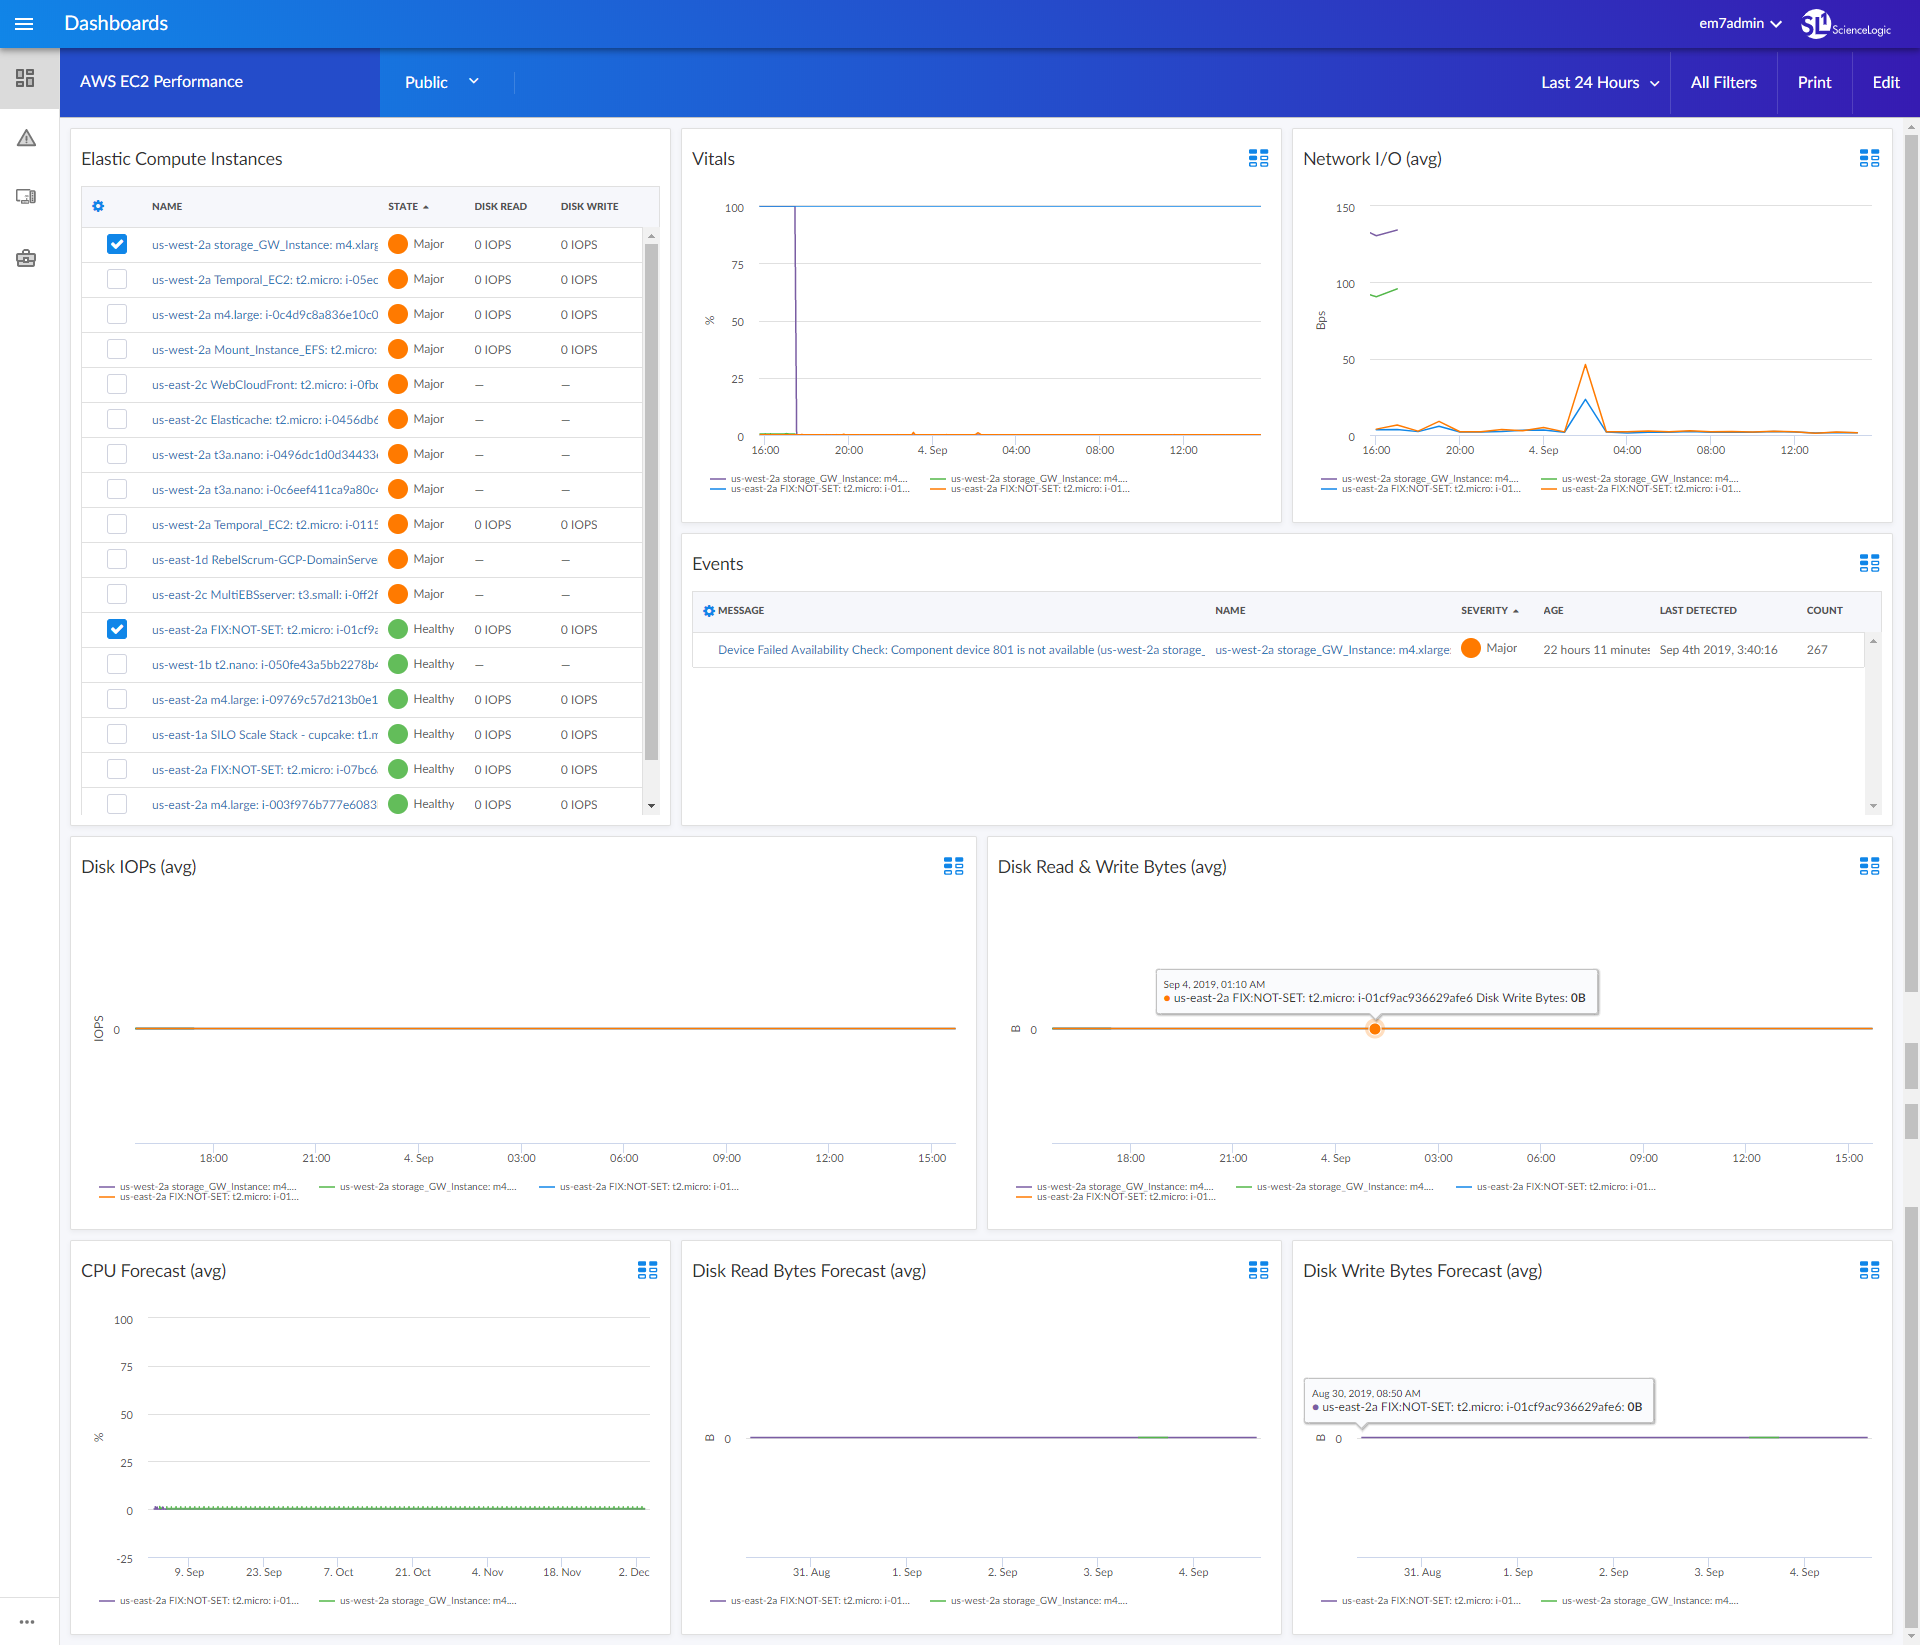
- An "AWS EC2 Performance" dashboard, which includes the following widgets that display data about your AWS EC2 instance devices:
- Elastic Compute Instances
- Vitals
- Network Input/Output (avg)
- Events
- Disk Input/Output per Second (avg)
- Disk Read & Write Bytes (avg)
- CPU Forecast (avg)
- Disk Read Bytes Forecast (avg)
- Disk Write Bytes Forecast (avg)
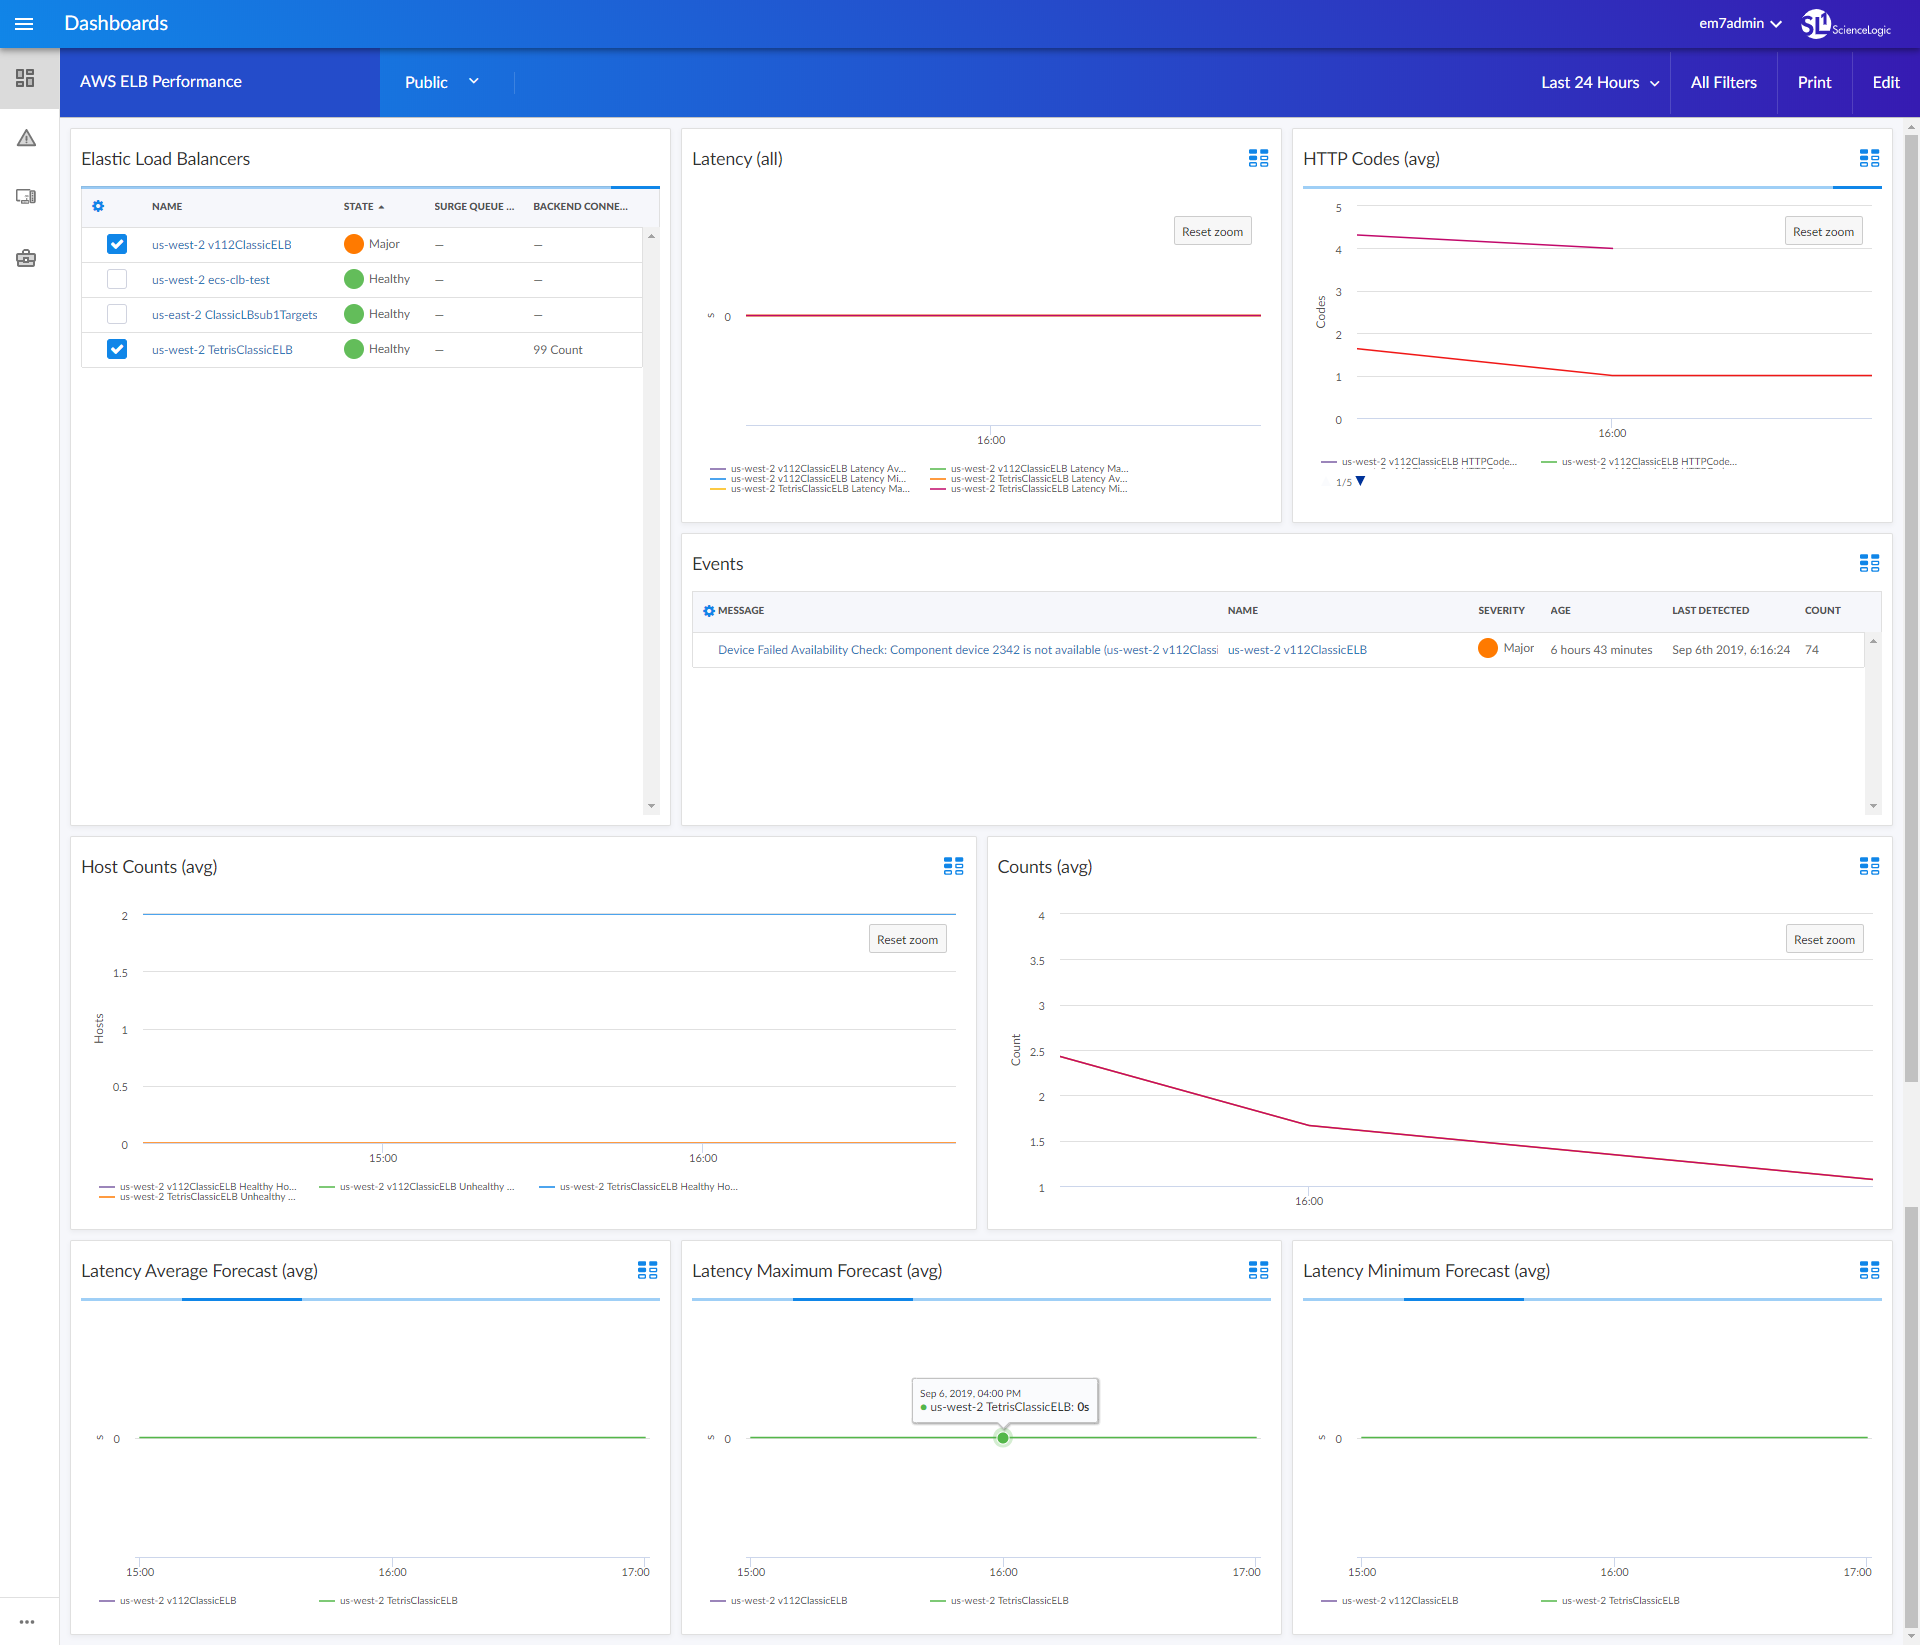
- An "AWS ELB Performance" dashboard, which includes the following widgets that display data about your AWS ELB instances:
- Elastic Load Balancers
- Latency (all)
- HTTP Codes (avg)
- Events
- Host Counts (avg)
- Counts (avg)
- Latency Average Forecast (avg)
- Latency Maximum Forecast (avg)
- Latency Minimum Forecast (avg)
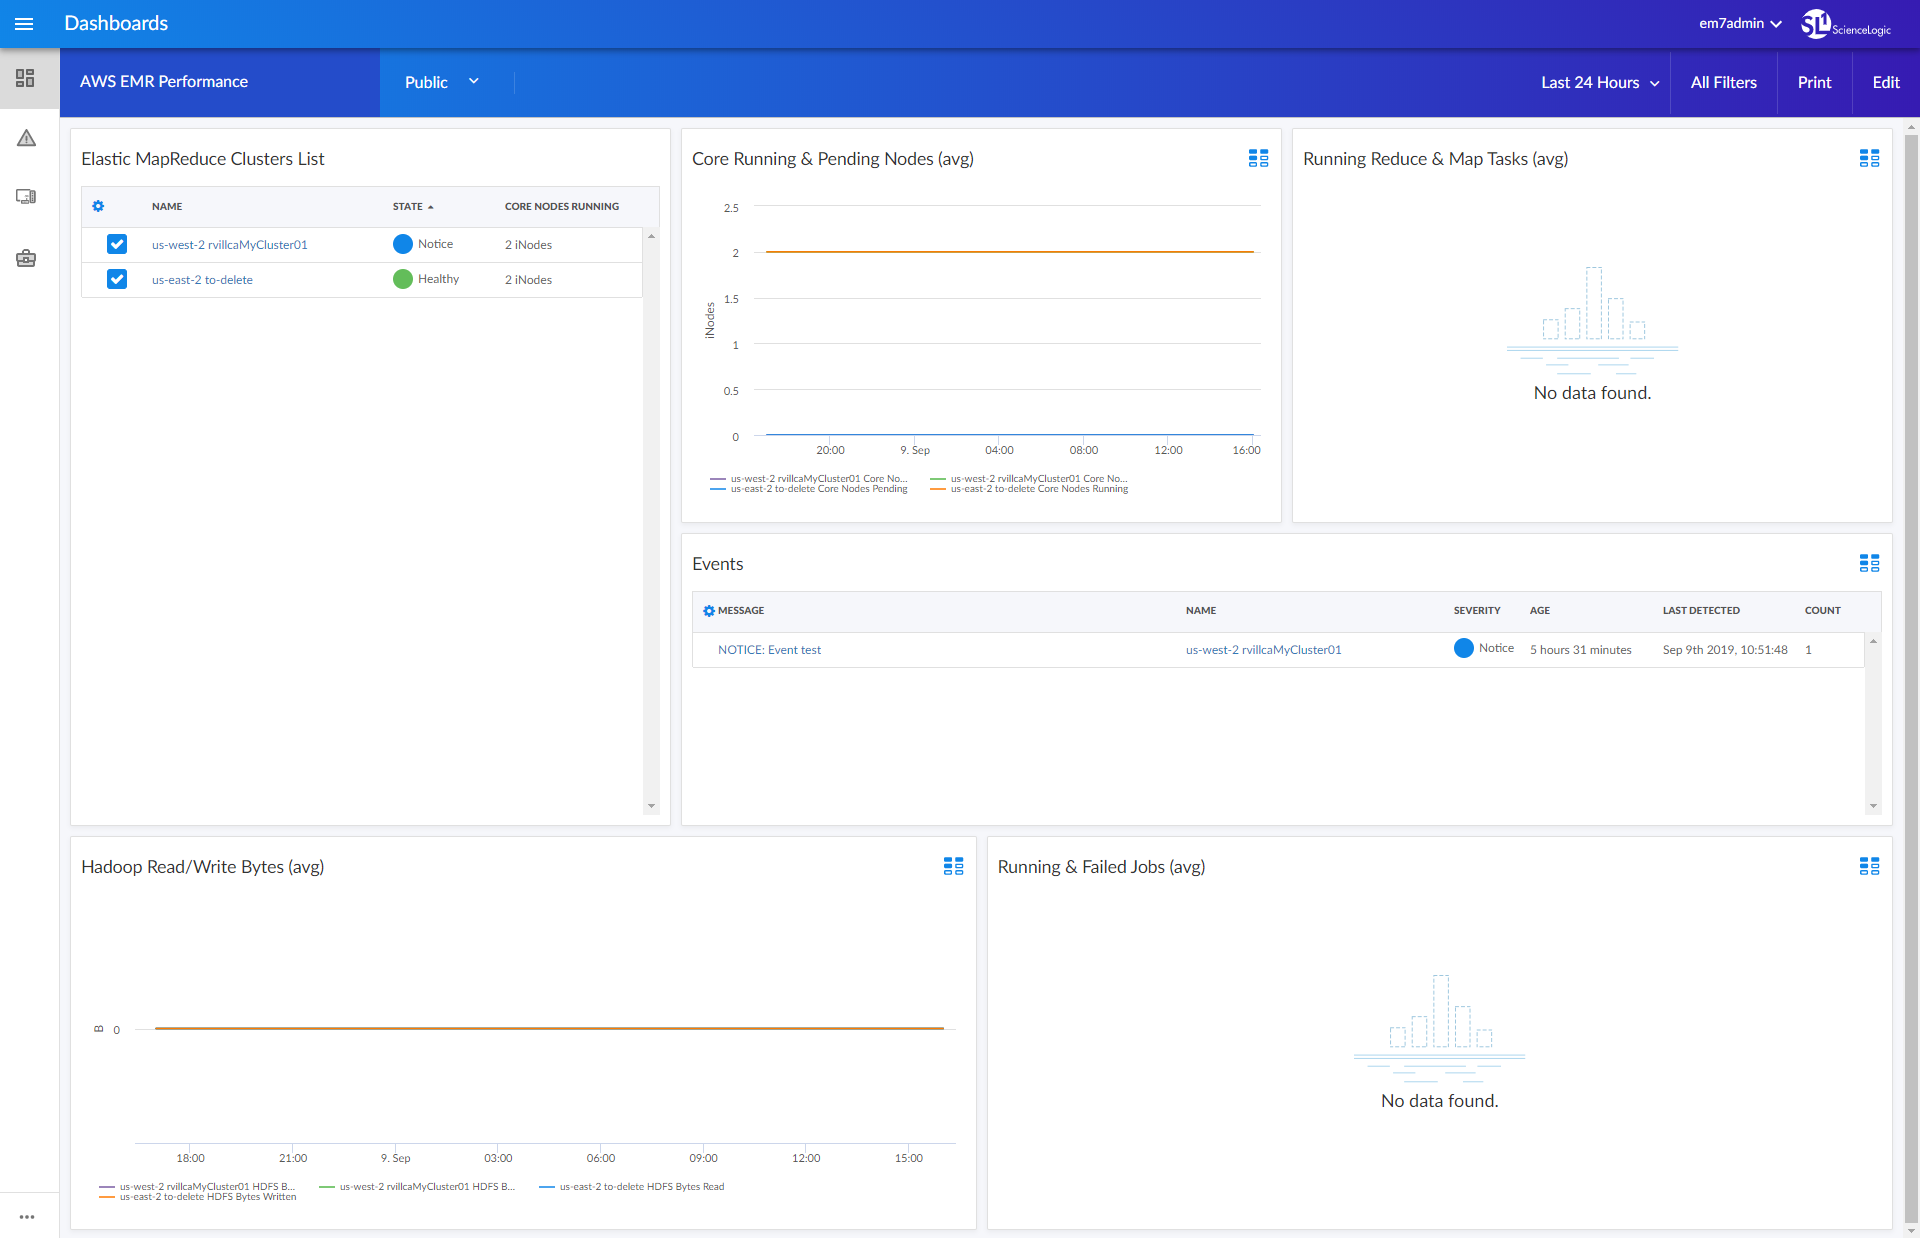
- An "AWS EMR Performance" dashboard, which includes the following widgets that display data about your AWS EMR instances:
- Elastic MapReduce Clusters List
- Core Running & Pending Nodes (avg)
- Running Reduce & Map Tasks (avg)
- Events
- Hadoop Read/Write Bytes (avg)
- Running & Failed Jobs (avg)
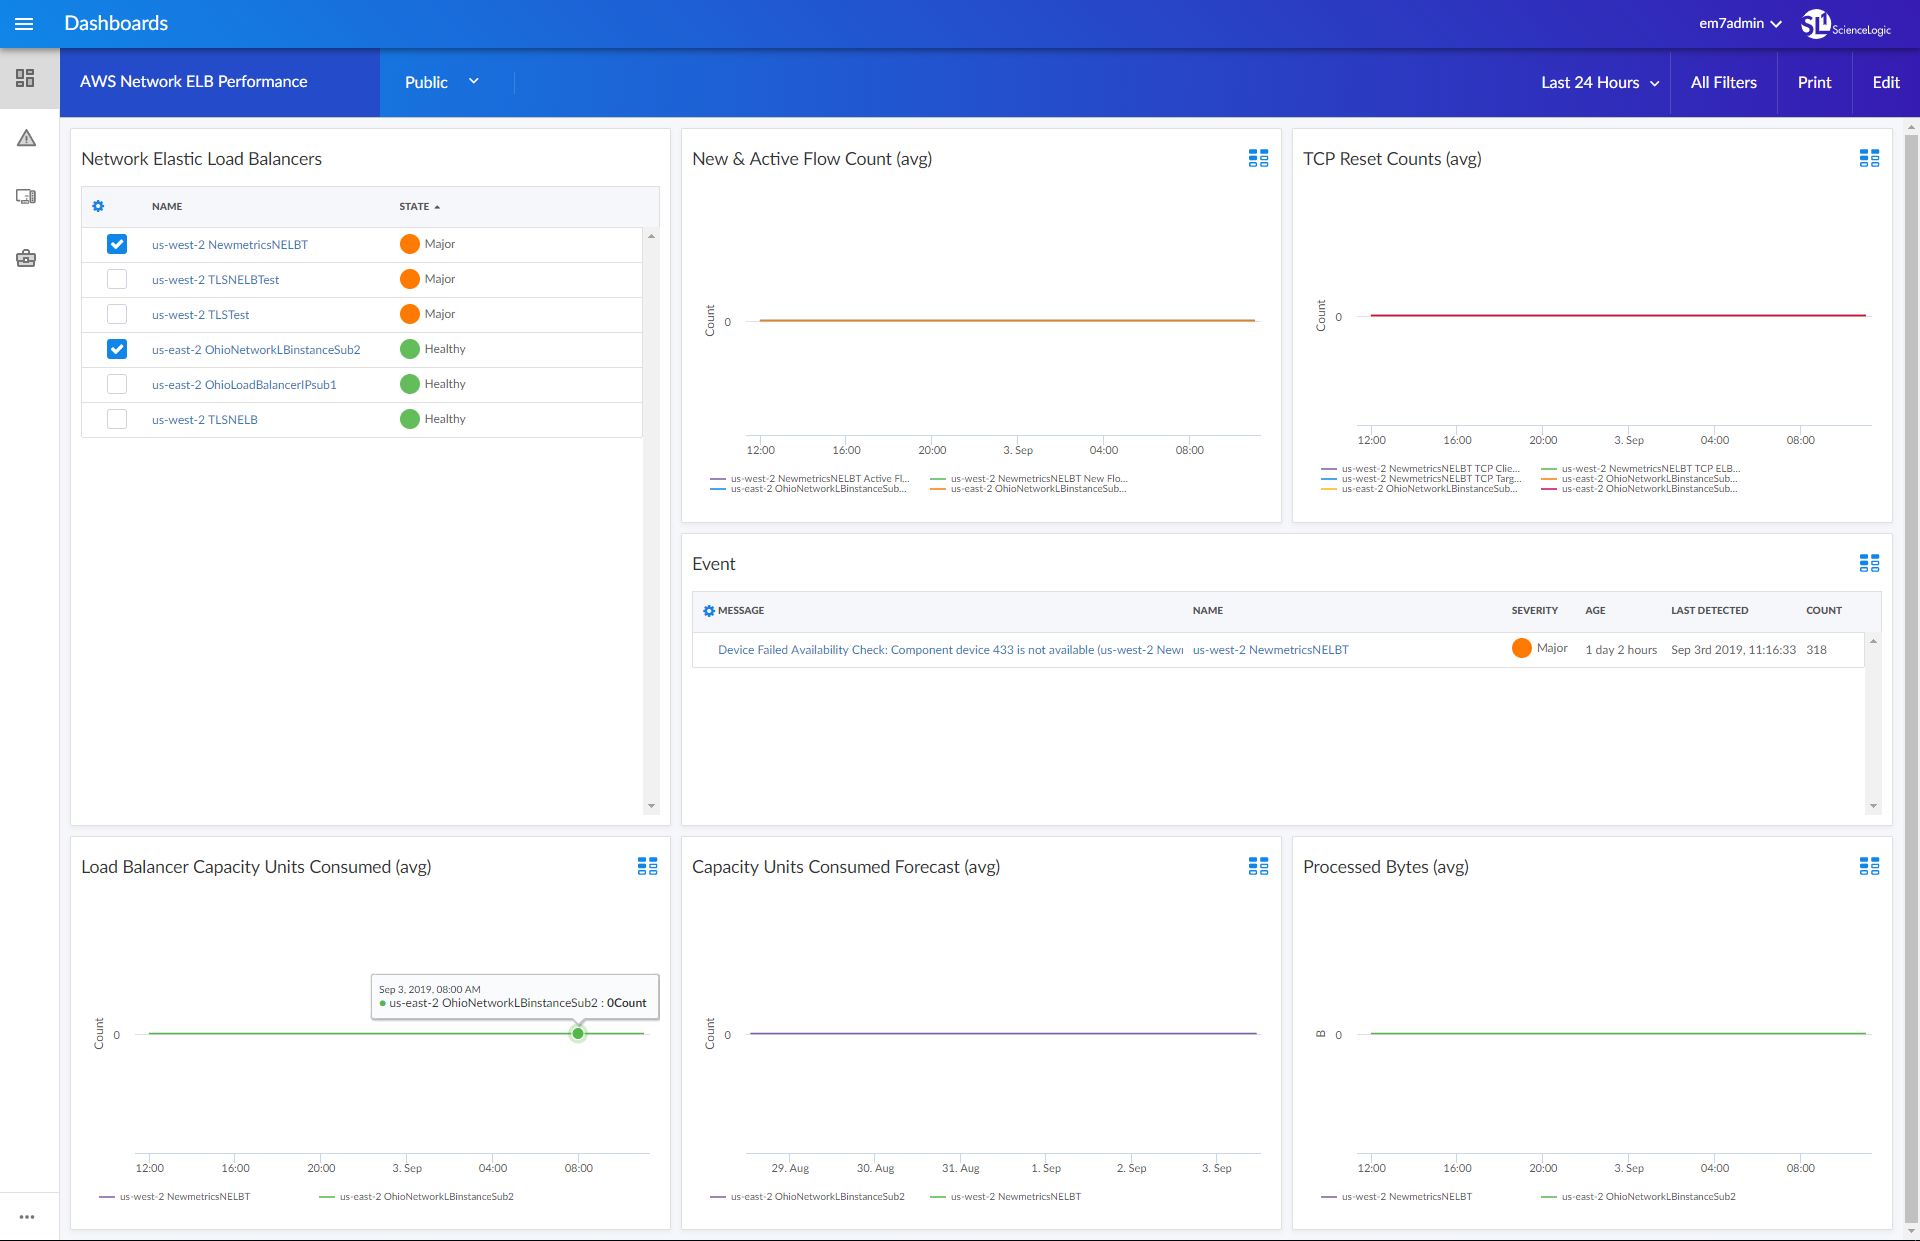
- An "AWS Network ELB Performance" dashboard, which includes the following widgets that display data about your AWS network ELB instances:
- Network Elastic Load Balancers
- New & Active Flow Count (avg)
- TCP Reset Count (avg)
- Events
- Load Balancer Capacity Units Consumed (avg)
- Capacity Units Consumed Forecast (avg)
- Processed Bytes (avg)
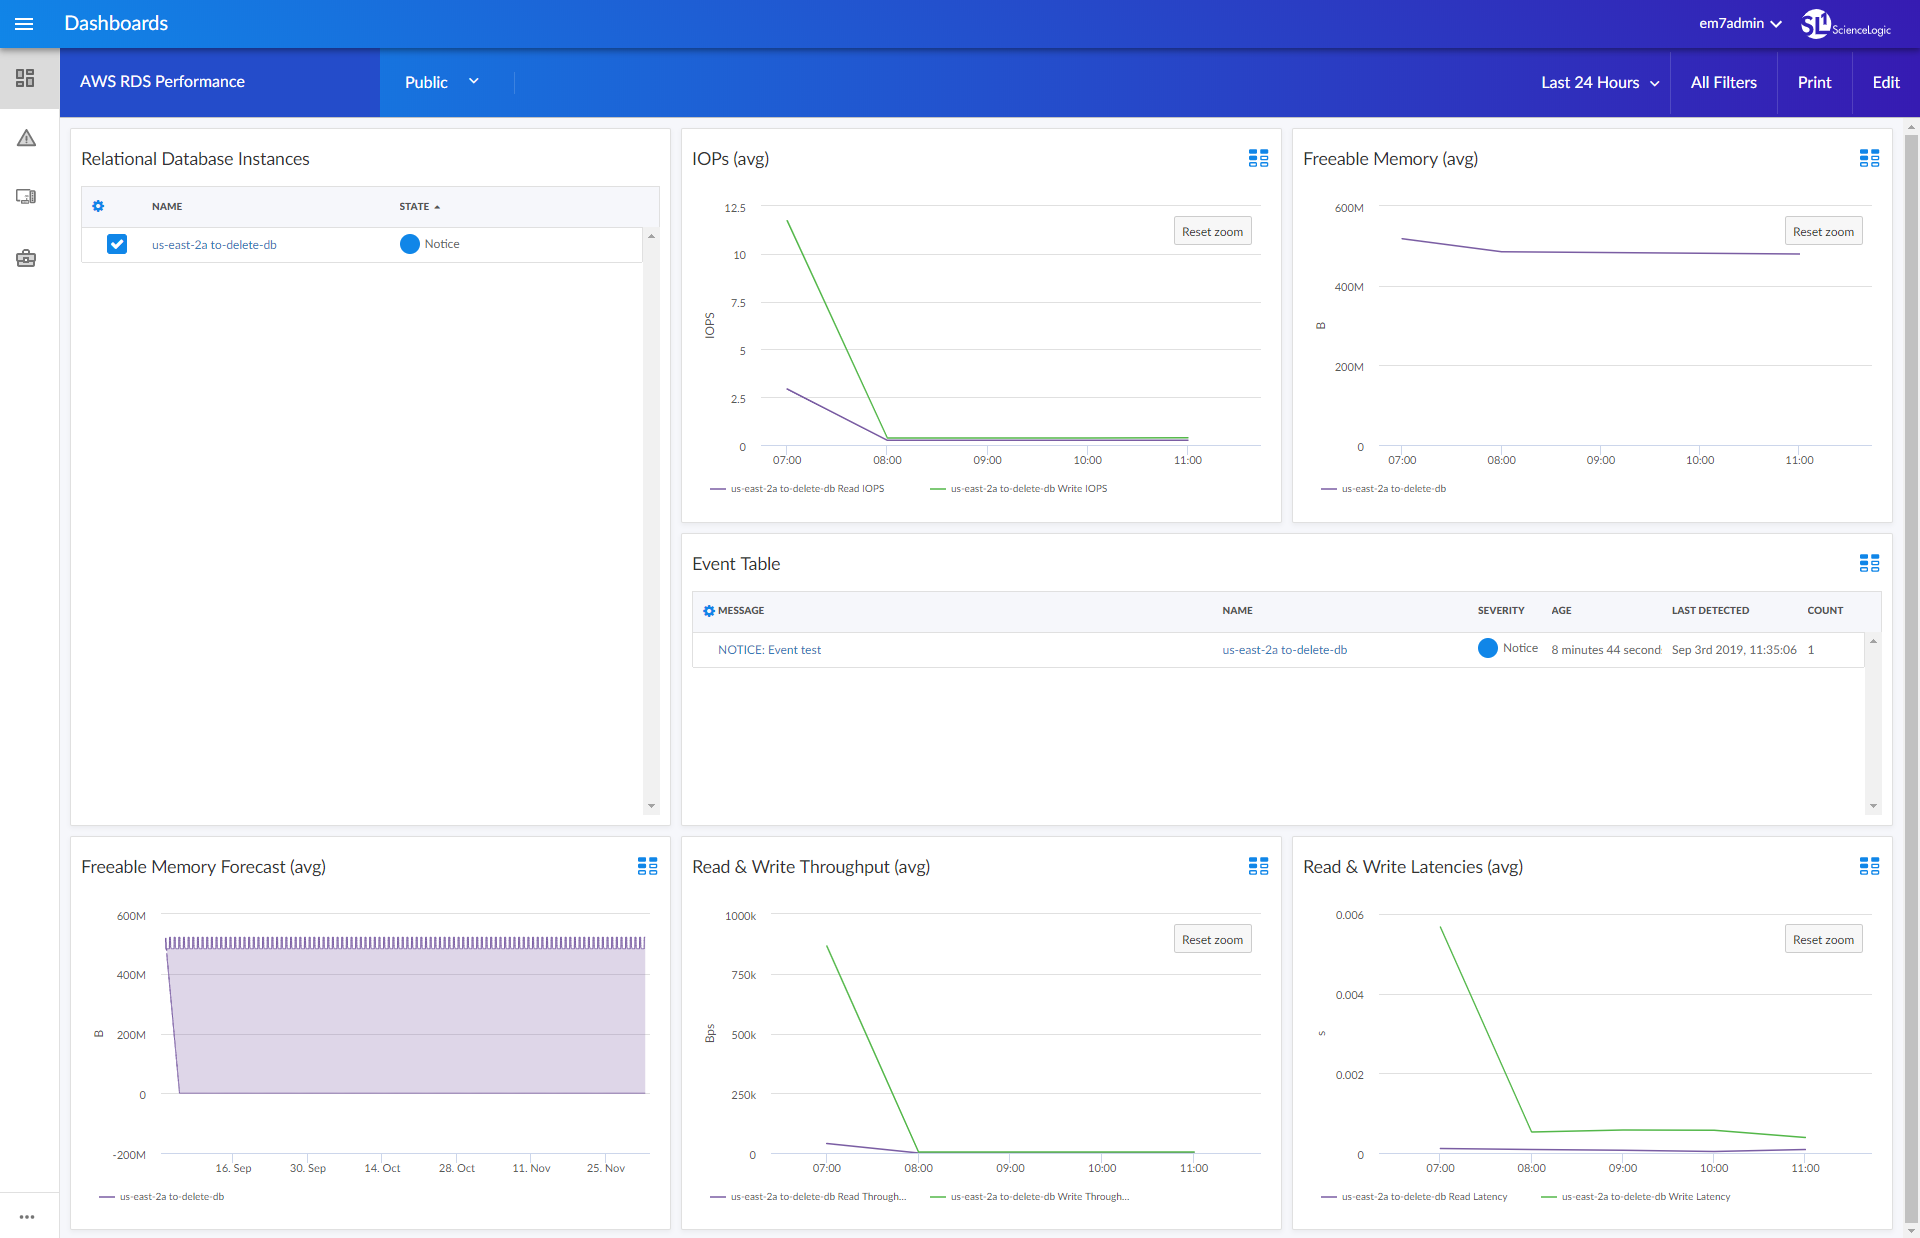
- An "AWS RDS Performance" dashboard, which includes the following widgets that display data about your AWS RDS instances:
- Relational Database Instances
- Input/Output per Second (avg)
- Freeable Memory (avg)
- Events
- Freeable Memory Forecast (avg)
- Read & Write Throughput (avg)
- Read & Write Latencies (avg)
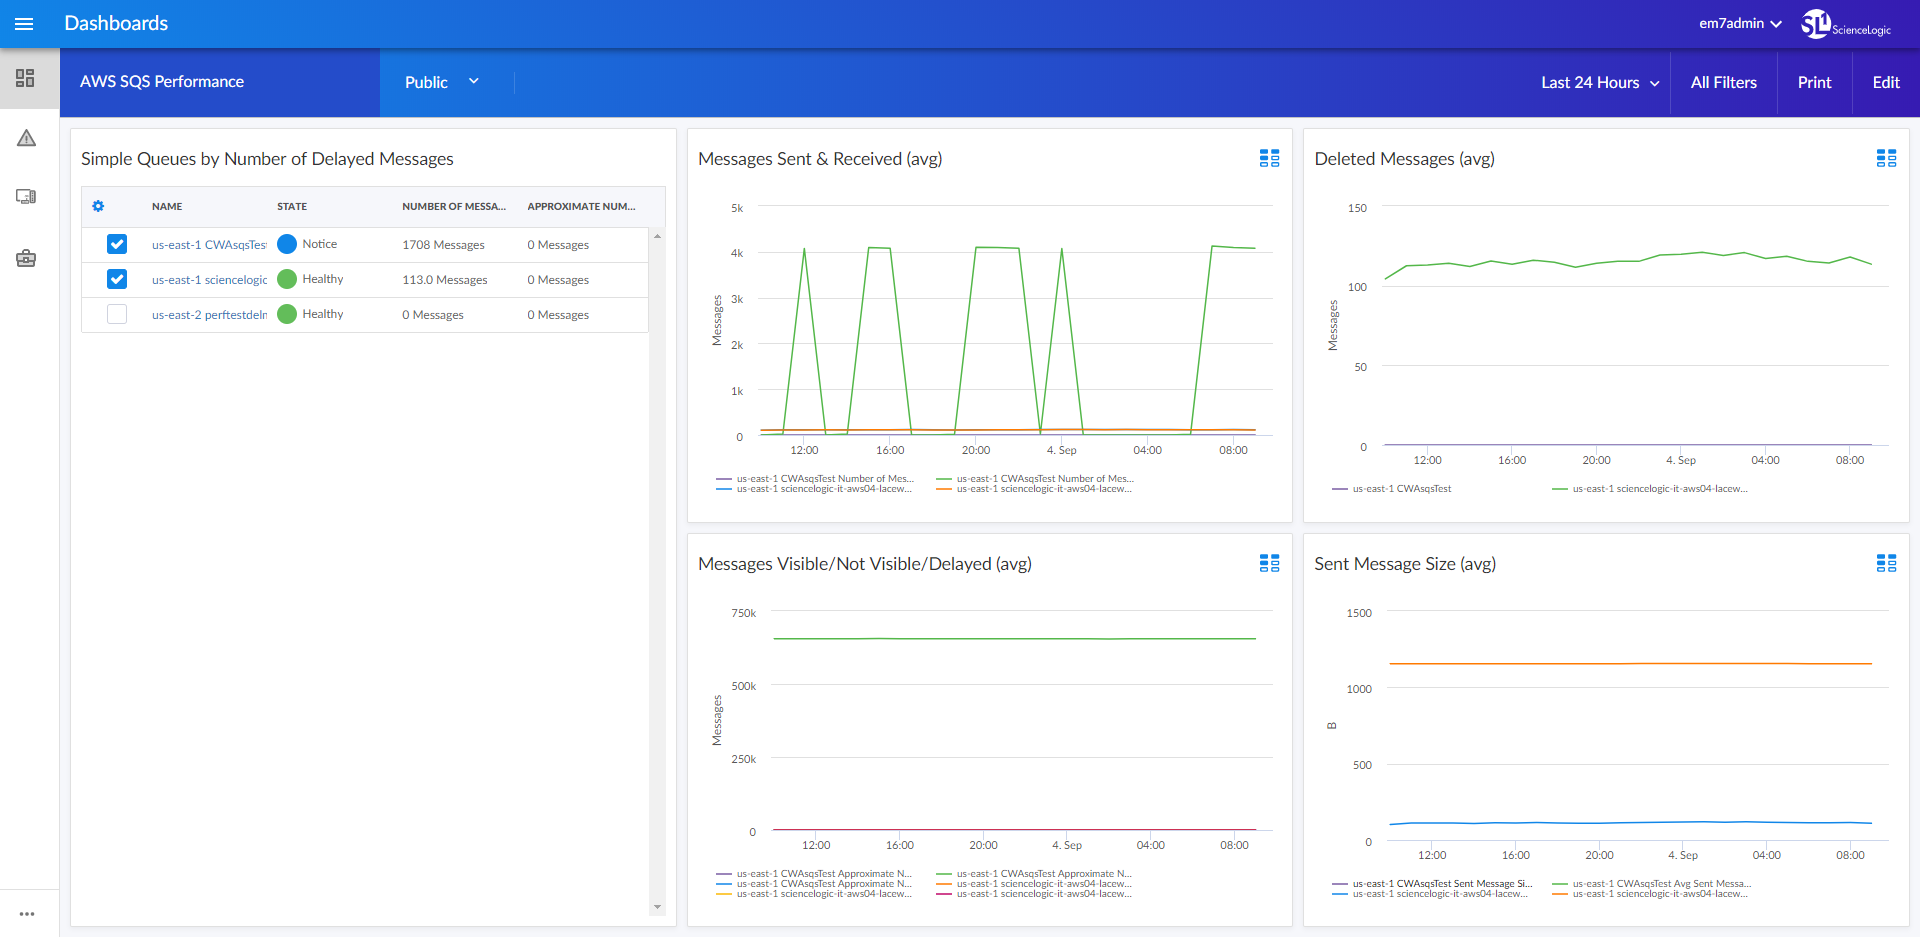
- An "AWS SQS Performance" dashboard, which includes the following widgets that display data about your AWS SQS instances:
- Messages Sent & Received
- Deleted Messages
- Messages Visible & Not Visible
- Sent Message Size
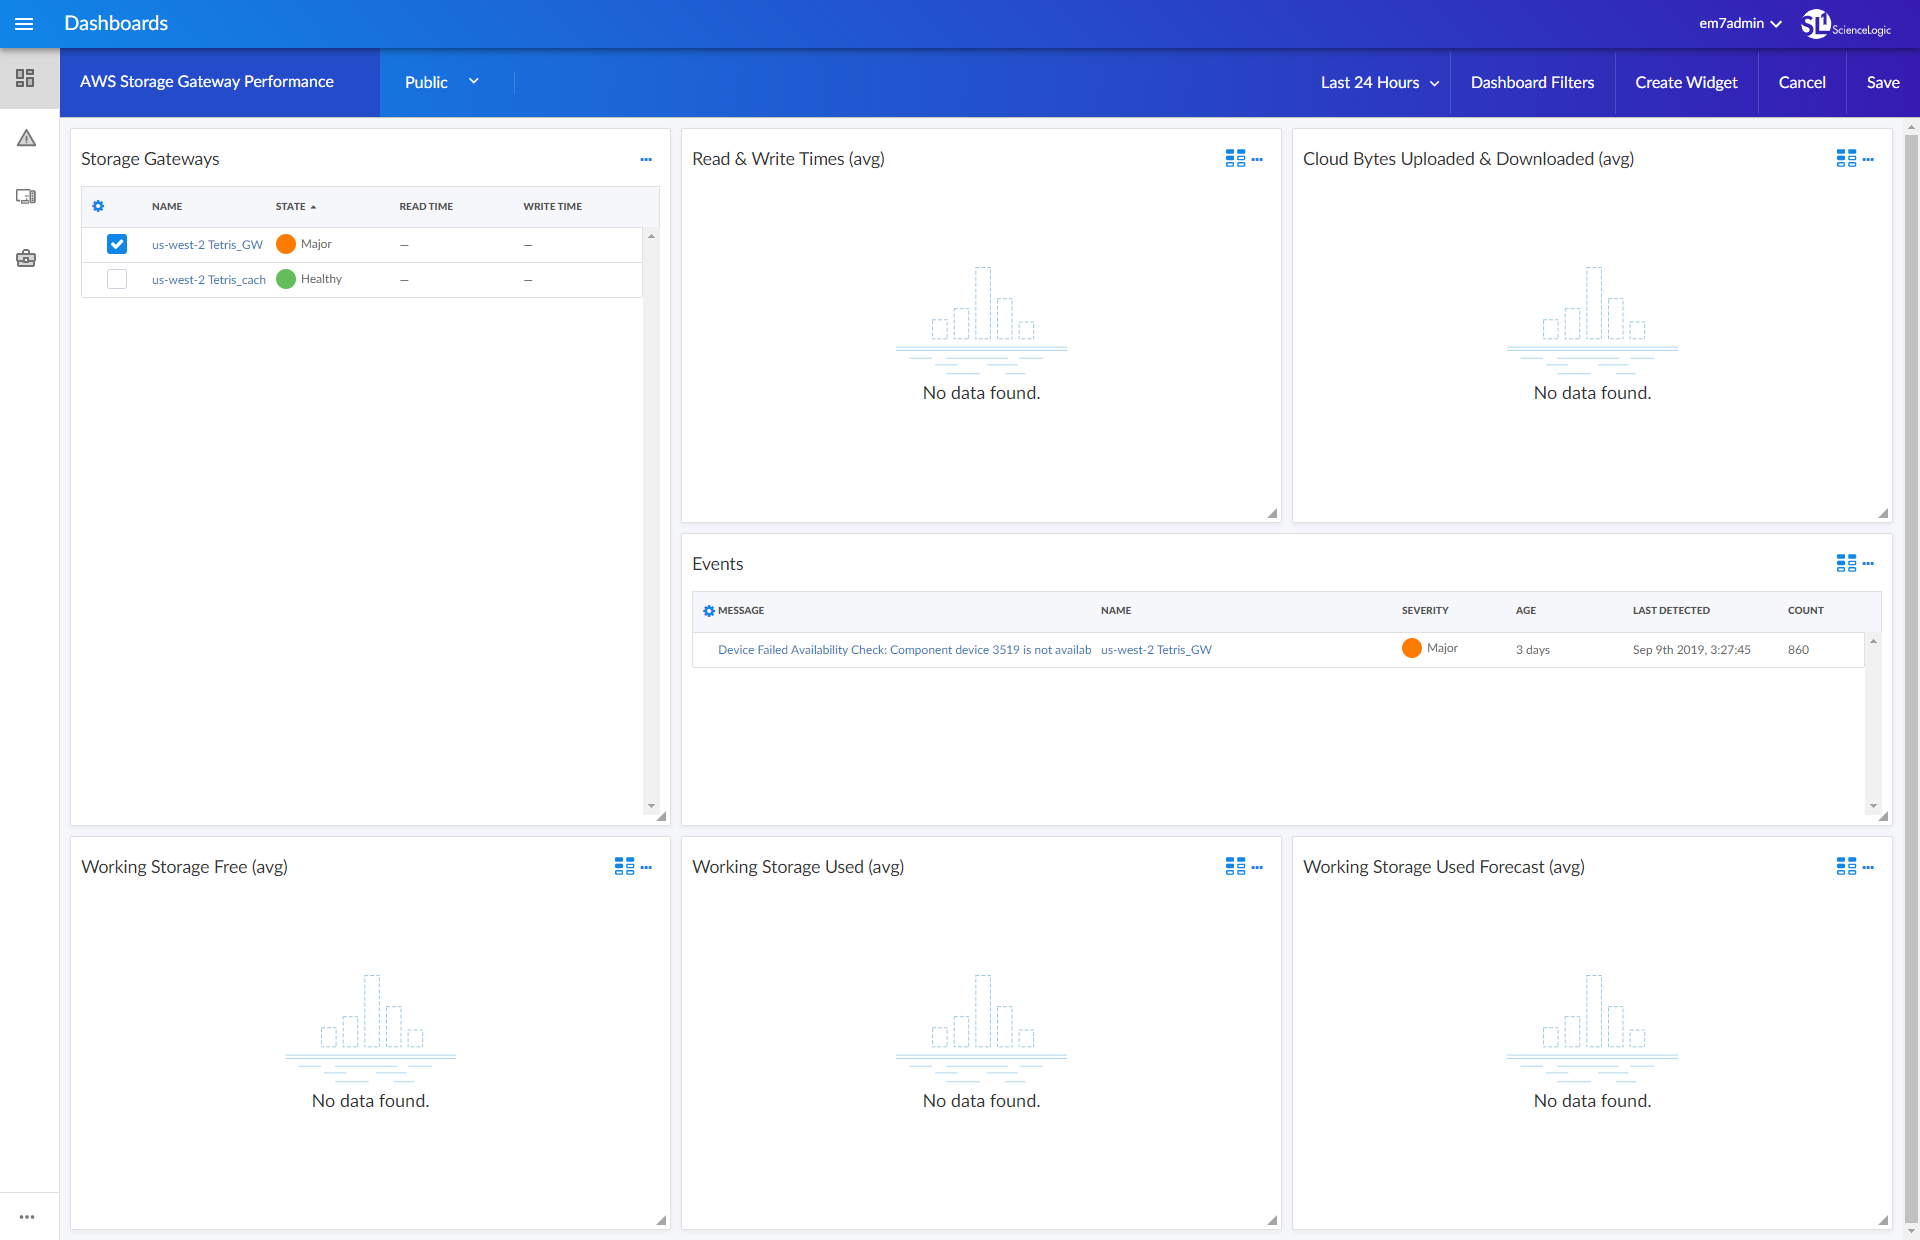
- An "AWS Storage Gateway Performance" dashboard, which includes the following widgets that display data about your AWS storage gateway devices:
- Storage Gateways
- Read & Write Times (avg)
- Cloud Bytes Uploaded & Downloaded (avg)
- Events
- Working Storage Used (avg)
- Working Storage Free (avg)
- Working Storage Used Forecast (avg)
Enhancements and Issues Addressed
The following enhancements and addressed issues are included in this release of the PowerPack:
- The Events, Latency Average Forecast, Latency Maximum Forecast, and Latency Minimum Forecast widgets were added to the "AWS EMR Performance" dashboard.
- The Event Table and Freeable Memory Forecast widgets were added to the "AWS RDS Performance" dashboard.
- The Events widget was added to the "AWS EMR Performance" dashboard.
- The Events, Consumed Read Capacity Forecast, and Consumed Write Capacity Forecast widgets were added to the "AWS DDB Performance" dashboard.
- The Events and Working Storage Used Forecast widgets were added to the "AWS Storage Gateway Performance" dashboard.
- The Events and Capacity Units Consumed Forecast widgets were added to the "AWS Network ELB Performance" dashboard.
- The Events widget was added to the "AWS Application ELB Performance" dashboard.
- The Events, Total Read Time Forecast, Total Write Time Forecast, and Queue Length Forecast widgets were added to the "AWS EBS Performance" dashboard.
- The Events, CPU Forecast, Disk Read Bytes Forecast, and Disk Write Bytes Forecast widgets were added to the "AWS EC2 Performance" dashboard.
- The Total ($) Forecast widget was added to the "AWS Account Billing" dashboard.
Known Issues
Version 102 of the Amazon Web Services: SL1 Dashboards PowerPack has no known issues.