![]()
Version 102 of the Aruba: SL1 Dashboards PowerPack includes autoselect for context-driving widgets and the addition of forecast widgets to some dashboards.
NOTE: These dashboards are intended for use only in the new SL1 user interface and will not load in the classic ScienceLogic platform user interface.
- Minimum Required SL1 Version: 8.12.1
- Minimum Required AP2 Version: 5.125.44
- Minimum Required Widget Components Version: 2.175.0
- Minimum Required Aruba CentralPowerPack Version: 100
Before You Install or Upgrade
Before installing Aruba: SL1 Dashboards PowerPack version 102, you must first ensure that you are running version 8.12.1 or later of SL1.
NOTE: For details on upgrading SL1, see the appropriate Release Notes.
You must also import and install the Aruba Central PowerPack version 100 or later before installing the PowerPack.
Installation or Upgrade Process
To install this PowerPack:
- Familiarize yourself with the Known Issues for this release.
- See the Before You Install or Upgrade section. If you have not done so already, upgrade your system to the 8.12.1 or later release.
- Download the "Aruba: SL1 Dashboards" version 102PowerPack from the Support Site to a local computer.
- Go to the PowerPack Manager page (System > Manage > PowerPacks). Click the menu and choose Import PowerPack. When prompted, import "Aruba: SL1 Dashboards" version 102.
- Click the button. For details on installing PowerPacks, see the chapter on Installing a PowerPack in the PowerPacks manual.
Features
The following dashboards are included in version 102 of the Aruba: SL1 Dashboards PowerPack:
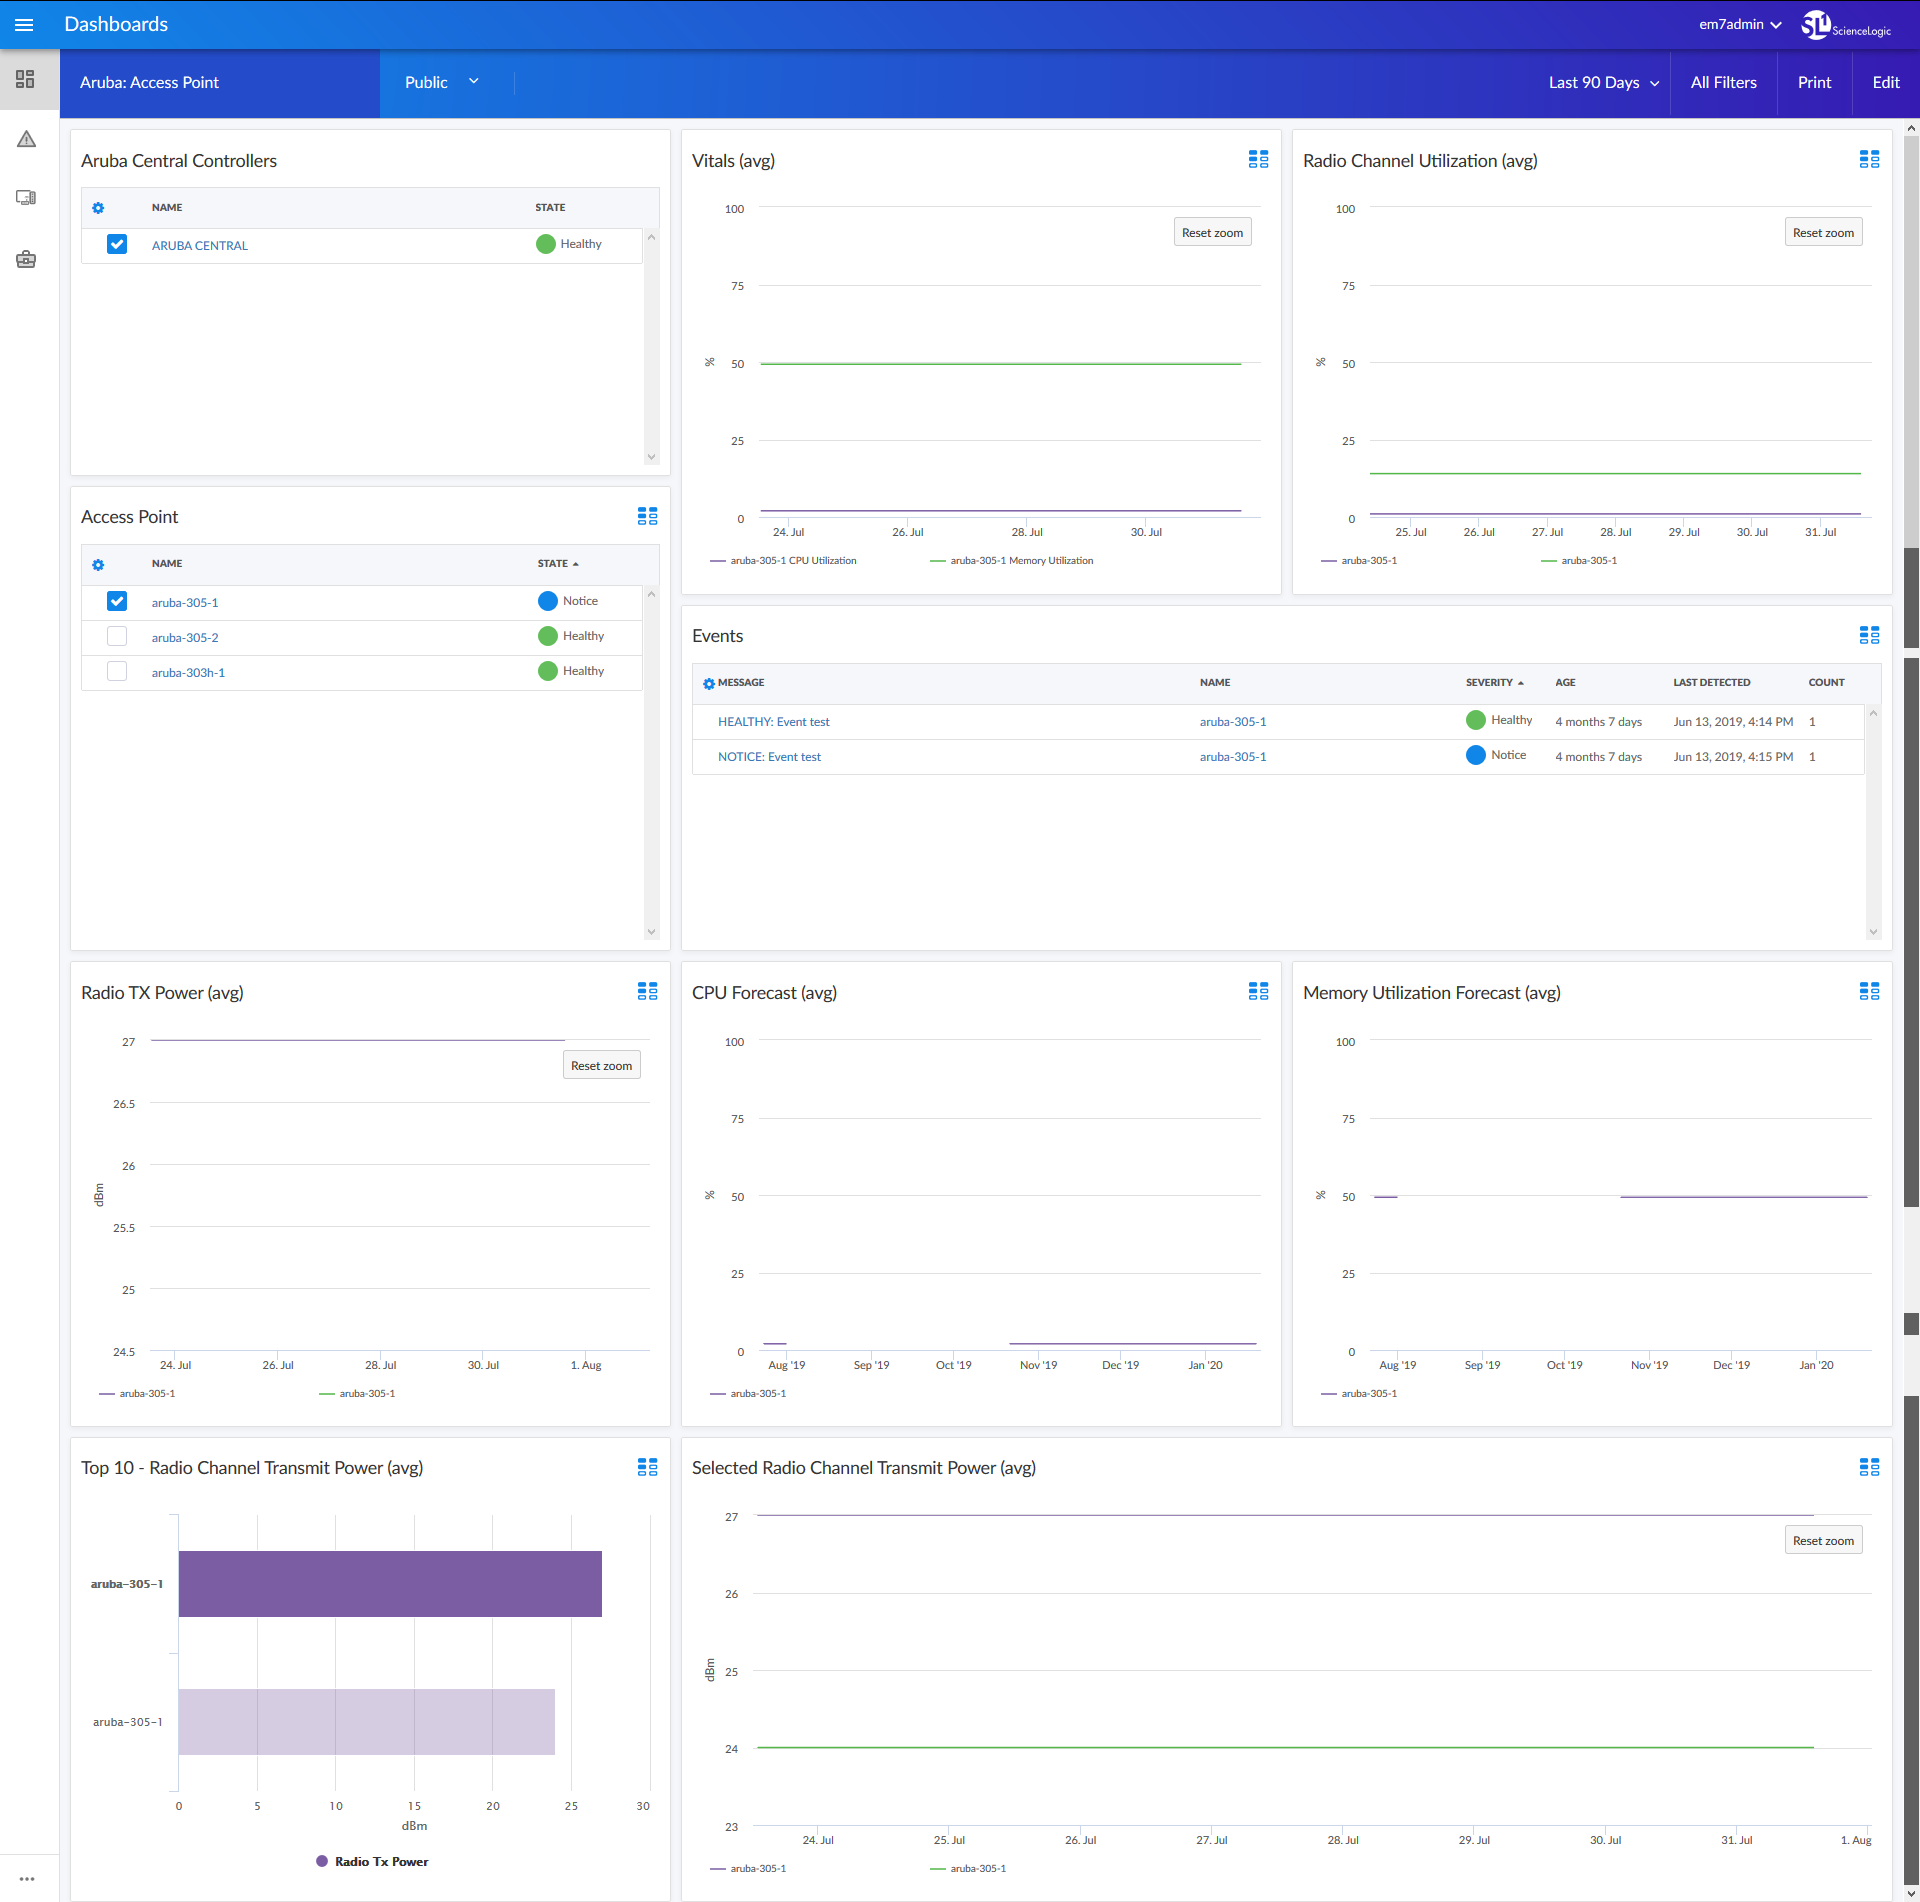
- The "Aruba: Access Point" dashboard, which includes the following widgets that display overview data about your Aruba Access Points:
- Aruba Central Controllers
- Access Point
- Vitals (avg)
- Radio Channel Utilization (avg)
- Events
- Radio TX Power (avg)
- CPU Forecast (avg)
- Memory Utilization Forecast (avg)
- Top 10 - Radio Channel Transmit Power (avg)
- Selected Radio Channel Transmit Power (avg)
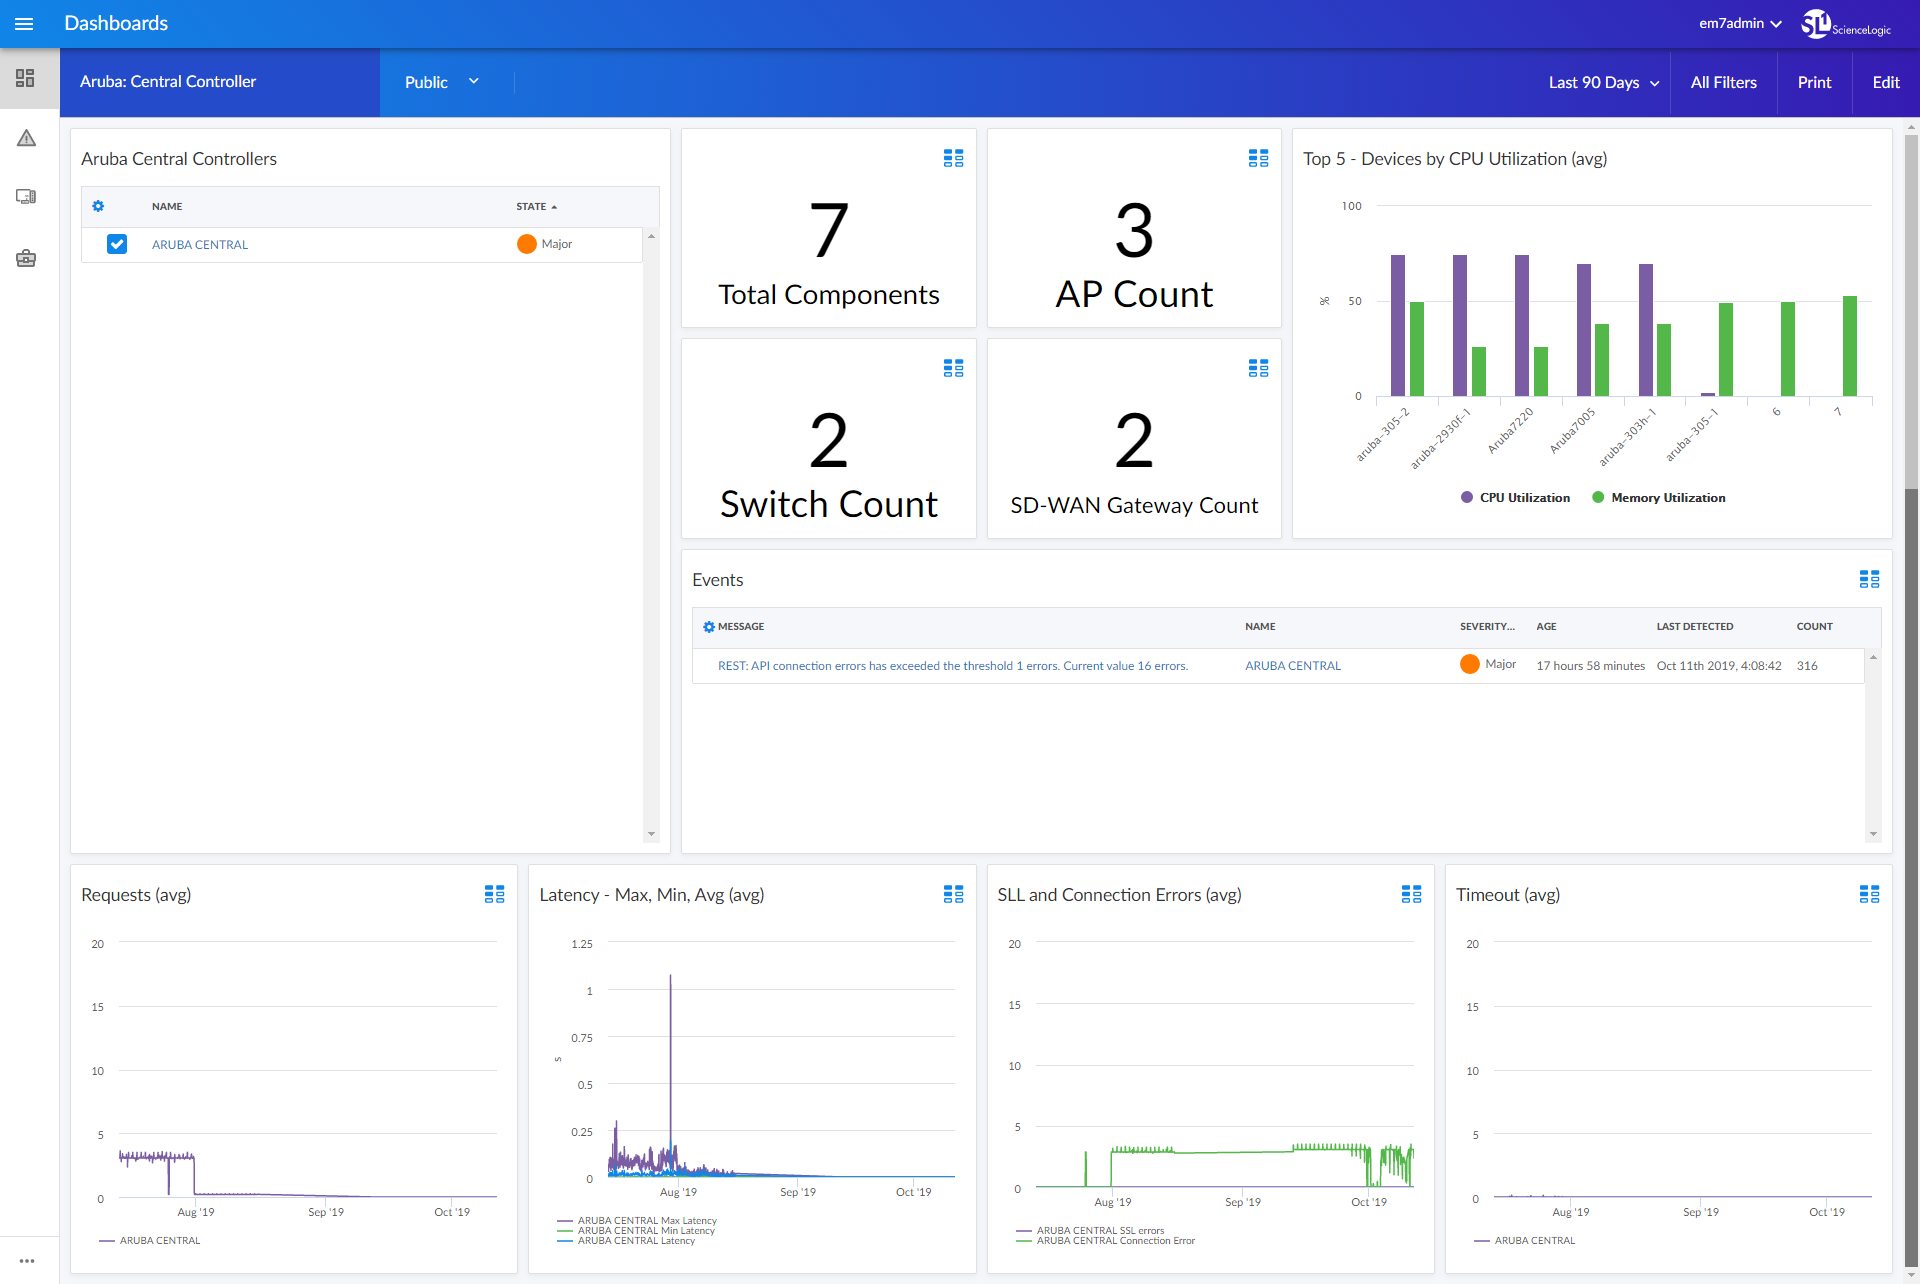
- The "Aruba: Central Controller" dashboard, which includes the following widgets that display overview data about your Aruba Central Controllers:
- Aruba Central Controllers
- Total Components
- AP Count
- Switch Count
- SD-WAN Gateway Count
- Top 5 - Devices by CPU Utilization (avg)
- Events
- Requests (avg)
- Latency - Max, Min, Avg (avg)
- SLL and Connection Errors (avg)
- Timeout (avg)
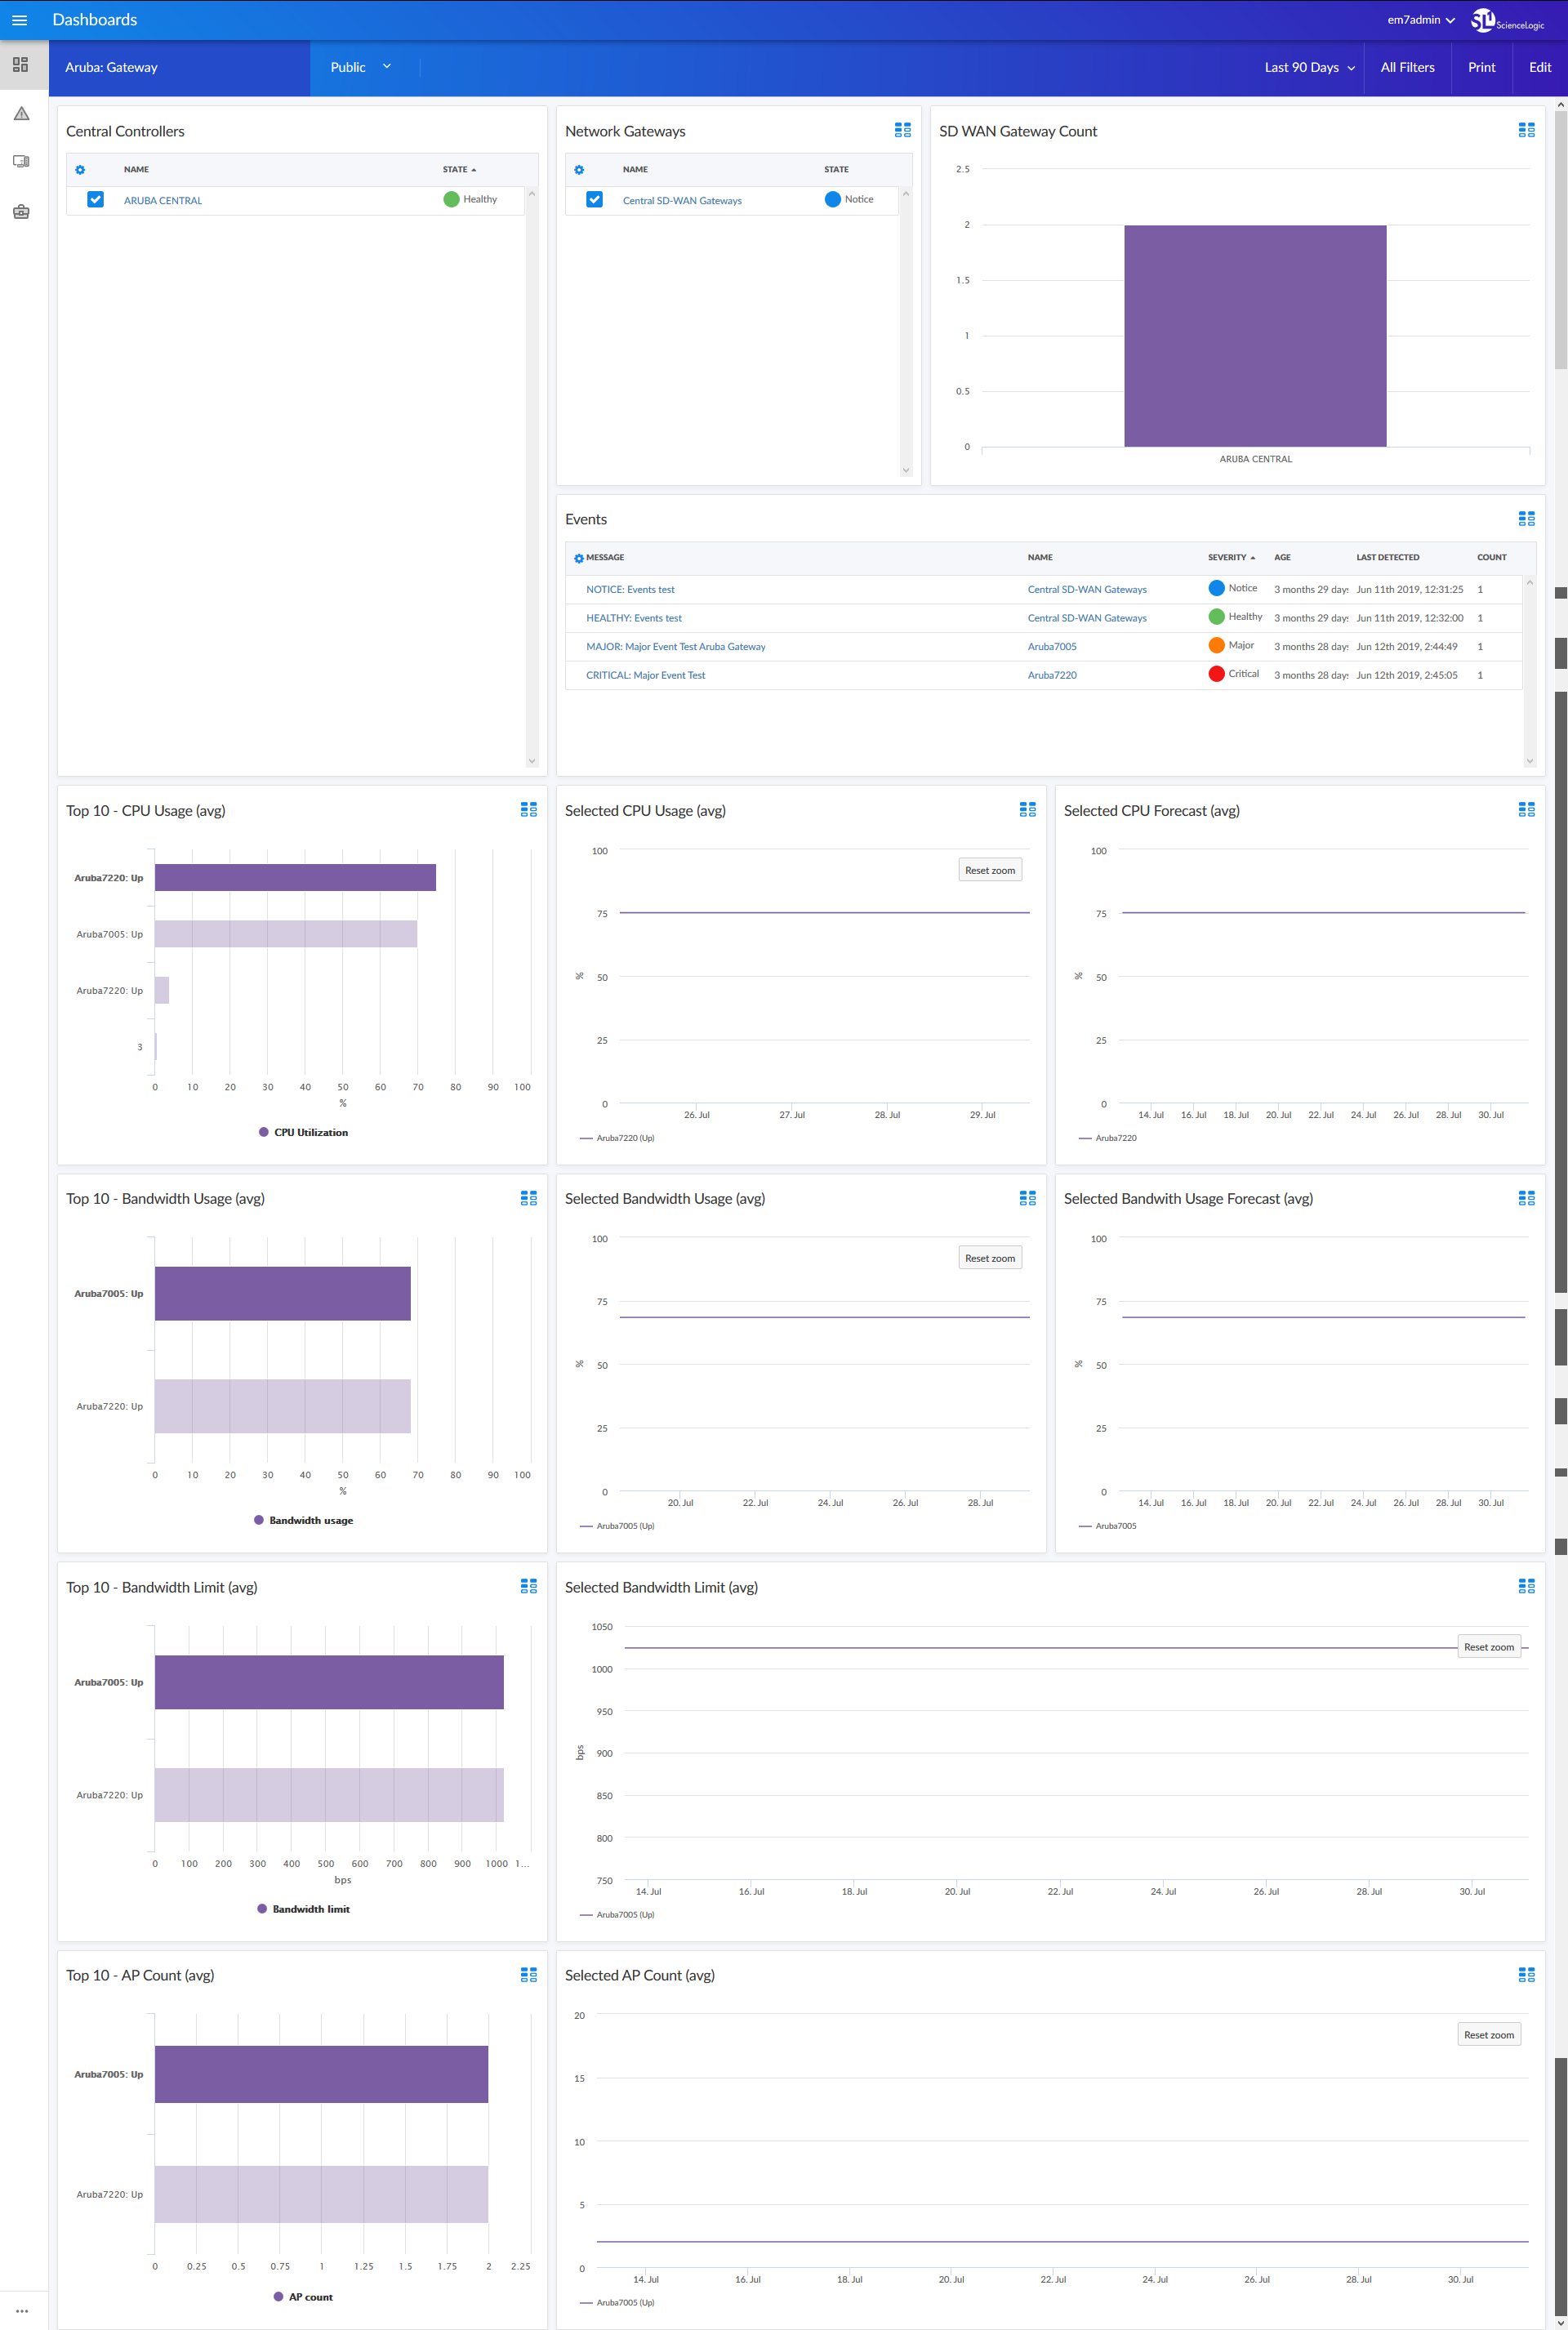
- The "Aruba: Gateway" dashboard, which includes the following widgets that display overview data about your Aruba Gateways:
- Central Controllers
- Network Gateways
- SD WAN Gateway Count
- Events
- Top 10 - CPU Usage (avg)
- Selected CPU Usage (avg)
- Selected CPU Forecast (avg)
- Top 10 - Bandwidth Usage (avg)
- Selected Bandwidth Usage (avg)
- Selected Bandwidth Usage Forecast (avg)
- Top 10 - Bandwidth Limit (avg)
- Selected Bandwidth Limit (avg)
- Top 10 - AP Count (avg)
- Selected AP Count (avg)
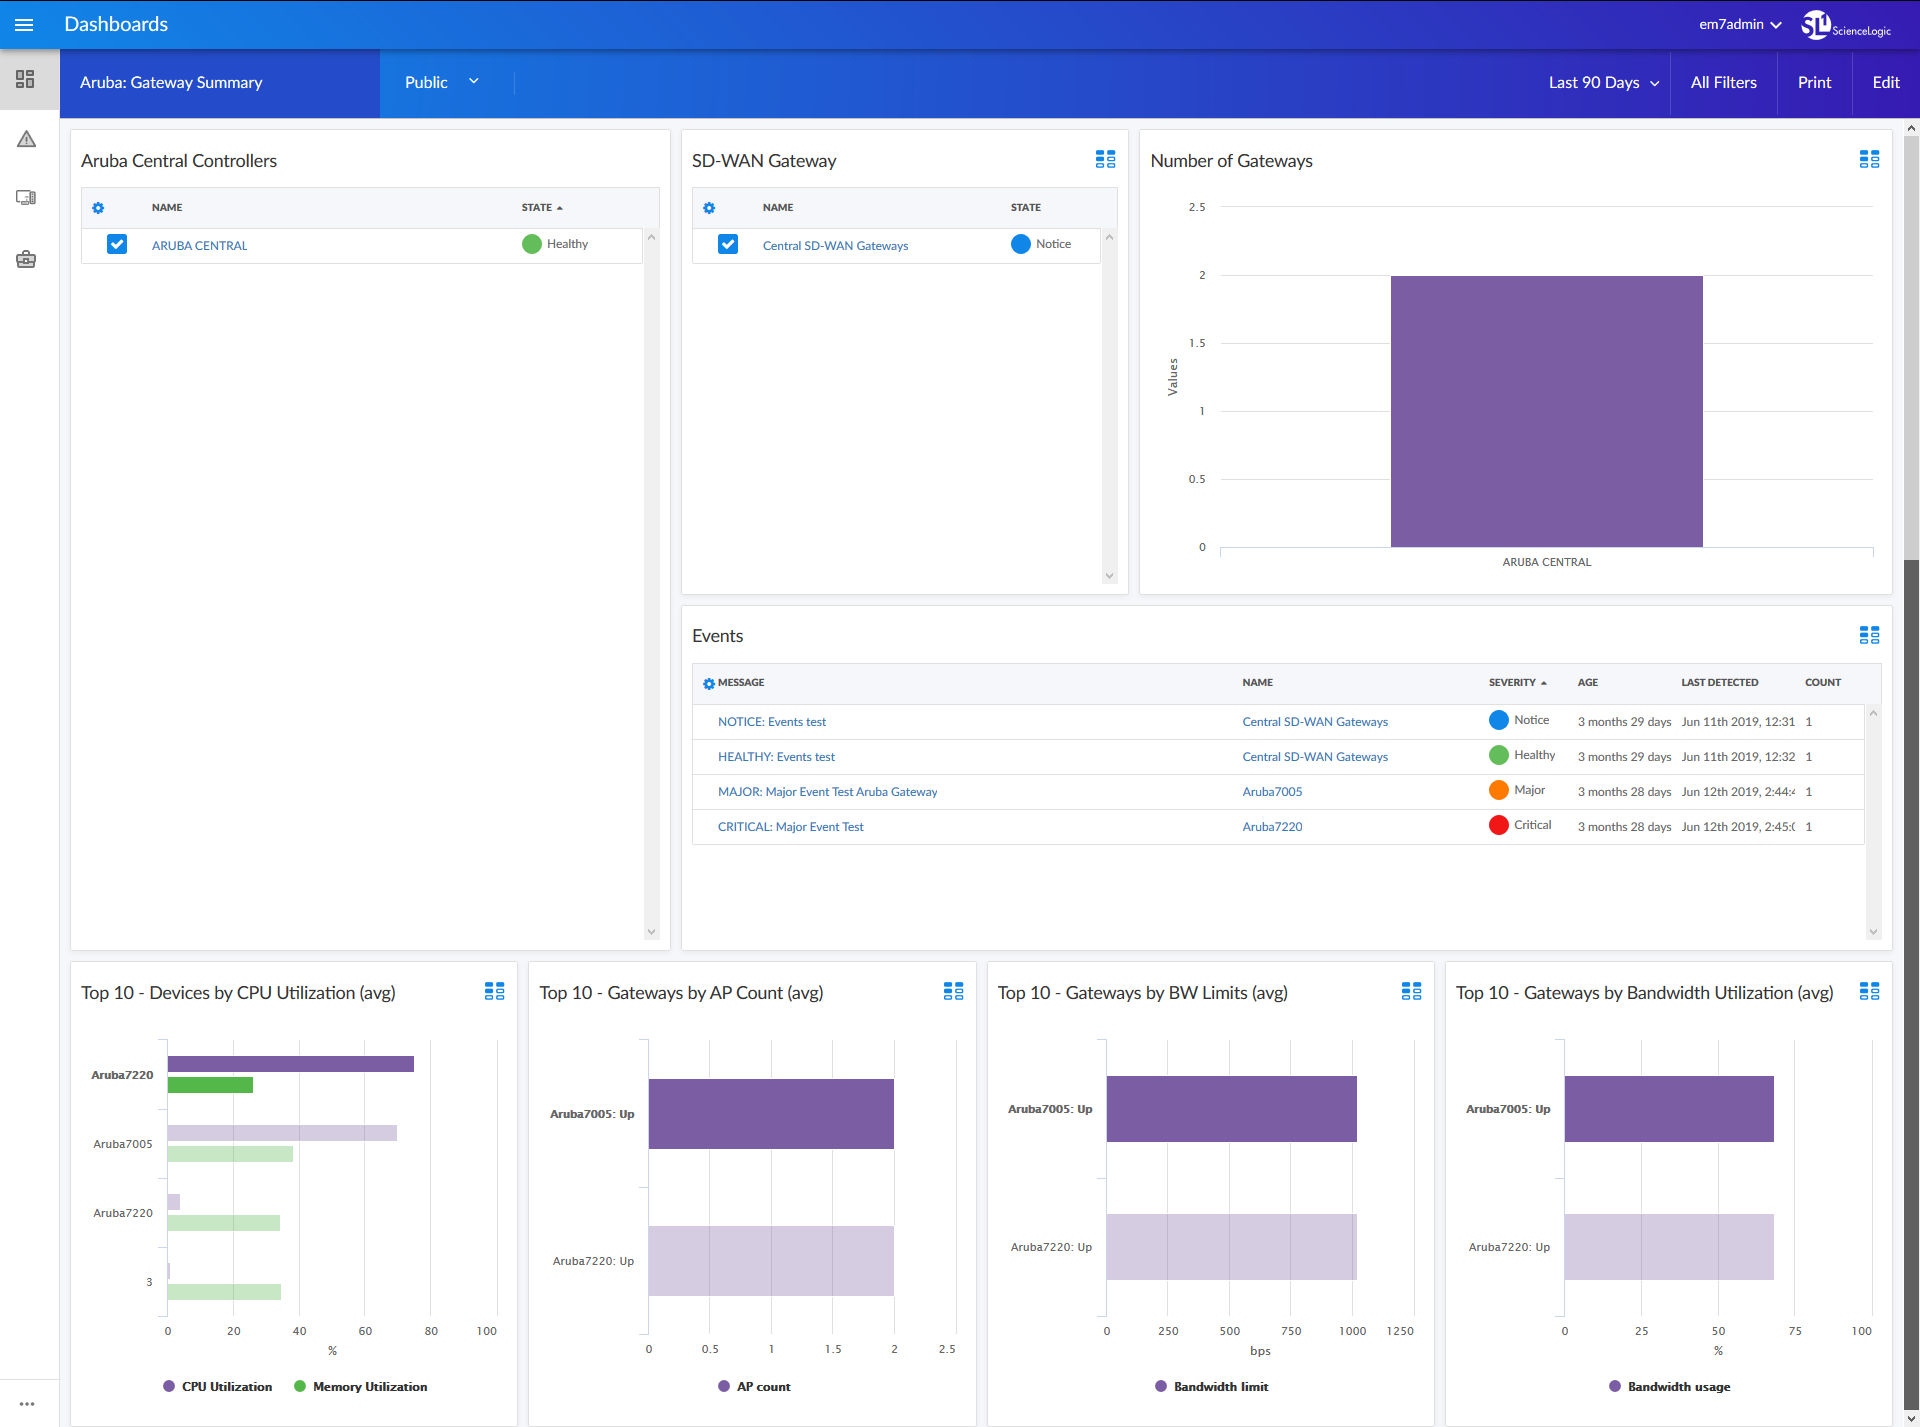
- The "Aruba: Gateway Summary" dashboard, which includes the following widgets that display overview data about your Aruba Gateways:
- Aruba Central Controllers
- SD-WAN Gateway
- Number of Gateways
- Events
- Top 10 - Devices by CPU Utilization (avg)
- Top 10 - Gateways by AP Count (avg)
- Top 10 - Gateways by BW Limits (avg)
- Top 10 - Gateways by Bandwidth Utilization (avg)
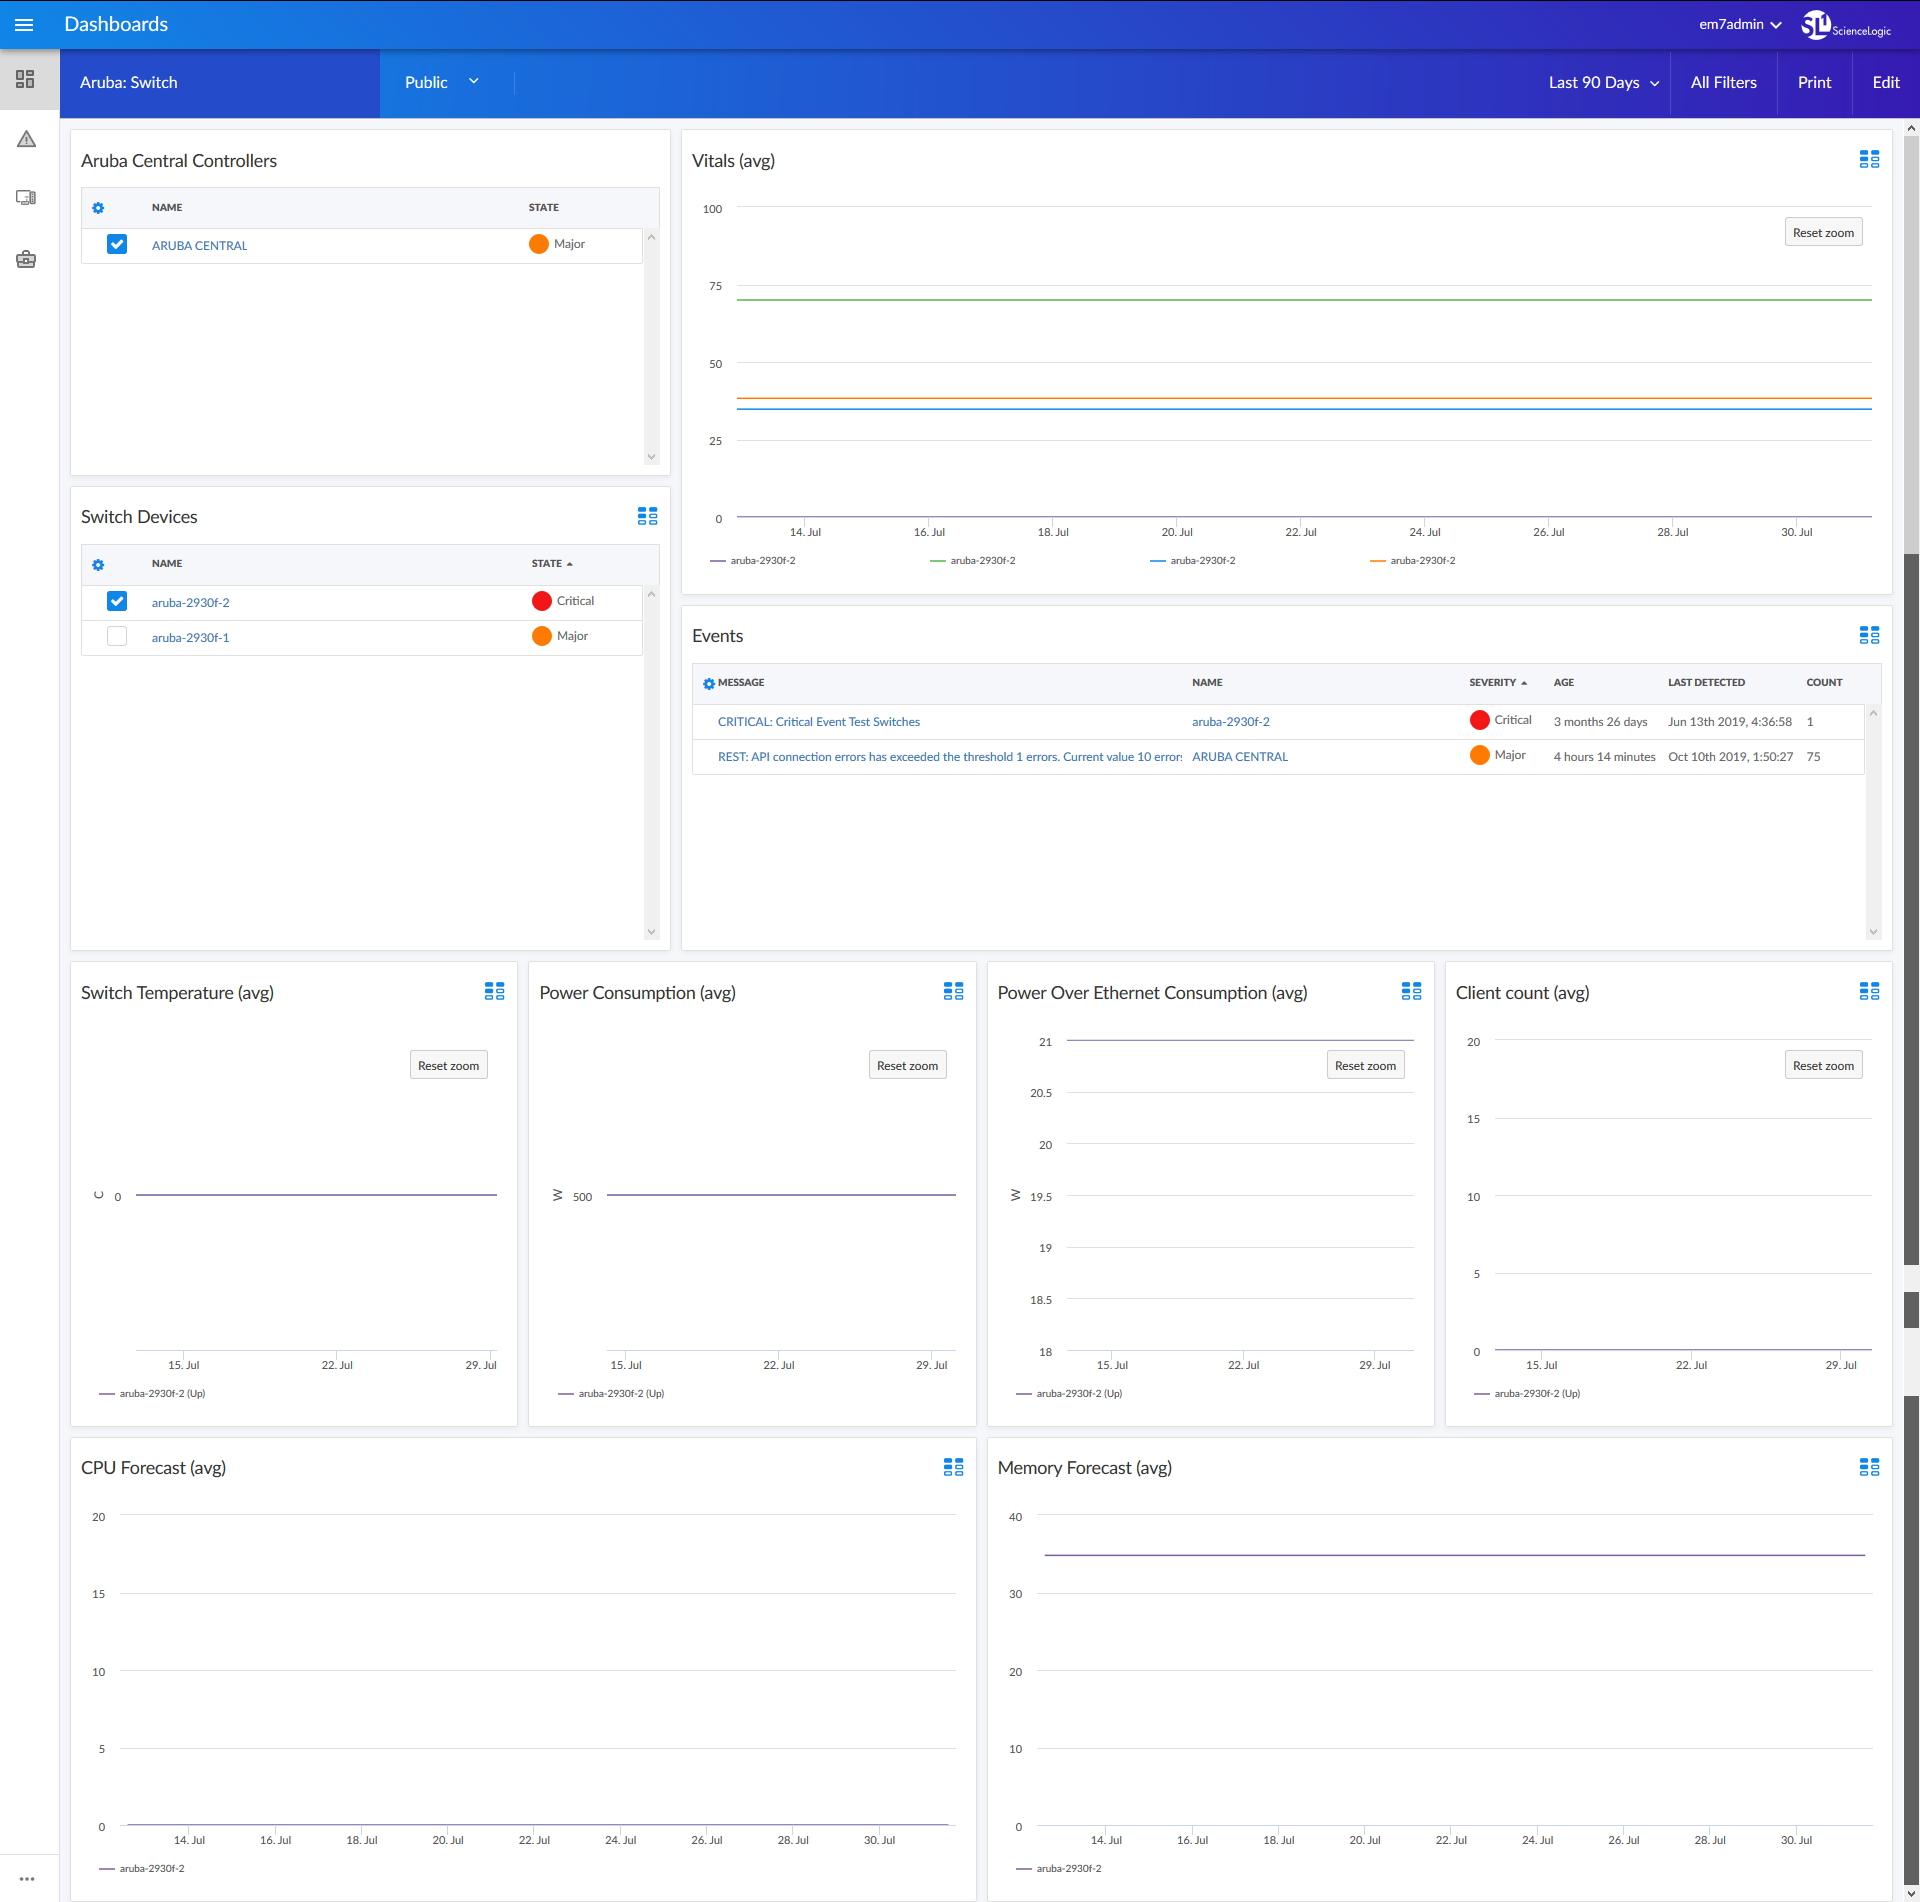
- The "Aruba: Switch" dashboard, which includes the following widgets that display overview data about your Aruba Switches:
- Aruba Central Controllers
- Switch Devices
- Vitals (avg)
- Events
- Switch Temperature (avg)
- Power Consumption (avg)
- Power Over Ethernet Consumption (avg)
- Client Count (avg)
- CPU Forecast (avg)
- Memory Forecast (avg)
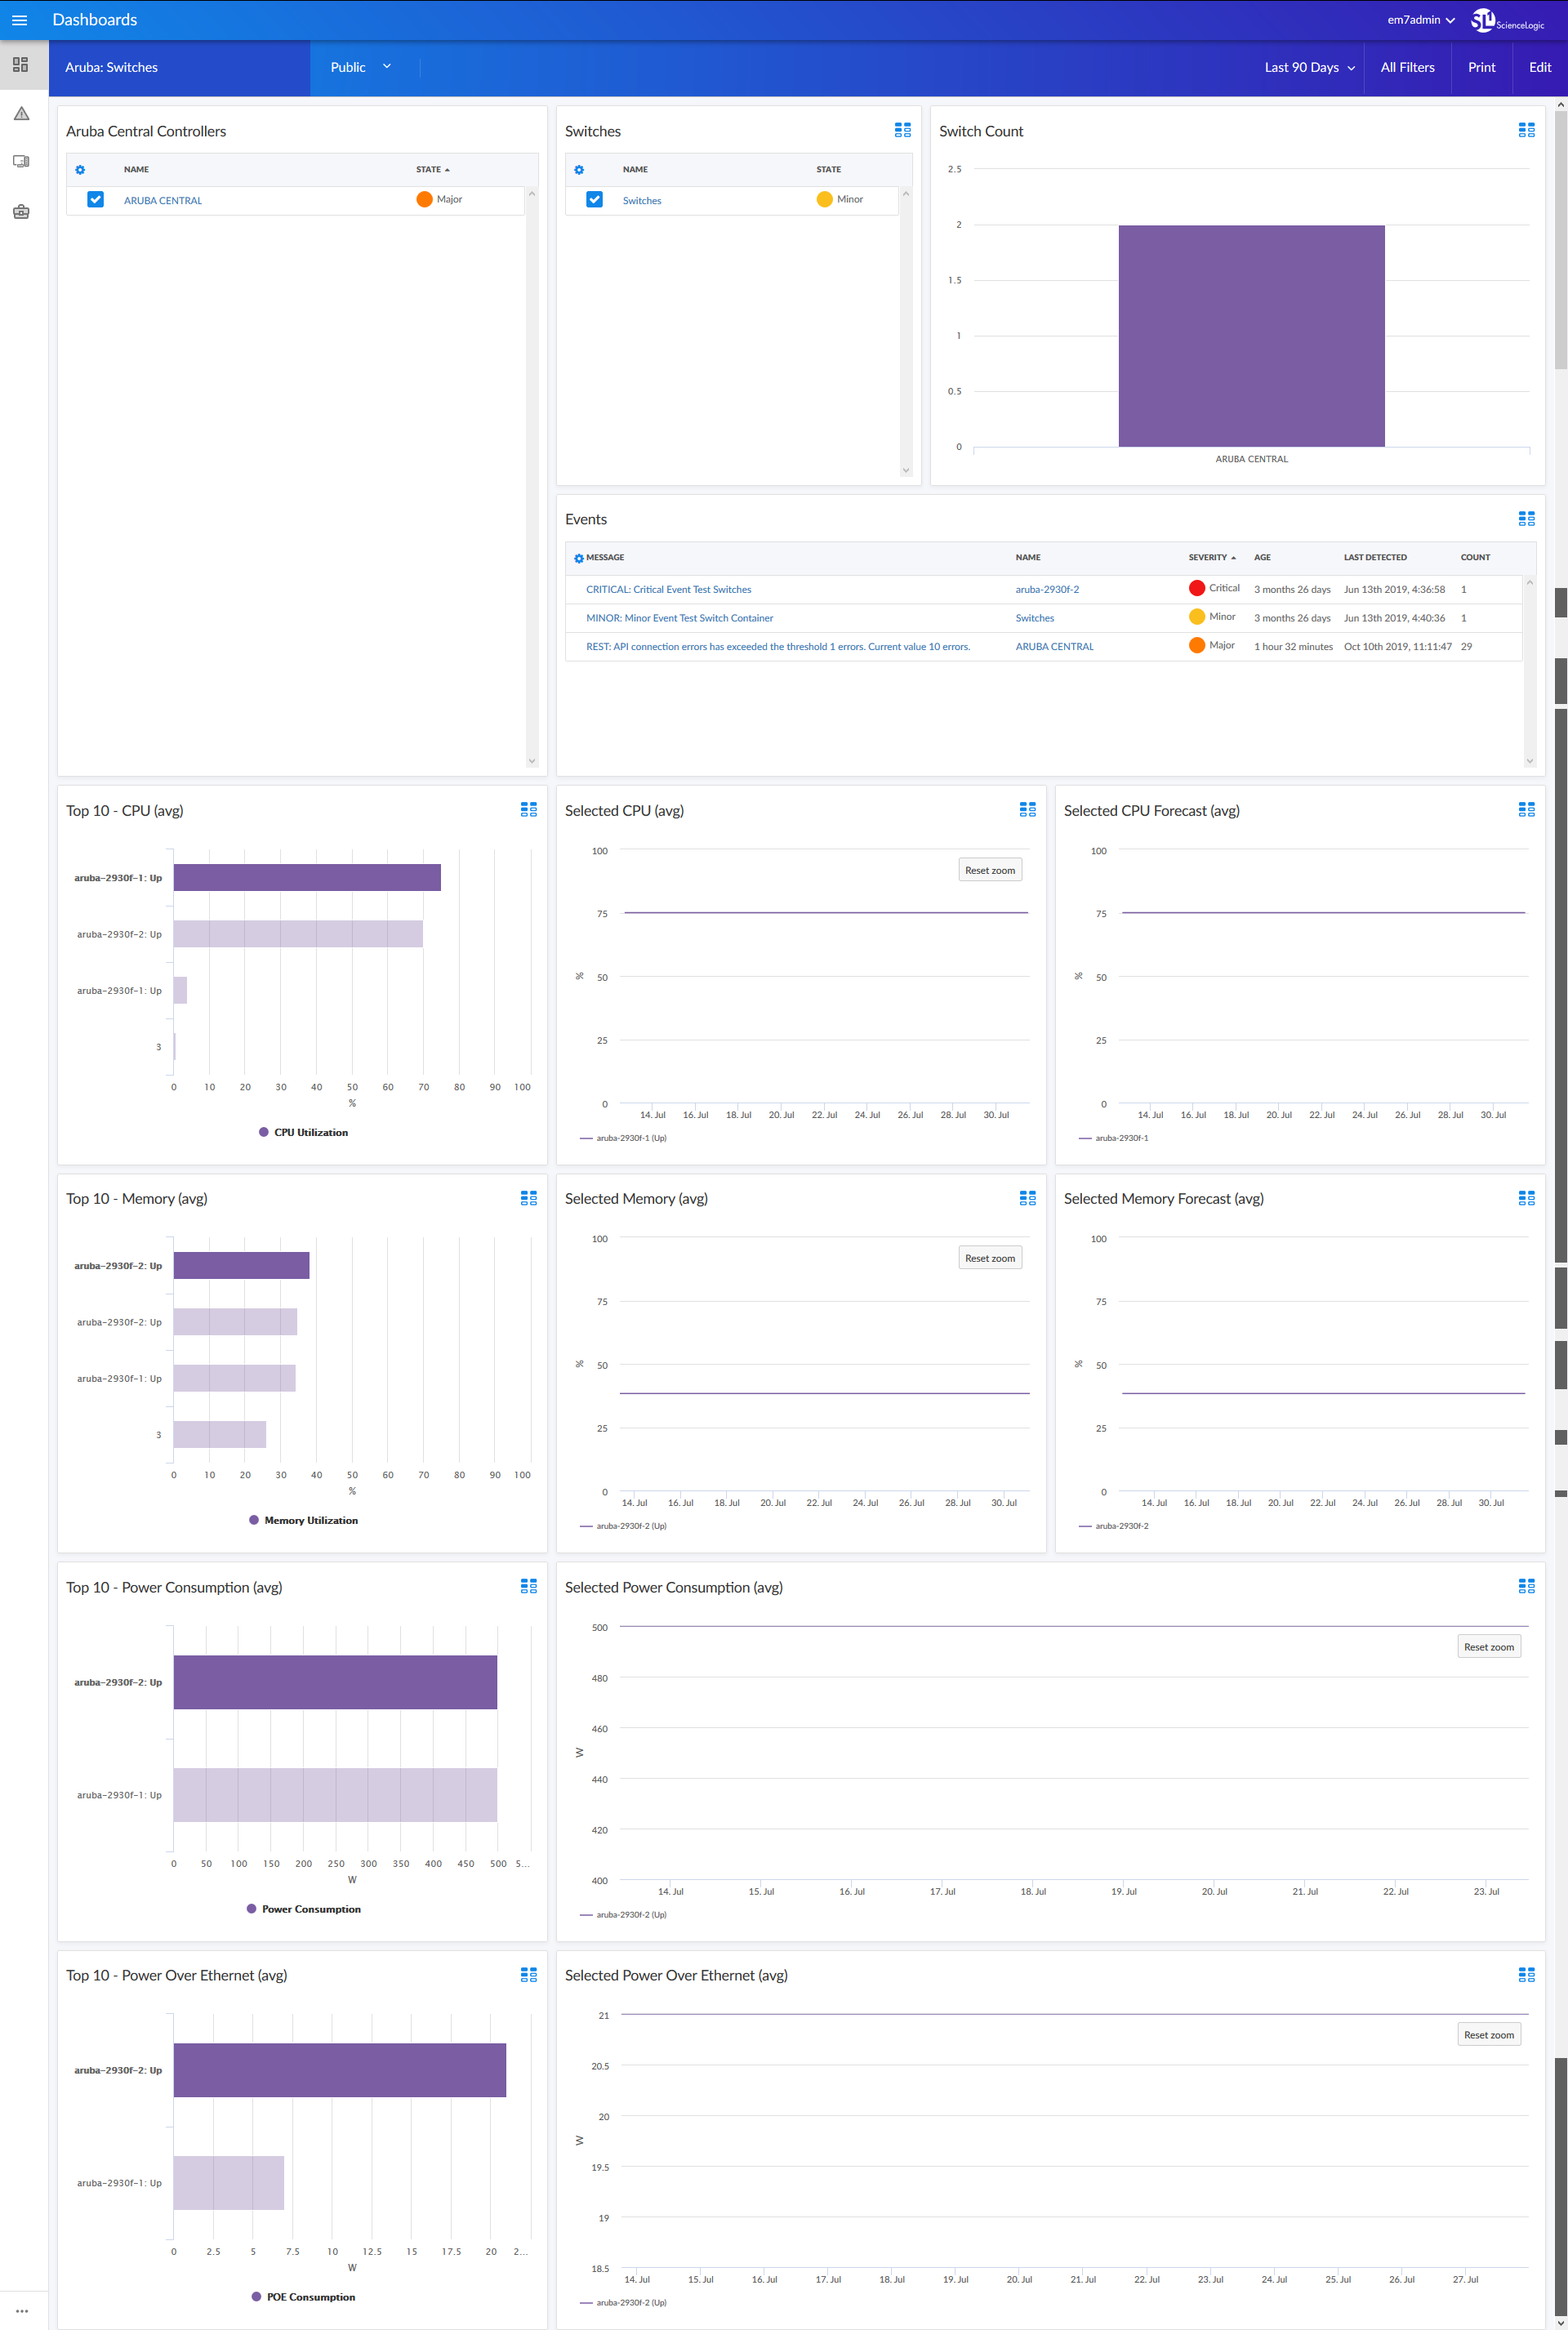
- The "Aruba: Switches" dashboard, which includes the following widgets that display overview data about your Aruba Switches:
- Aruba Central Controllers
- Switches
- Switch Count
- Events
- Top 10 - CPU (avg)
- Selected CPU (avg)
- Selected CPU Forecast (avg)
- Top 10 - Memory (avg)
- Selected Memory (avg)
- Selected Memory Forecast (avg)
- Top 10 - Power Consumption (avg)
- Selected Power Consumption (avg)
- Top 10 - Power Over Ethernet (avg)
- Selected Power Over Ethernet (avg)
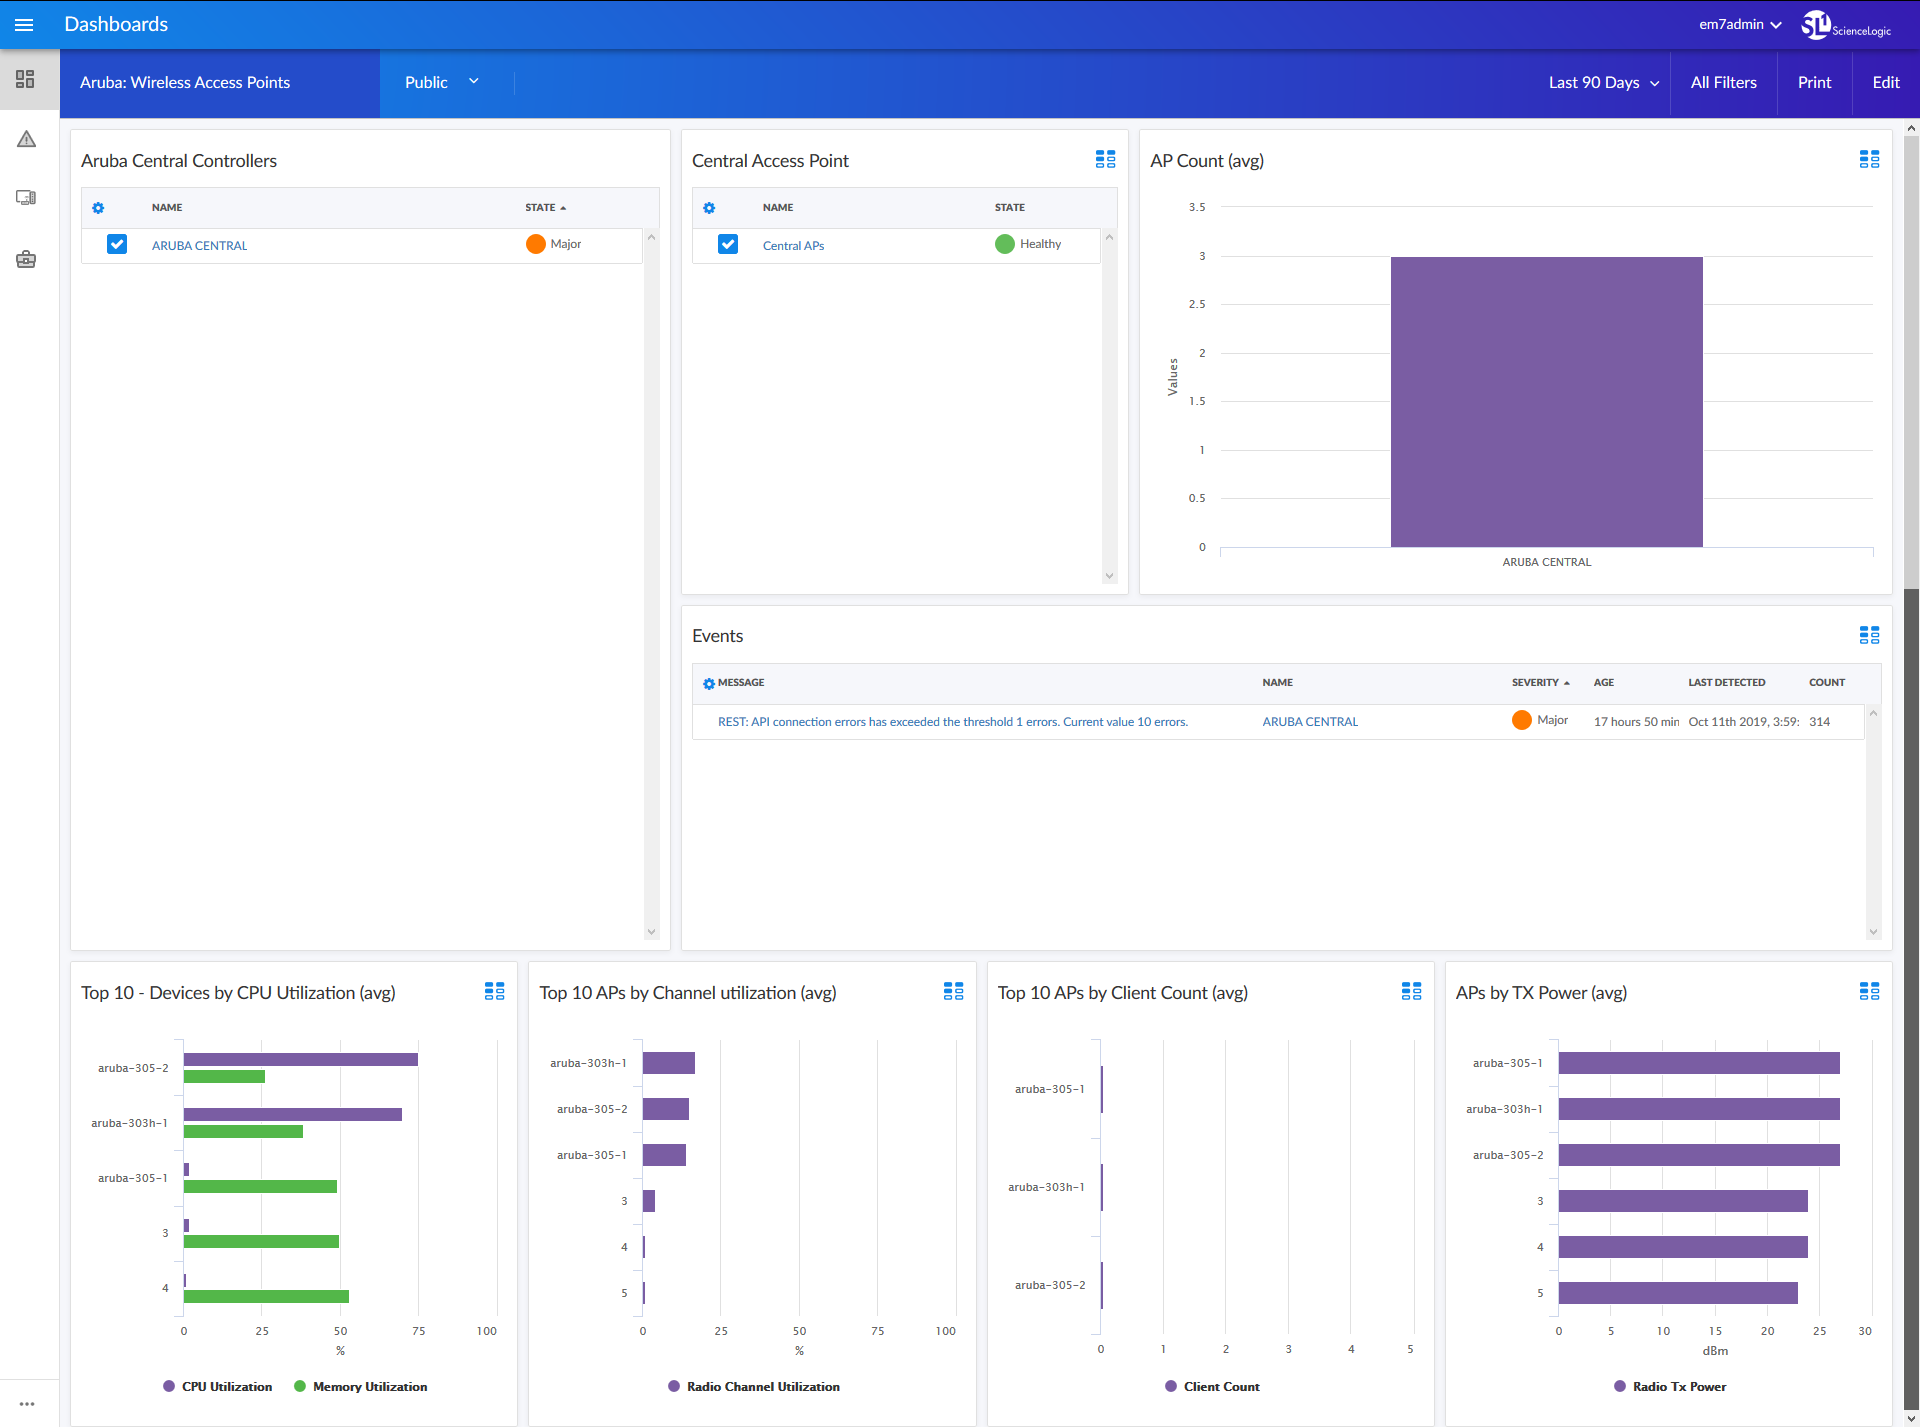
- The "Aruba: Wireless Access Points" dashboard, which includes the following widgets that display overview data about your Aruba Wireless Access Points:
- Aruba Central Controllers
- Central Access Point
- AP Count (avg)
- Events
- Top 10 - Devices by CPU Utilization (avg)
- Top 10 APs by Channel Utilization (avg)
- Top 10 APs by Client Count (avg)
- APs by TX Power (avg)
Enhancements and Issues Addressed
The following enhancements and addressed issues are included in version 102 of the Aruba: SL1 Dashboards PowerPack:
- Autoselect for context-driving widgets has been enabled in all dashboards.
- The CPU Forecast and Memory Utilization Forecast widgets were added to the "Aruba: Access Point" dashboard.
- The Selected CPU Forecast and Selected Bandwidth Usage Forecast widgets were added to the "Aruba Gateway" dashboard.
- The "Aruba: Gateways" dashboard was renamed to "Aruba: Gateway Summary".
- The CPU Forecast and Memory Forecast widgets were added to the "Aruba: Switch" dashboard.
- The Top 10 - CPU and Memory Utilization and Selected CPU and Memory Utilization widgets were split into the following widgets in the "Aruba Switches" dashboard:
- Top 10 - CPU (avg)
- Selected CPU (avg)
- Top 10 - Memory (avg)
- Selected Memory (avg)
- The Selected CPU Forecast (avg) and Selected Memory Forecast (avg) widgets were added to the "Aruba Switches" dashboard.
Known Issues
Version 102 of the Aruba: SL1 Dashboards PowerPack has no known issues.