![]()
Version 103 of the Cisco: AppDynamics SL1 Dashboards PowerPack includes improved indexing for the "AppDynamics: Application" dashboard.
NOTE: These dashboards are intended for use only in the new SL1 user interface and will not load in the classic ScienceLogic platform user interface.
- Minimum Required SL1 Version: 8.12.1
- Minimum Required AP2 Version: 5.155.0-hotfix.8
- Minimum Required Widget Components Version: 2.185.0-hotfix.3
- Minimum Required Cisco: AppDynamics PowerPack Version: 101
Before You Install or Upgrade
Before installing Cisco: AppDynamics SL1 Dashboards PowerPack version 103, you must first ensure that you are running version 8.12.1 or later of SL1.
NOTE: For details on upgrading SL1, see the appropriate Release Notes.
You must also import and install the Cisco: AppDynamics PowerPack version 101 or later before installing "Cisco: AppDynamics SL1 Dashboards" version 103.
Installation or Upgrade Process
To install this PowerPack:
- Familiarize yourself with the Known Issues for this release.
- See the Before You Install or Upgrade section. If you have not done so already, upgrade your system to the 8.12.1 or later release.
- Download the "Cisco: AppDynamics SL1 Dashboards" version 103PowerPack from the Support Site to a local computer.
- Go to the PowerPack Manager page (System > Manage > PowerPacks). Click the menu and choose Import PowerPack. When prompted, import "Cisco: AppDynamics SL1 Dashboards" version 103.
- Click the button. For details on installing PowerPacks, see the chapter on Installing a PowerPack in the PowerPacks manual.
Features
The following dashboards are included in version 103 of the Cisco: AppDynamics SL1 Dashboards PowerPack:
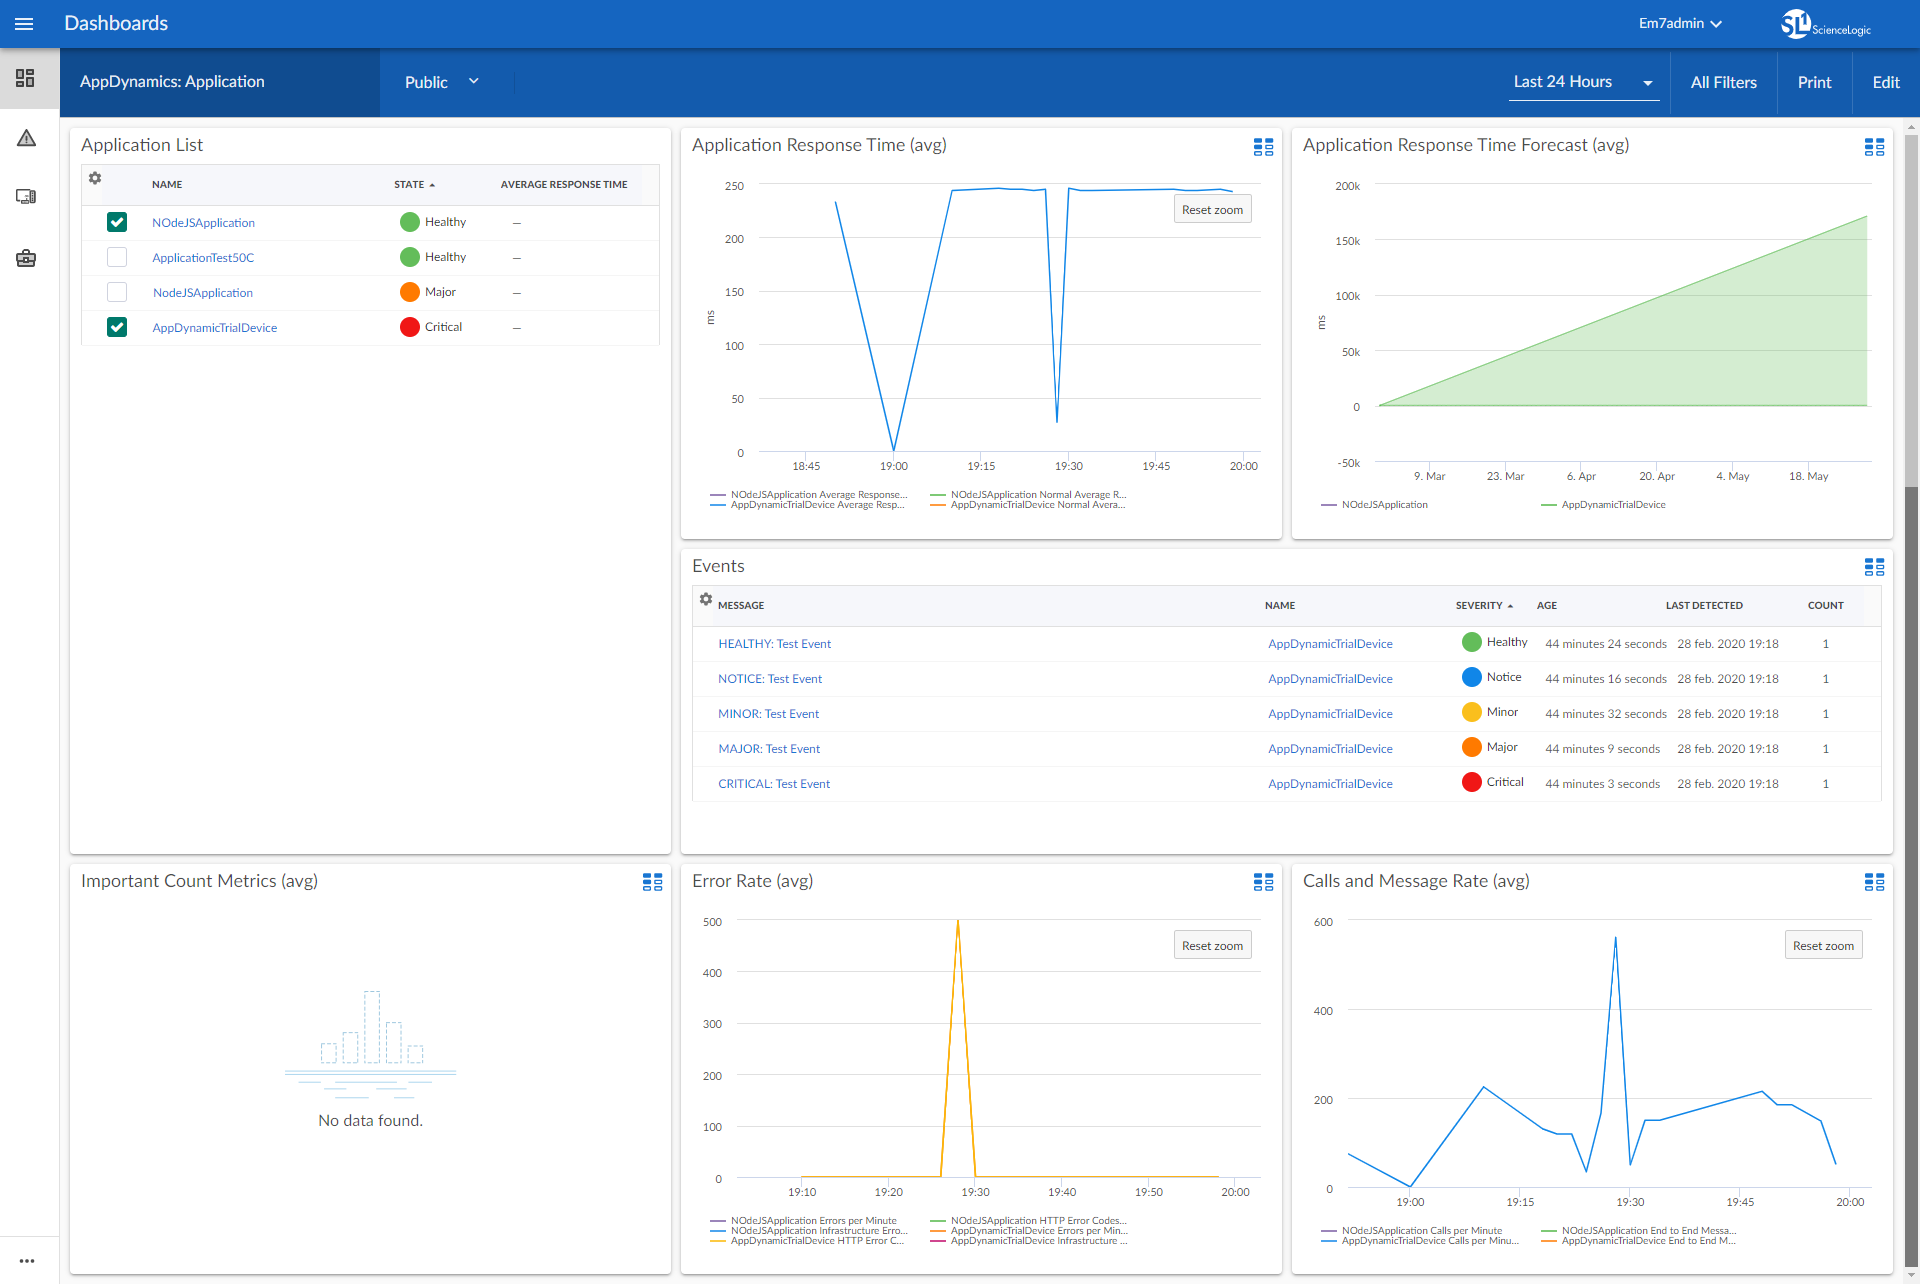
- An "AppDynamics: Application" dashboard, which includes the following widgets that display data about your AppDynamics applications:
- Application List
- Application Response Time (avg)
- Application Response Time Forecast (avg)
- Events
- Important Count Metrics (avg)
- Error Rate (avg)
- Calls and Message Rate (avg)
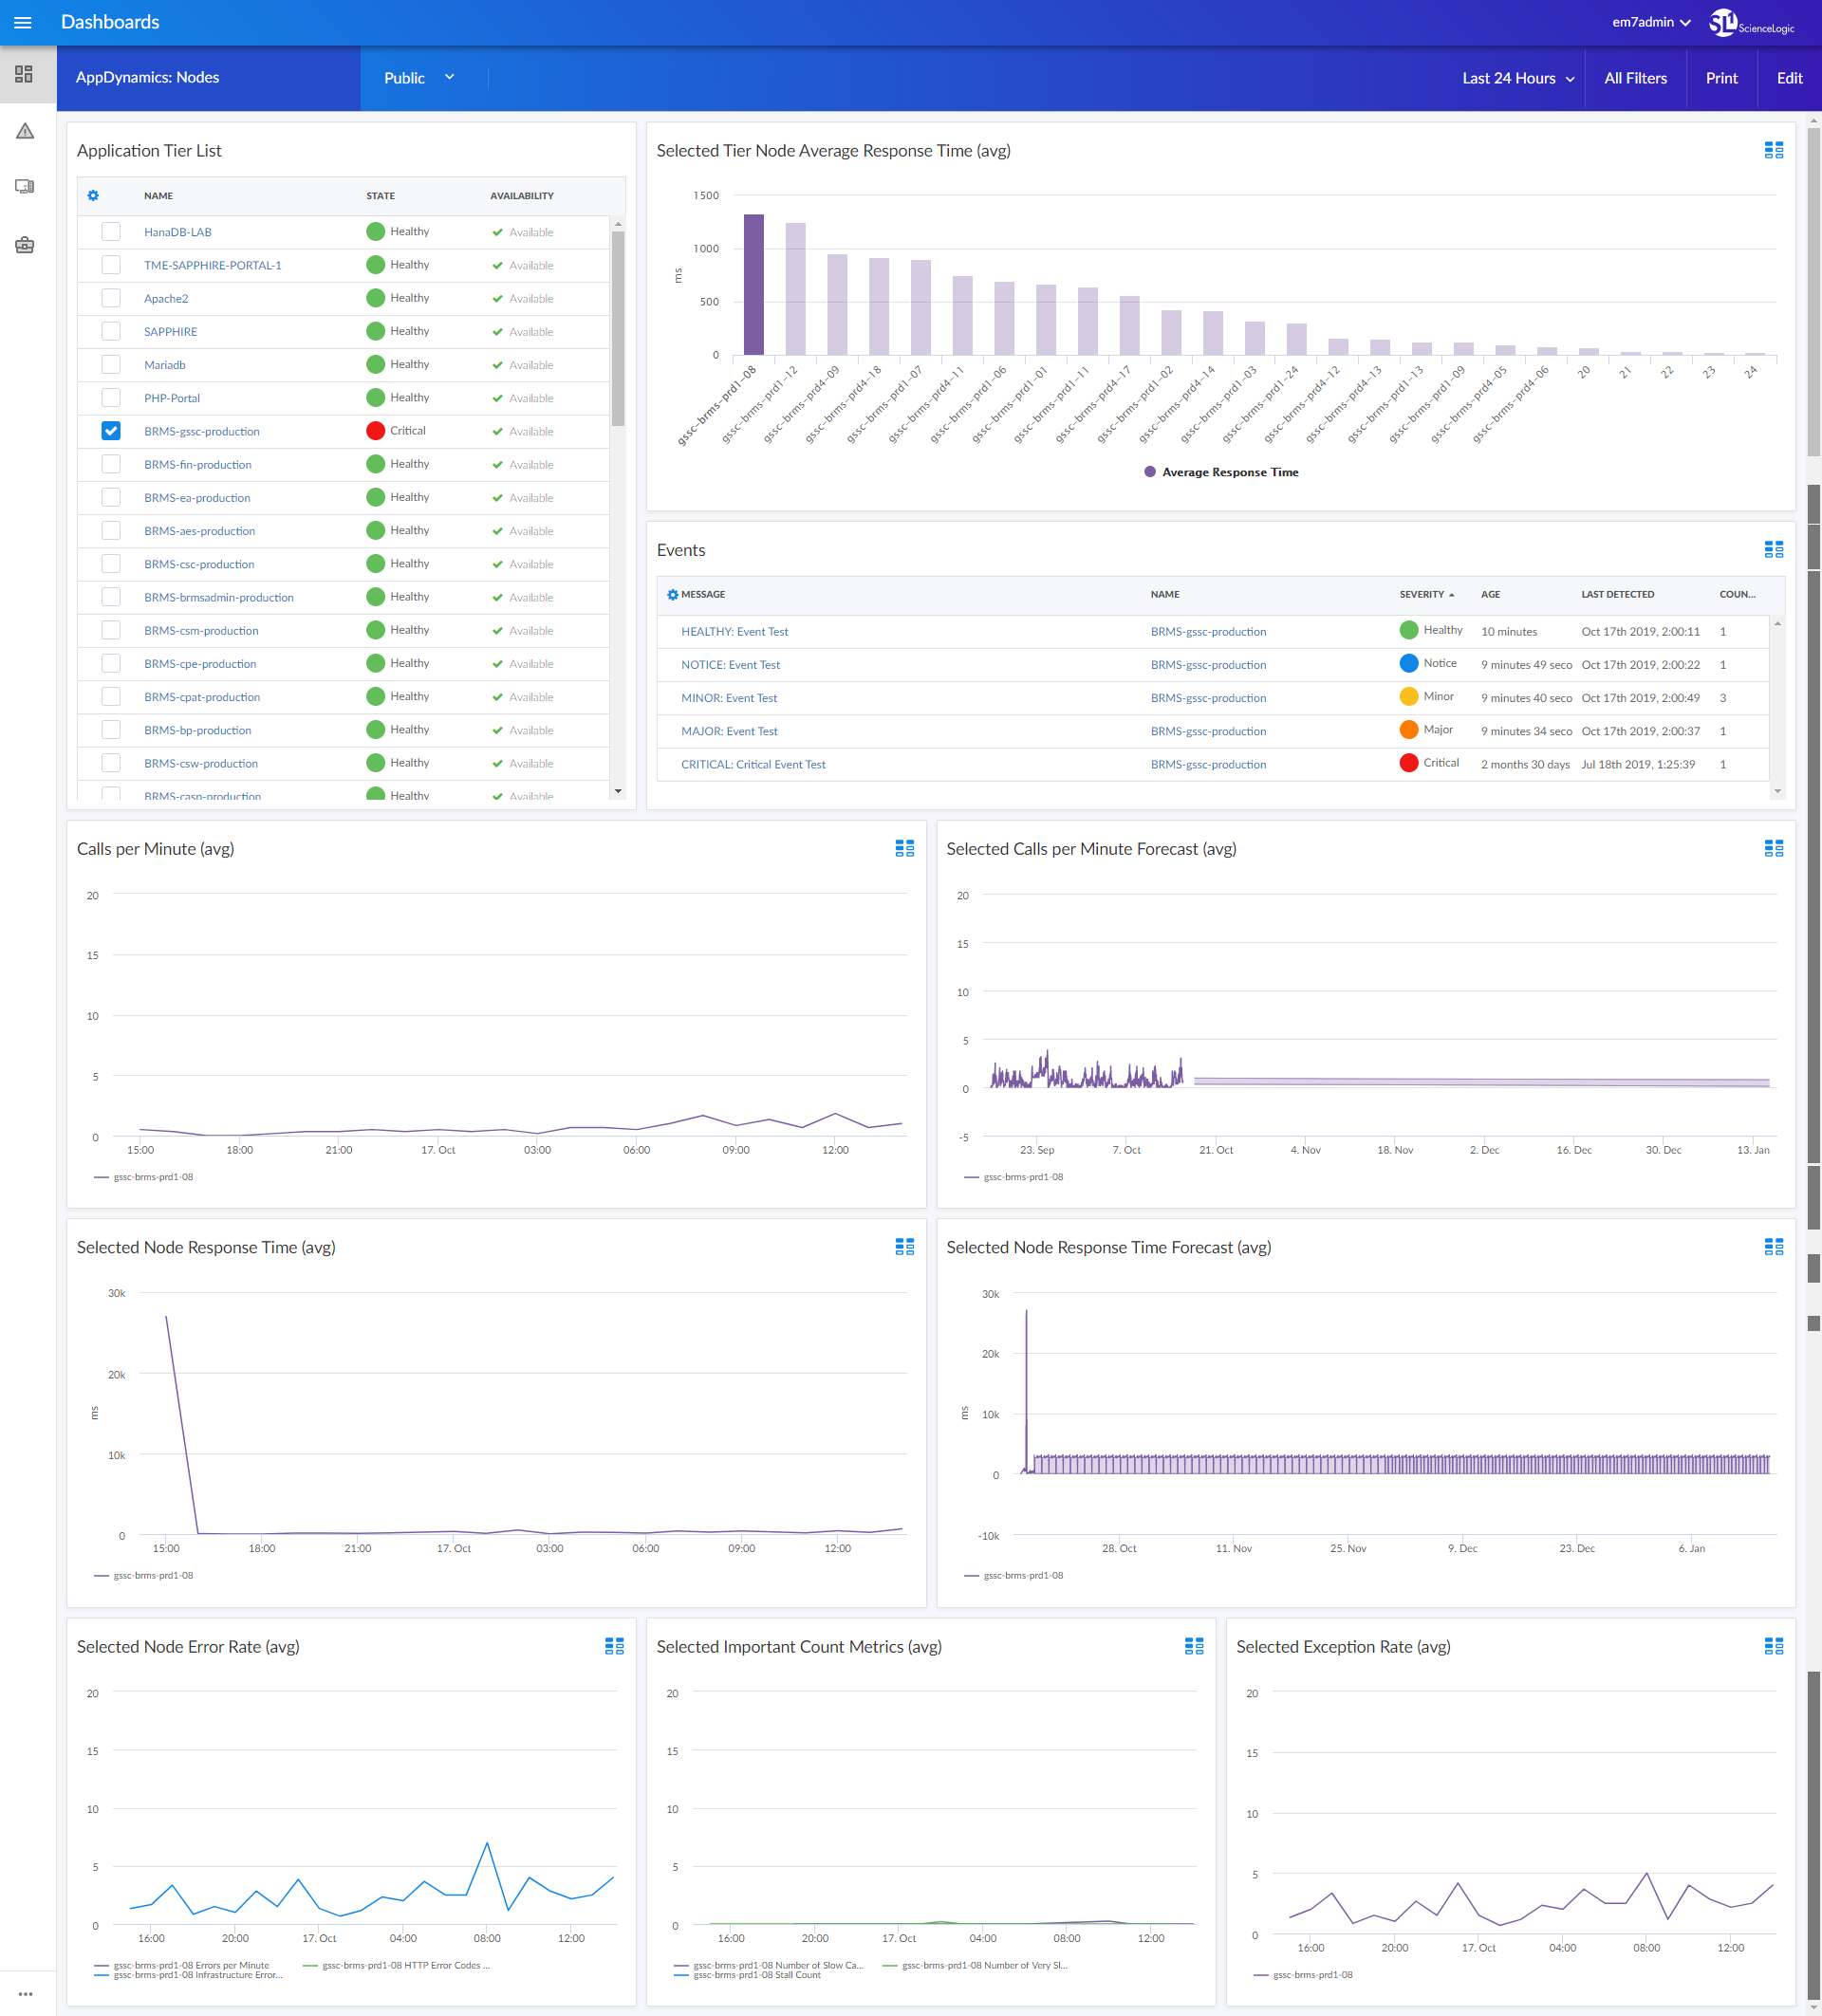
- An "AppDynamics: Nodes" dashboard, which includes the following widgets that display data about your AppDynamics nodes:
- Application Tier List
- Selected Tier Node Average Response Time (avg)
- Events
- Calls per Minute (avg)
- Selected Calls per Minute Forecast (avg)
- Selected Node Response Time (avg)
- Selected Node Response Time Forecast (avg)
- Selected Node Error Rate (avg)
- Selected Important Count Metrics (avg)
- Selected Exception Rate (avg)
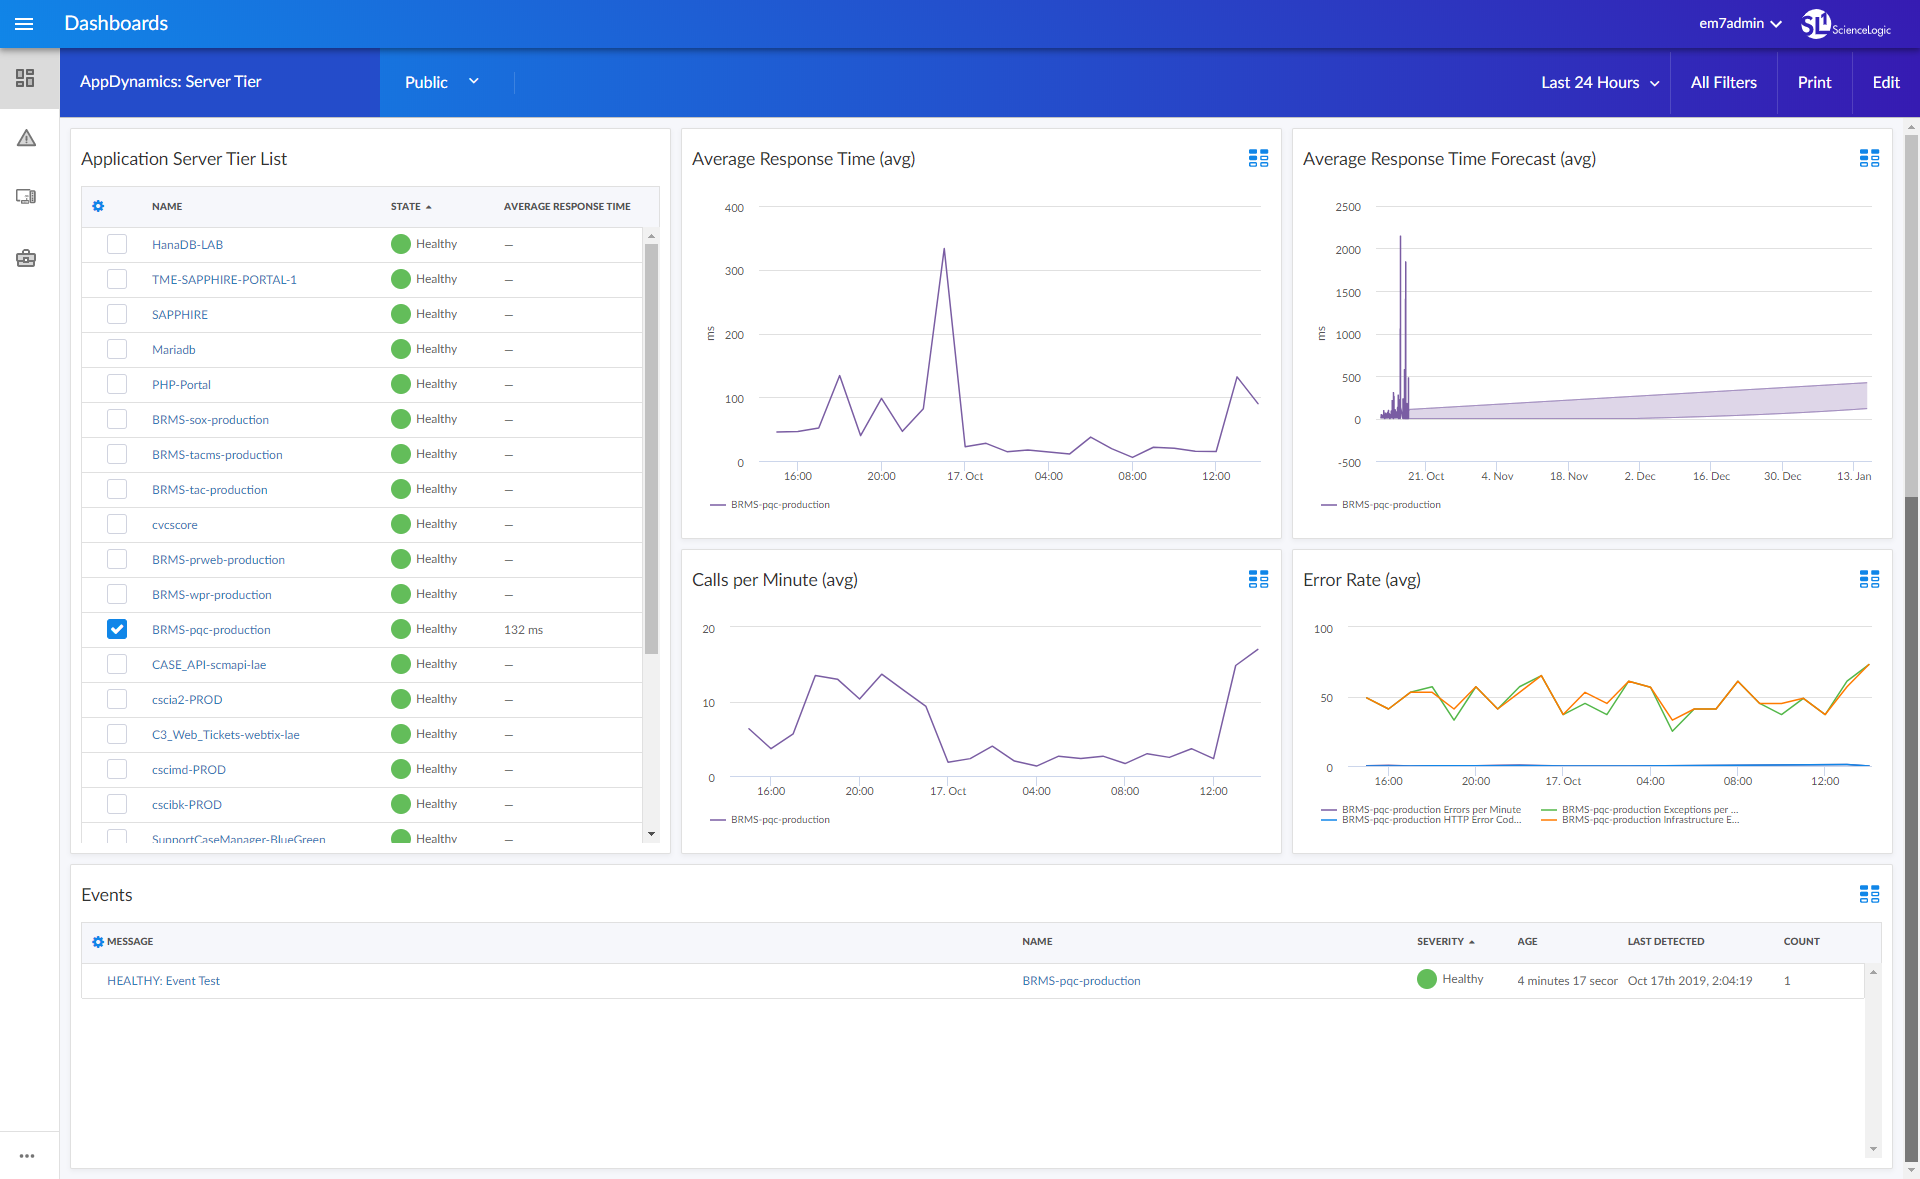
- An "AppDynamics: Server Tier" dashboard, which includes the following widgets that display data about your AppDynamics server tiers:
- Application Server Tier List
- Average Response Time (avg)
- Average Response Time Forecast (avg)
- Calls per Minute (avg)
- Error Rate (avg)
- Events
Enhancements and Issues Addressed
The following enhancements and addressed issues are included in version 103 of the Cisco: AppDynamics SL1 Dashboards PowerPack:
-
Auto-management of features was disabled in all line chart and forecast widgets in all AppDynamics dashboards.
- The Application List widget in the "AppDynamics: Application" dashboard was updated to improve indexing.
Known Issues
Version 103 of the Cisco: AppDynamics SL1 Dashboards PowerPack has no known issues.