![]()
Version 102 of the Citrix: Xen SL1 Dashboards PowerPack includes Dashboards that present graphical representations of the configuration data and performance metrics that are collected for Citrix Xen devices by the Citrix: Xen PowerPack.
NOTE: These dashboards are intended for use only in the new SL1 user interface and will not load in the classic ScienceLogic platform user interface.
- Minimum Required SL1 Version: 8.12.1
- Minimum Required AP2 Version: 5.155.0-hotfix.8
- Minimum Required Widget Components Version: 2.185.0-hotfix.3
- Minimum Required Citrix: XenPowerPack Version: 102
Before You Install
Before installing Citrix: Xen SL1 Dashboards PowerPack version 102, you must first ensure that you are running version 8.12.1 or later of SL1.
NOTE: For details on upgrading SL1, see the appropriate Release Notes.
You must also import and install theCitrix: XenPowerPack version 102 or later before installing the PowerPack.
Installation Process
To install this PowerPack:
- Familiarize yourself with the Known Issues for this release.
- See the Before You Install or Upgrade section. If you have not done so already, upgrade your system to the 8.12.1 or later release.
- Download the "Citrix: Xen SL1 Dashboards" version 102PowerPack from the Support Site to a local computer.
- Go to the PowerPack Manager page (System > Manage > PowerPacks). Click the menu and choose Import PowerPack. When prompted, import "Citrix: Xen SL1 Dashboards" version 102.
- Click the button. For details on installing PowerPacks, see the chapter on Installing a PowerPack in the PowerPacks manual.
Features
The following dashboards are included in version 102 of the Citrix: Xen SL1 Dashboards PowerPack:
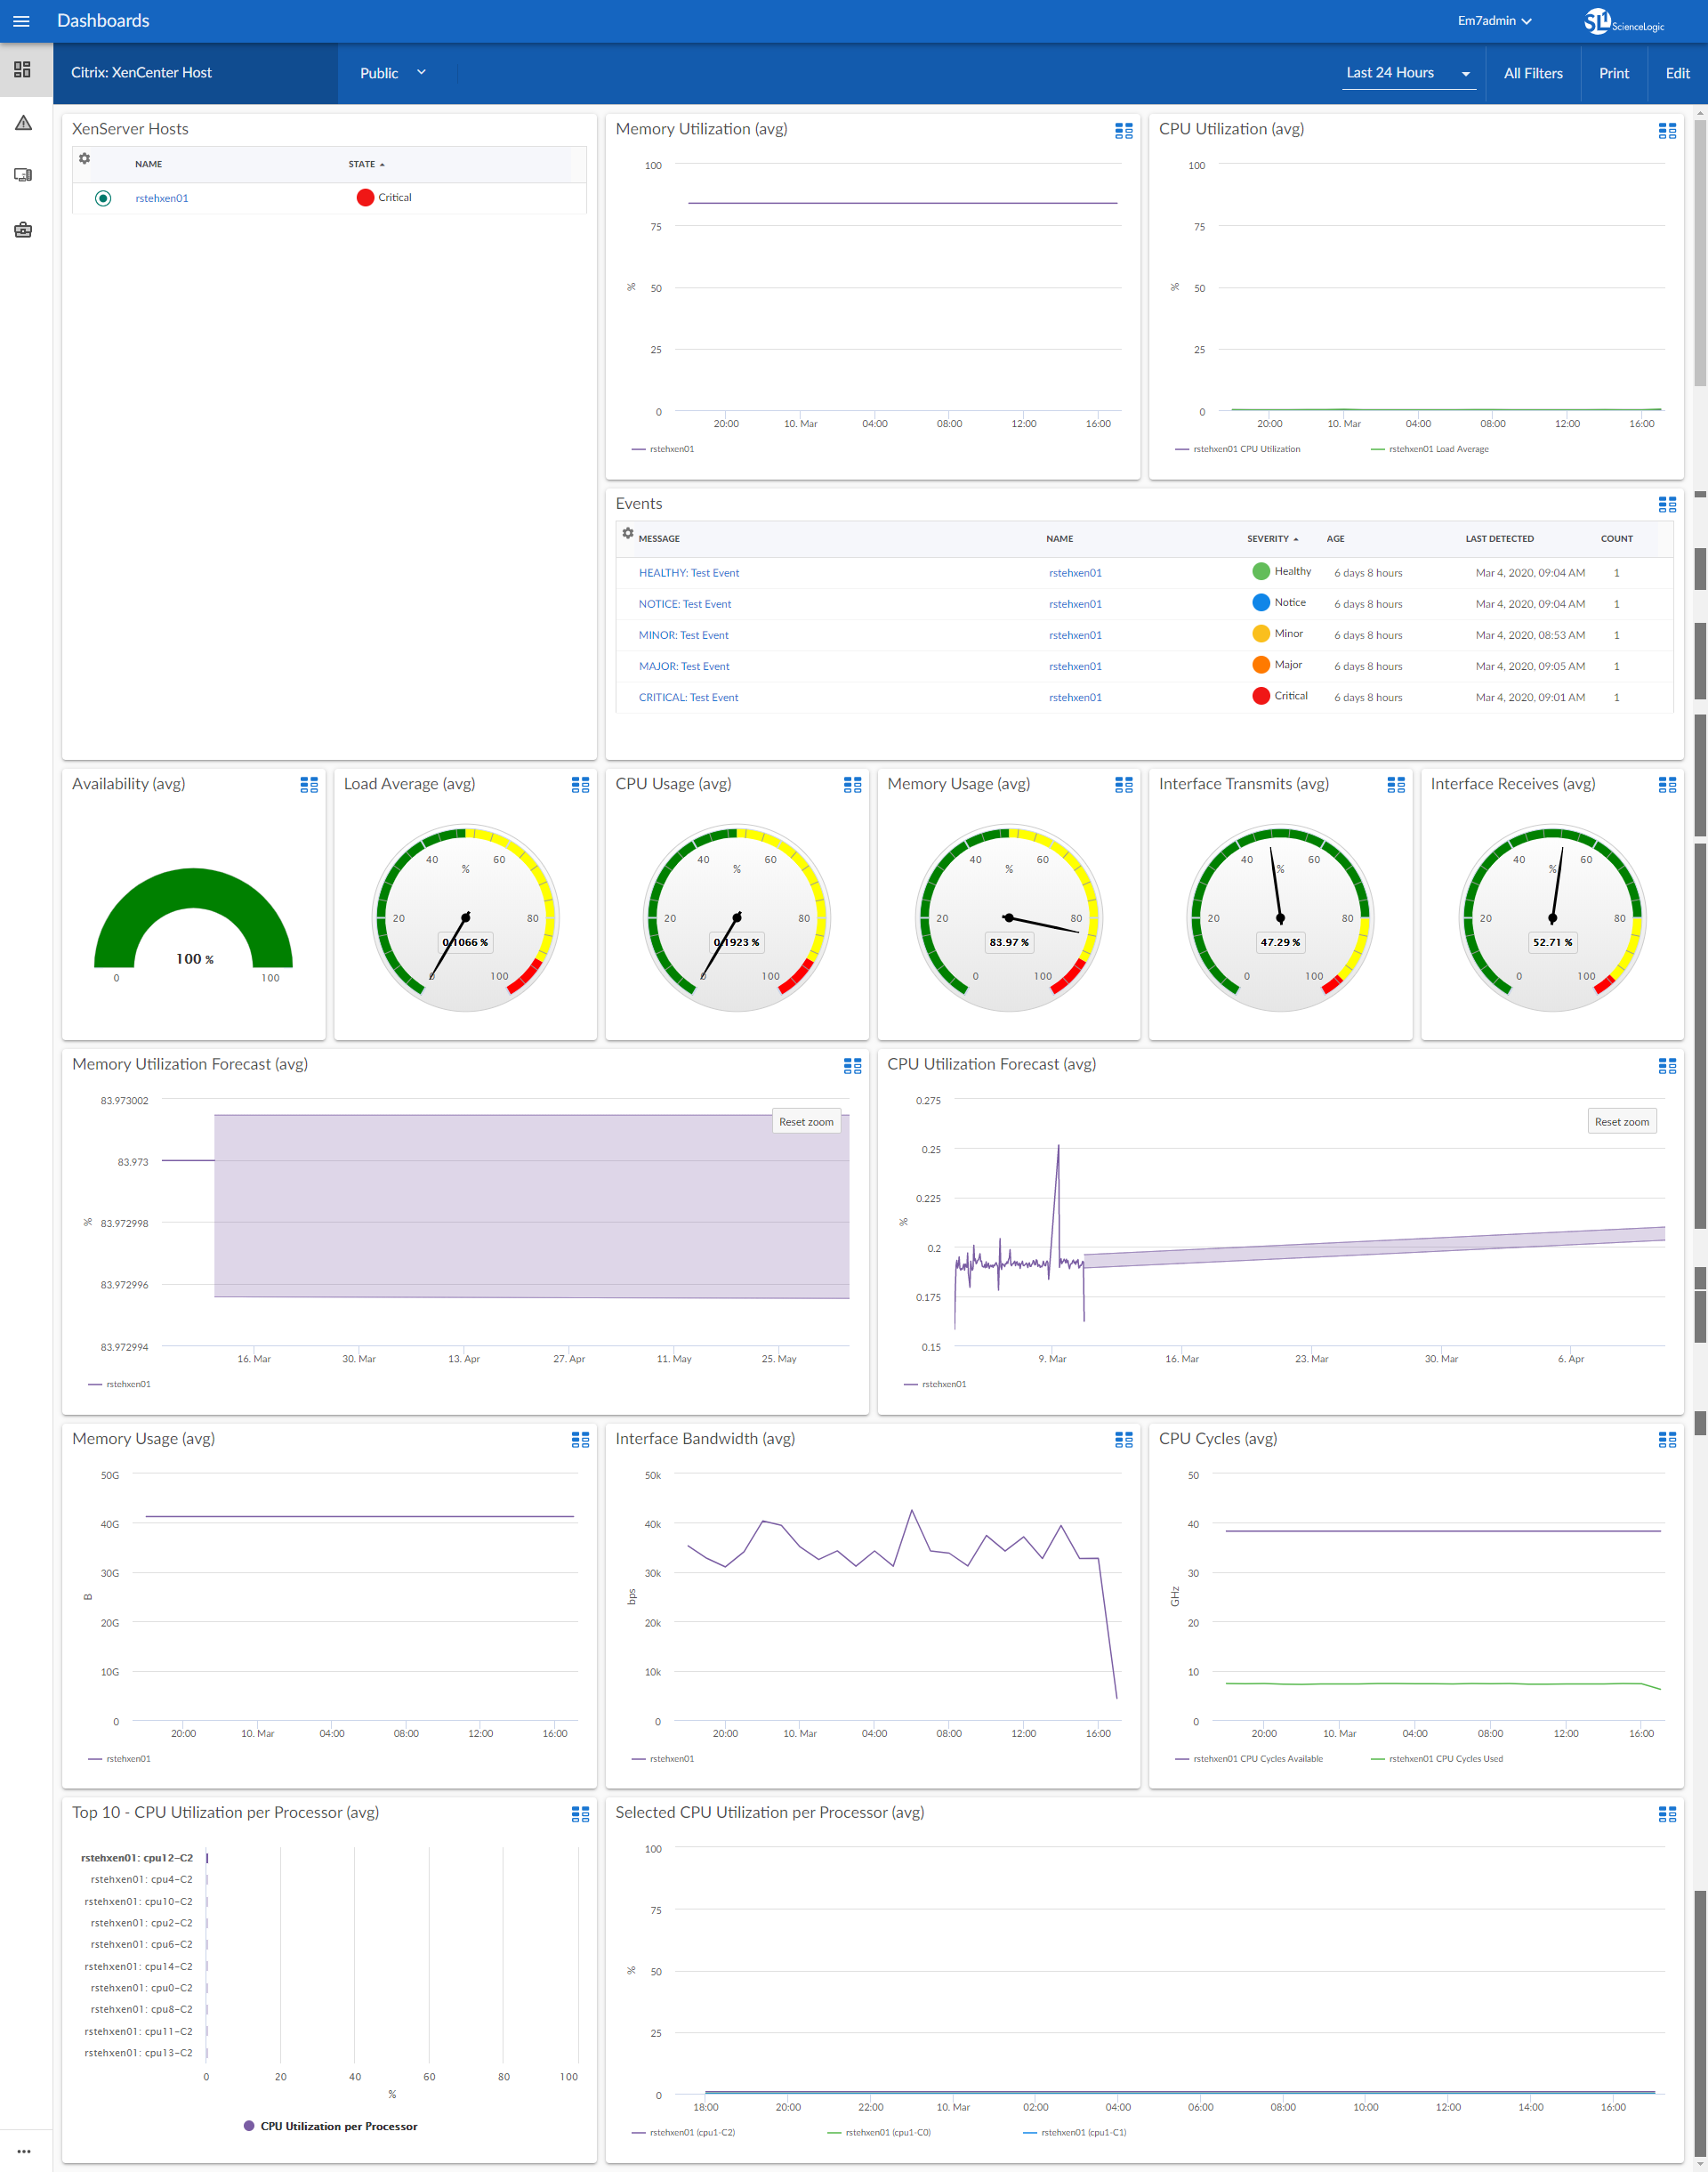
- A "Citrix: XenCenter Host" dashboard, which includes the following widgets that display data about your hosts:
- XenServer Hosts
- Memory Utilization (avg)
- CPU Utilization (avg)
- Events
- Availability (avg)
- Load Average (avg)
- CPU Usage (avg)
- Memory Usage (avg) Gauge Chart
- Interface Transmits (avg)
- Interface Receives (avg)
- Memory Utilization Forecast (avg)
- CPU Utilization Forecast (avg)
- Memory Usage (avg) Line Chart
- Interface Bandwidth (avg)
- CPU Cycles (avg)
- Top 10 - CPU Utilization per Processor (avg)
- Selected CPU Utilization per Processor (avg)
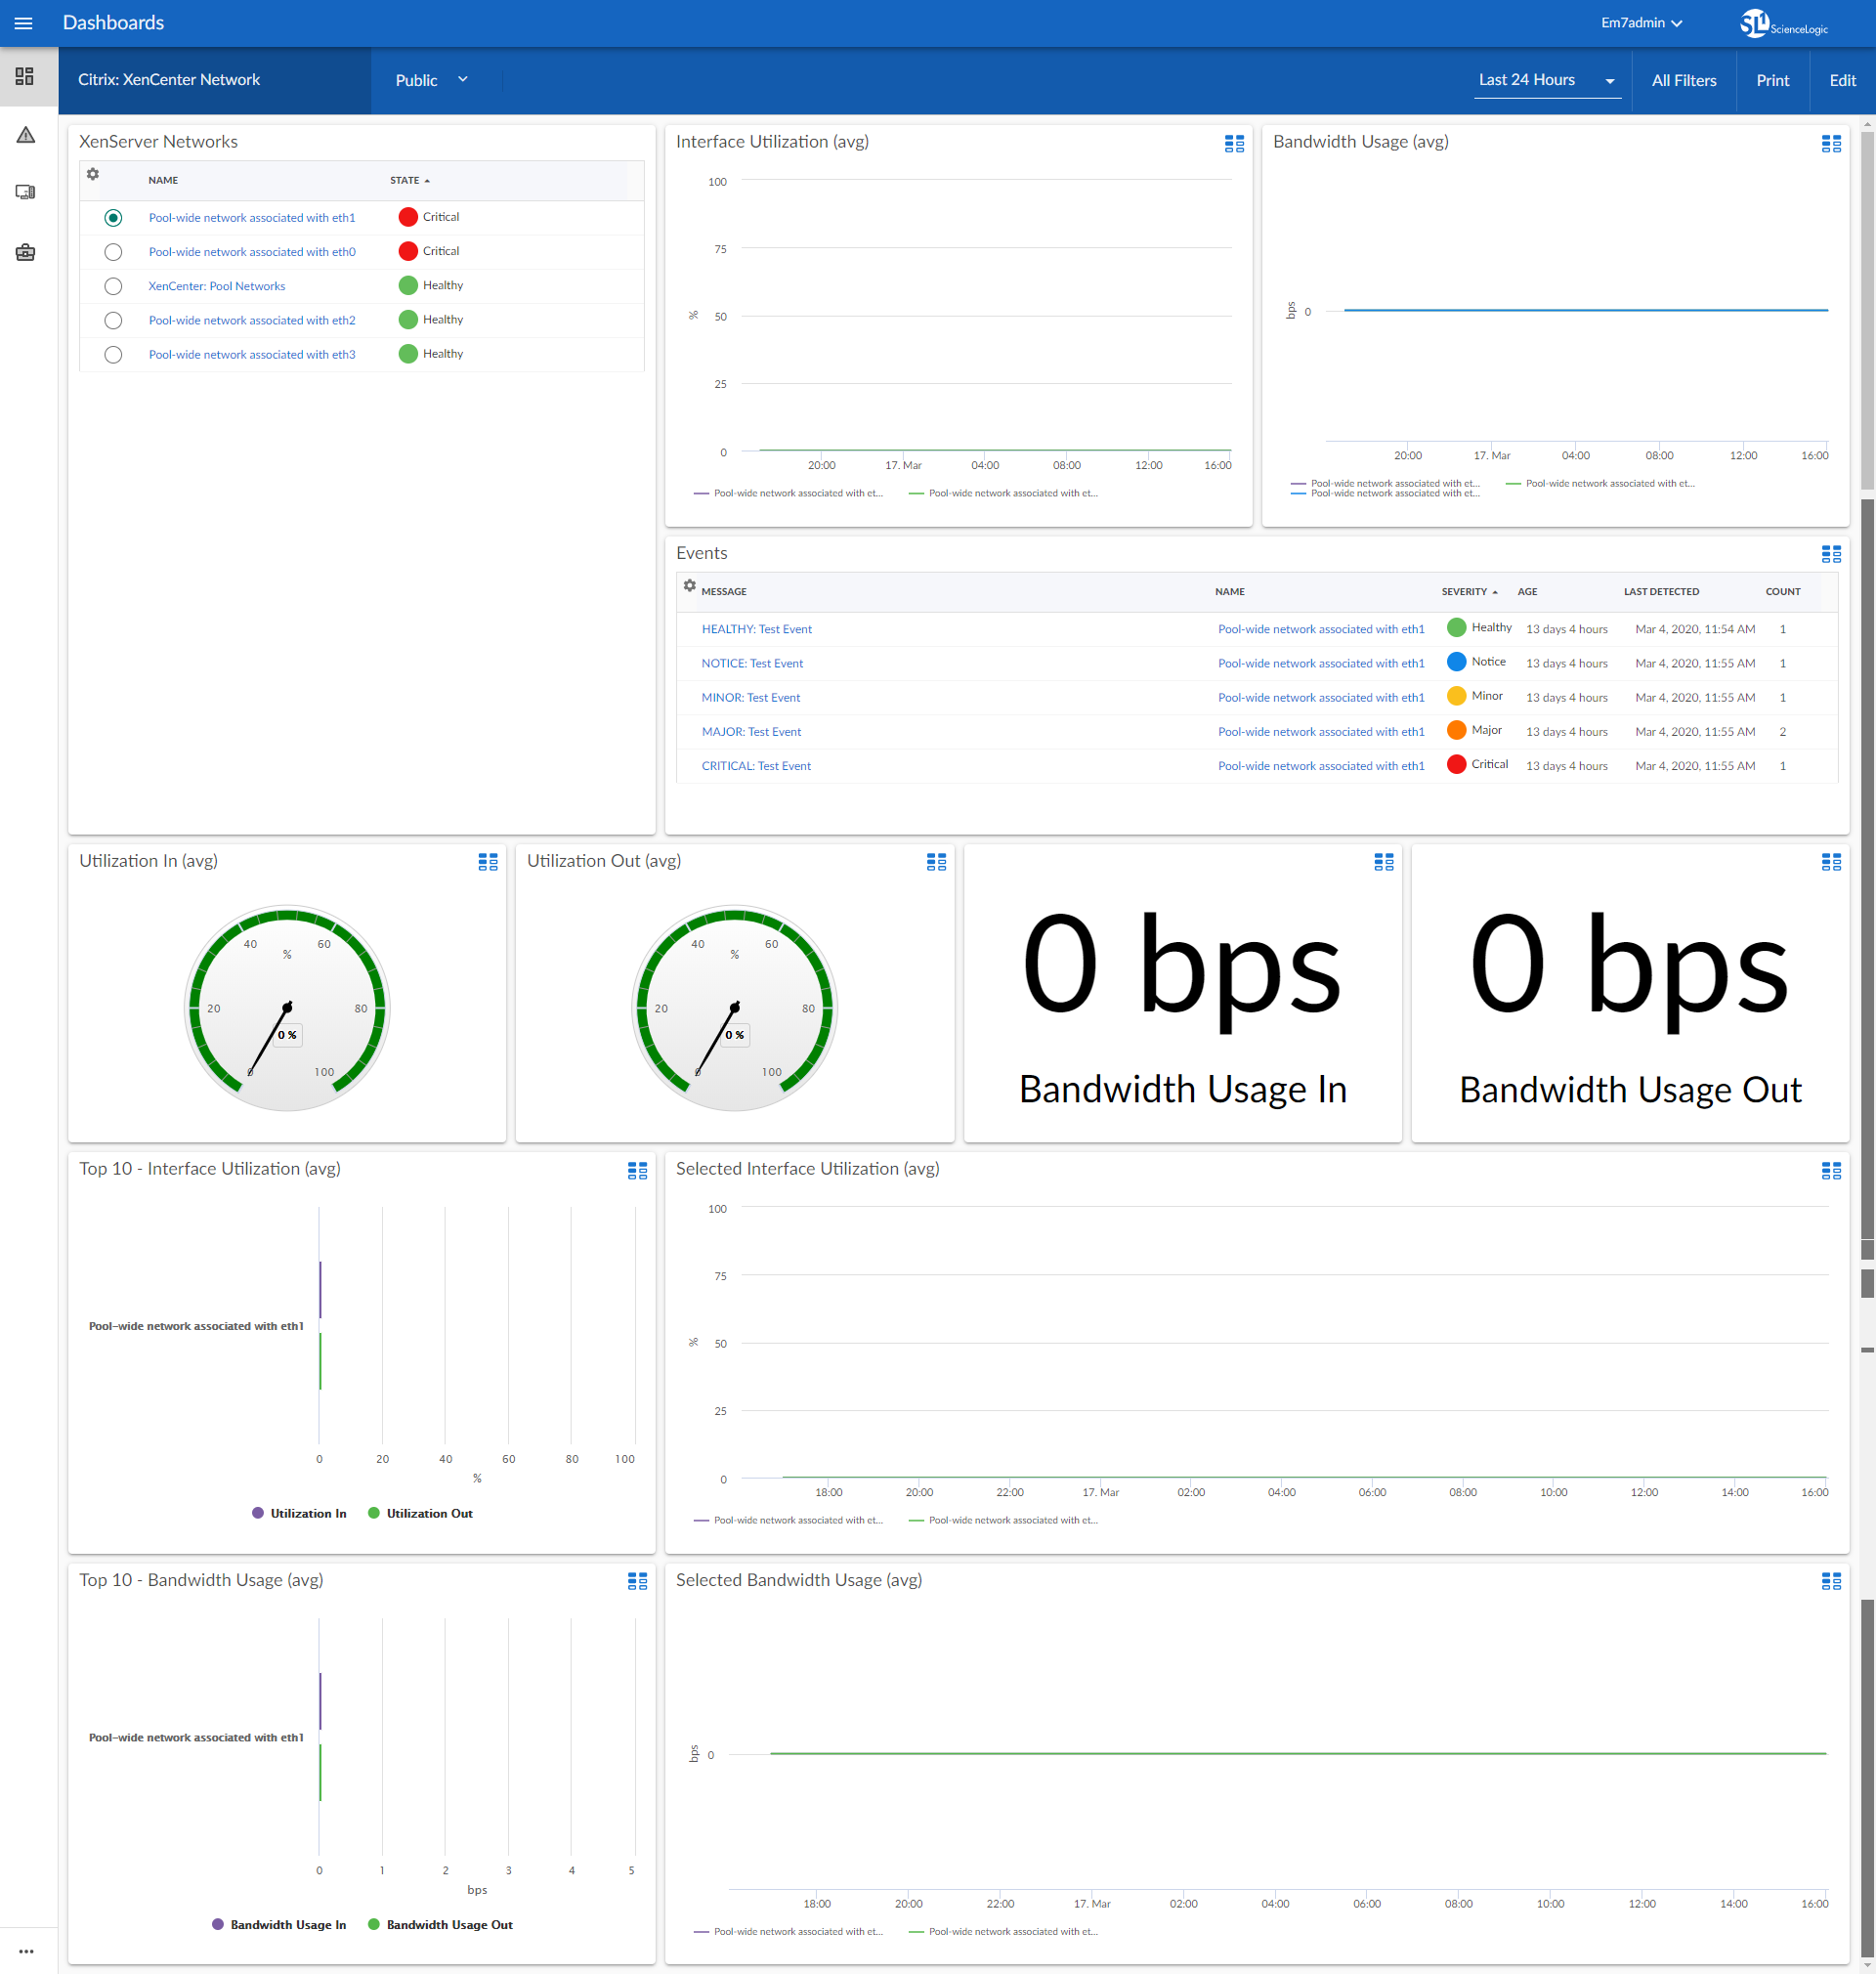
- A "Citrix: XenCenter Network" dashboard, which includes the following widgets that display data about your networks:
- XenServer Networks
- Interface Utilization (avg)
- Bandwidth Usage (avg)
- Events
- Utilization In (avg)
- Utilization Out (avg)
- Bandwidth Usage In
- Bandwidth Usage Out
- Top 10 - Interface Utilization (avg)
- Selected Interface Utilization (avg)
- Top 10 - Bandwidth Usage (avg)
- Selected Bandwidth Usage (avg)
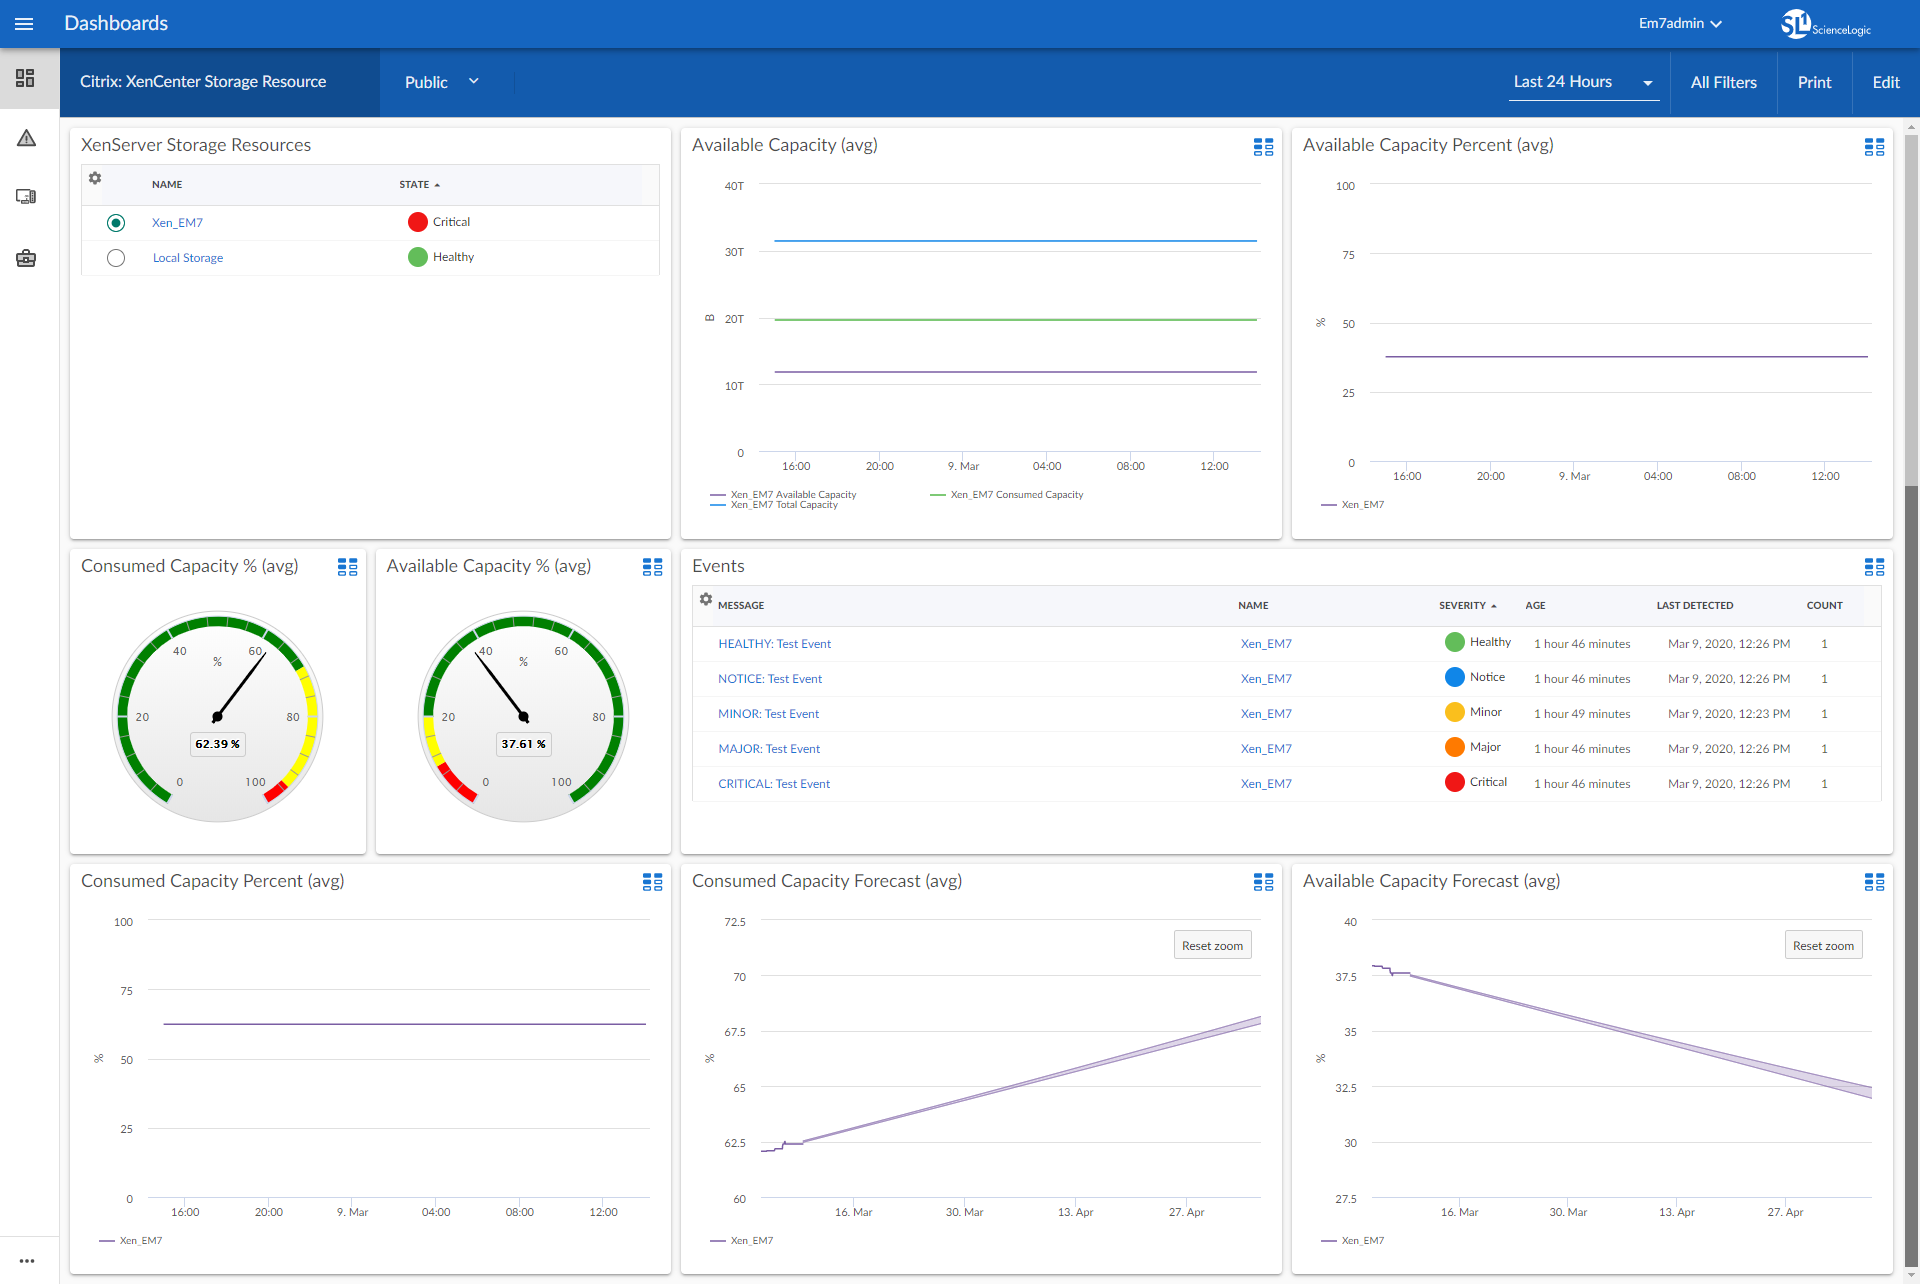
- A "Citrix: XenCenter Storage Resource" dashboard, which includes the following widgets that display data about your storage resources:
- XenServer Storage Resources
- Available Capacity (avg)
- Available Capacity Percent (avg)
- Consumed Capacity % (avg)
- Available Capacity % (avg)
- Events
- Consumed Capacity Percent (avg)
- Consumed Capacity Forecast (avg)
- Available Capacity Forecast (avg)
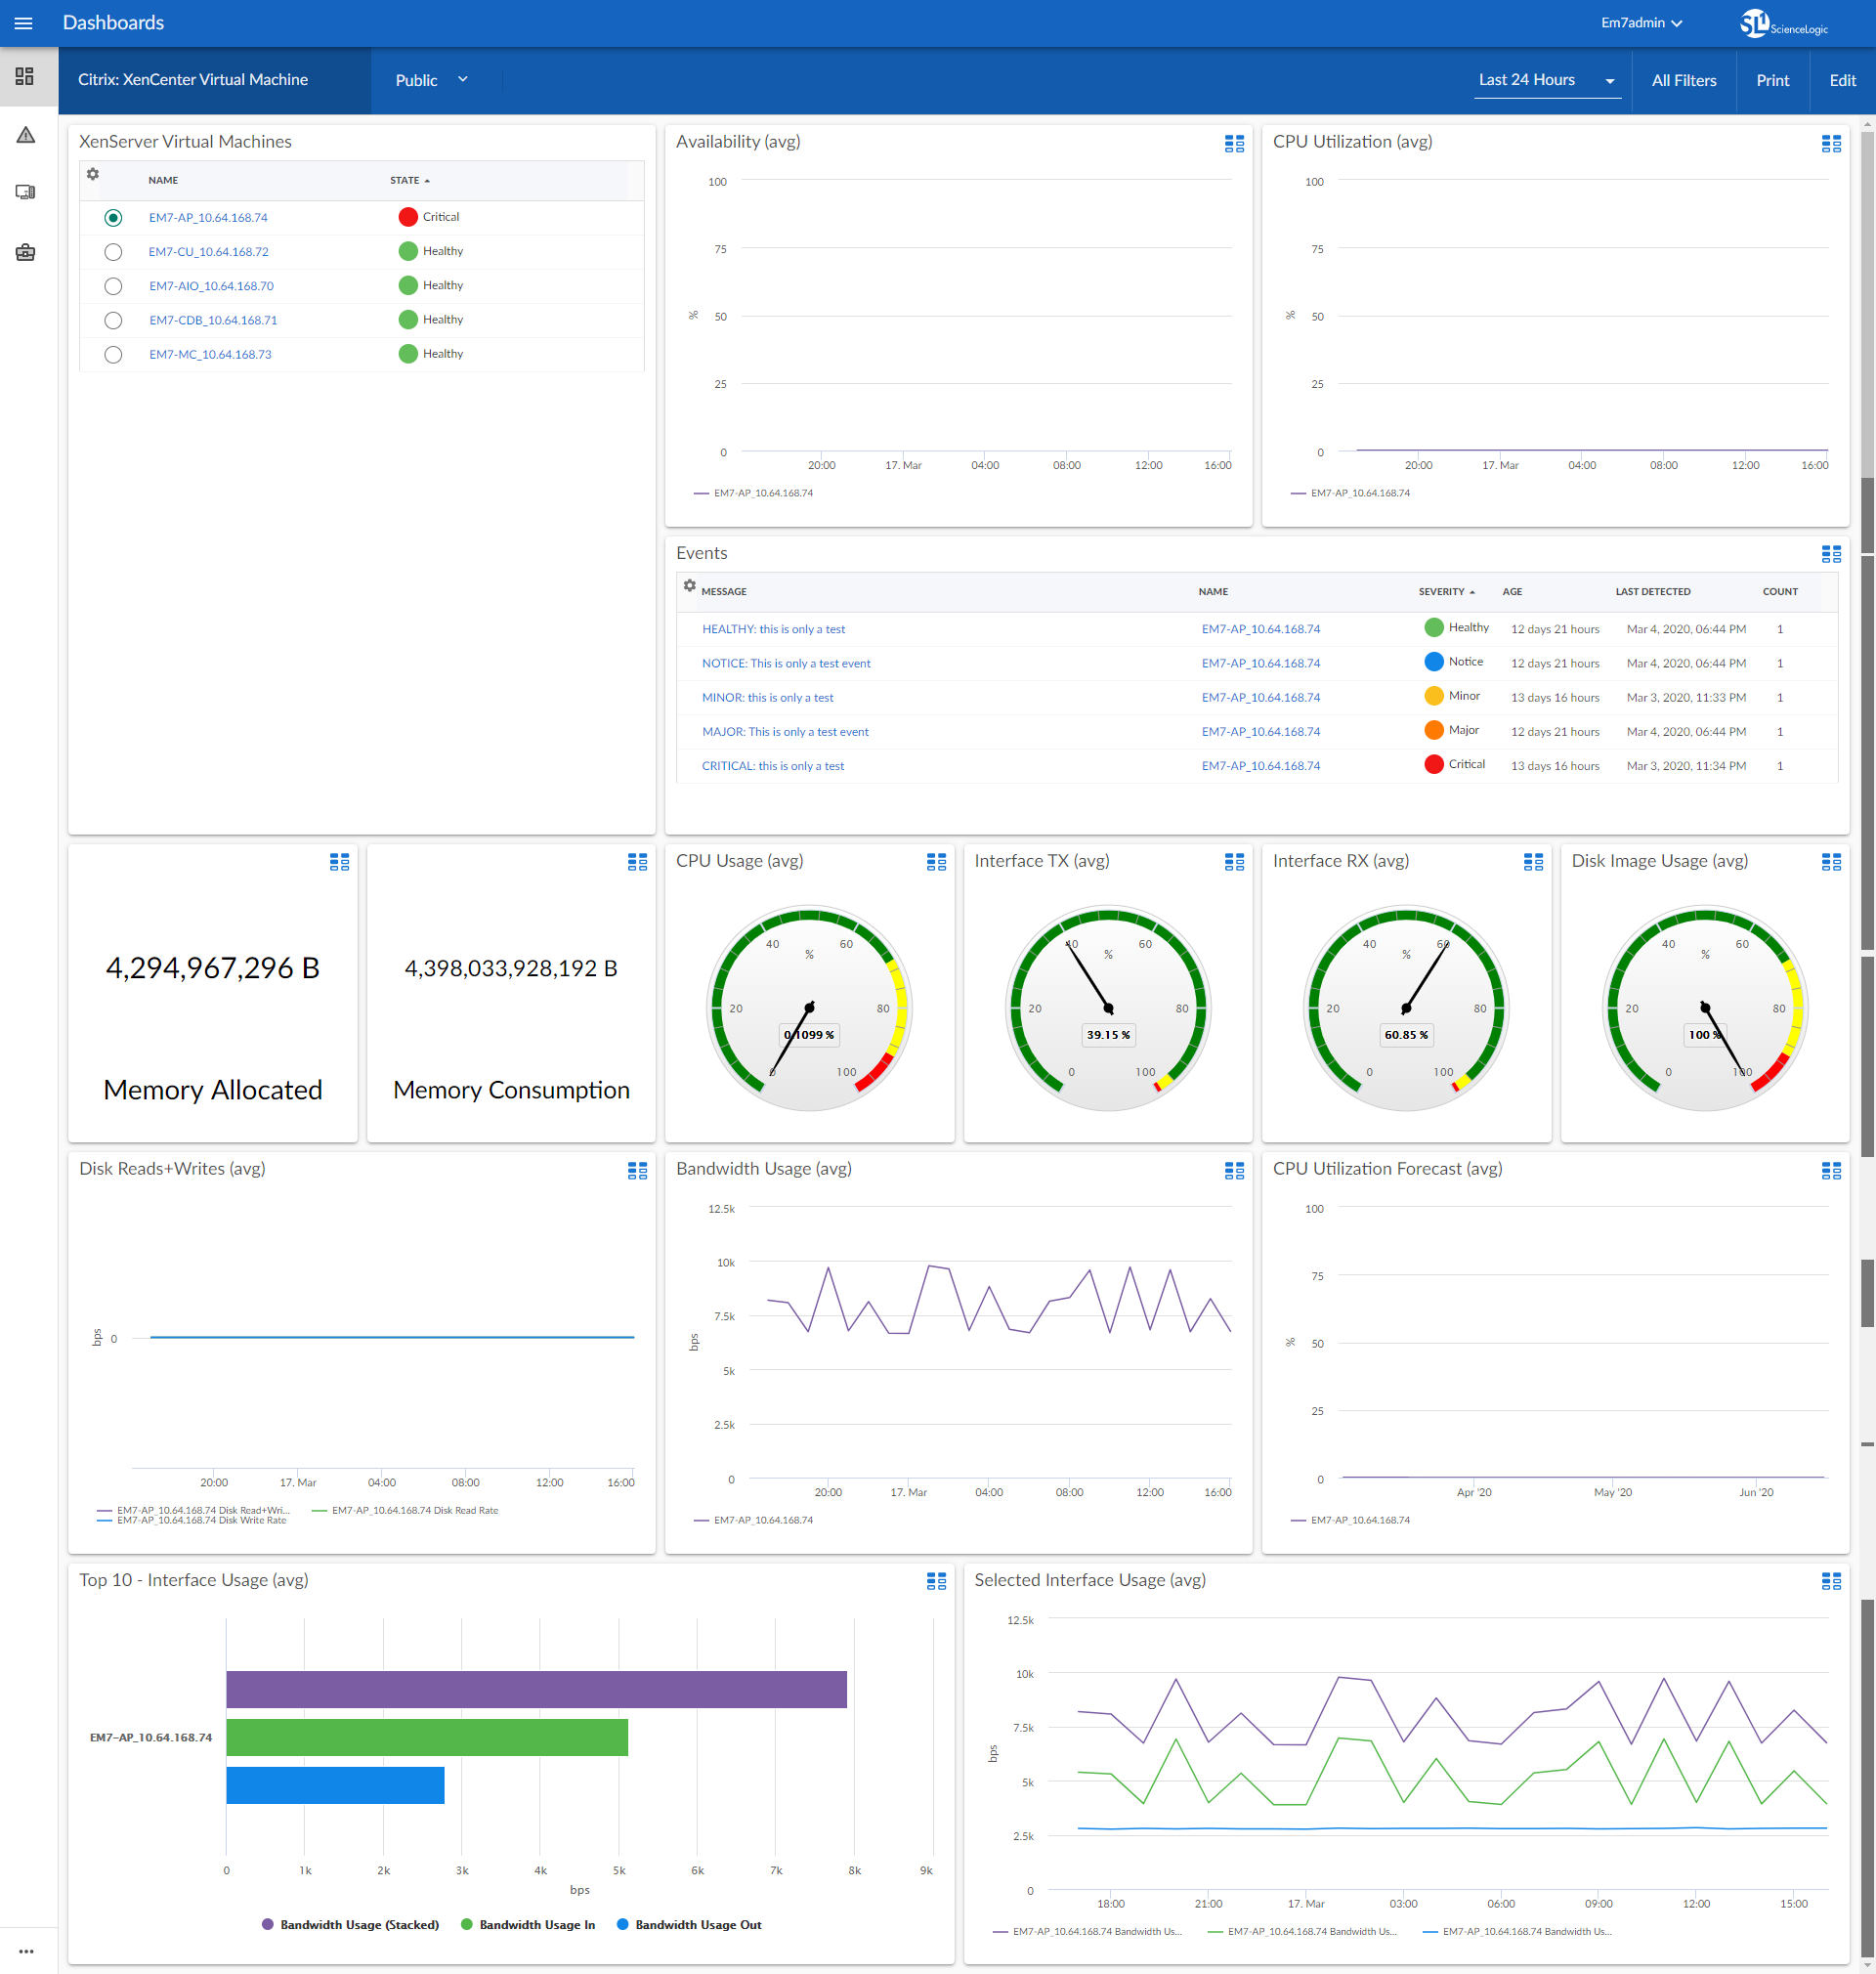
- A "Citrix: XenCenter Virtual Machine" dashboard, which includes the following widgets that display data about your virtual machines:
- XenServer Virtual Machines
- Availability (avg)
- CPU Utilization (avg)
- Events
- Memory Allocated
- Memory Consumption
- CPU Usage (avg)
- Interface TX (avg)
- Interface RX (avg)
- Disk Image Usage (avg)
- Disk Reads+Writes (avg)
- Bandwidth Usage (avg)
- CPU Utilization Forecast (avg)
- Top 10 - Interface Usage (avg)
- Selected Interface Usage (avg)
Known Issues
Version 102 of the Citrix: Xen SL1 Dashboards PowerPack has no known issues.