![]()
Version 102 of the Dynatrace: SL1 Dashboards PowerPack includes autoselect for context-driving widgets and the addition of the event and forecast widgets.
NOTE: These dashboards are intended for use only in the new SL1 user interface and will not load in the classic ScienceLogic platform user interface.
- Minimum Required SL1 Version: 8.12.1
- Minimum Required AP2 Version: 5.125.44
- Minimum Required Widget Components Version: 2.175.0
- Minimum Required Dynatrace PowerPack Version: 101
Before You Install or Upgrade
Before installing Dynatrace: SL1 Dashboards PowerPack version 102, you must first ensure that you are running version 8.12.1 or later of SL1.
NOTE: For details on upgrading SL1, see the appropriate Release Notes.
You must also import and install theDynatracePowerPack version 101 or later before installing the PowerPack.
Installation or Upgrade Process
To install this PowerPack:
- Familiarize yourself with the Known Issues for this release.
- See the Before You Install or Upgrade section. If you have not done so already, upgrade your system to the 8.12.1 or later release.
- Download the "Dynatrace: SL1 Dashboards" version 102PowerPack from the Support Site to a local computer.
- Go to the PowerPack Manager page (System > Manage > PowerPacks). Click the menu and choose Import PowerPack. When prompted, import "Dynatrace: SL1 Dashboards" version 102.
- Click the button. For details on installing PowerPacks, see the chapter on Installing a PowerPack in the PowerPacks manual.
Features
The following dashboards are included in version 102 of the Dynatrace: SL1 Dashboards PowerPack:
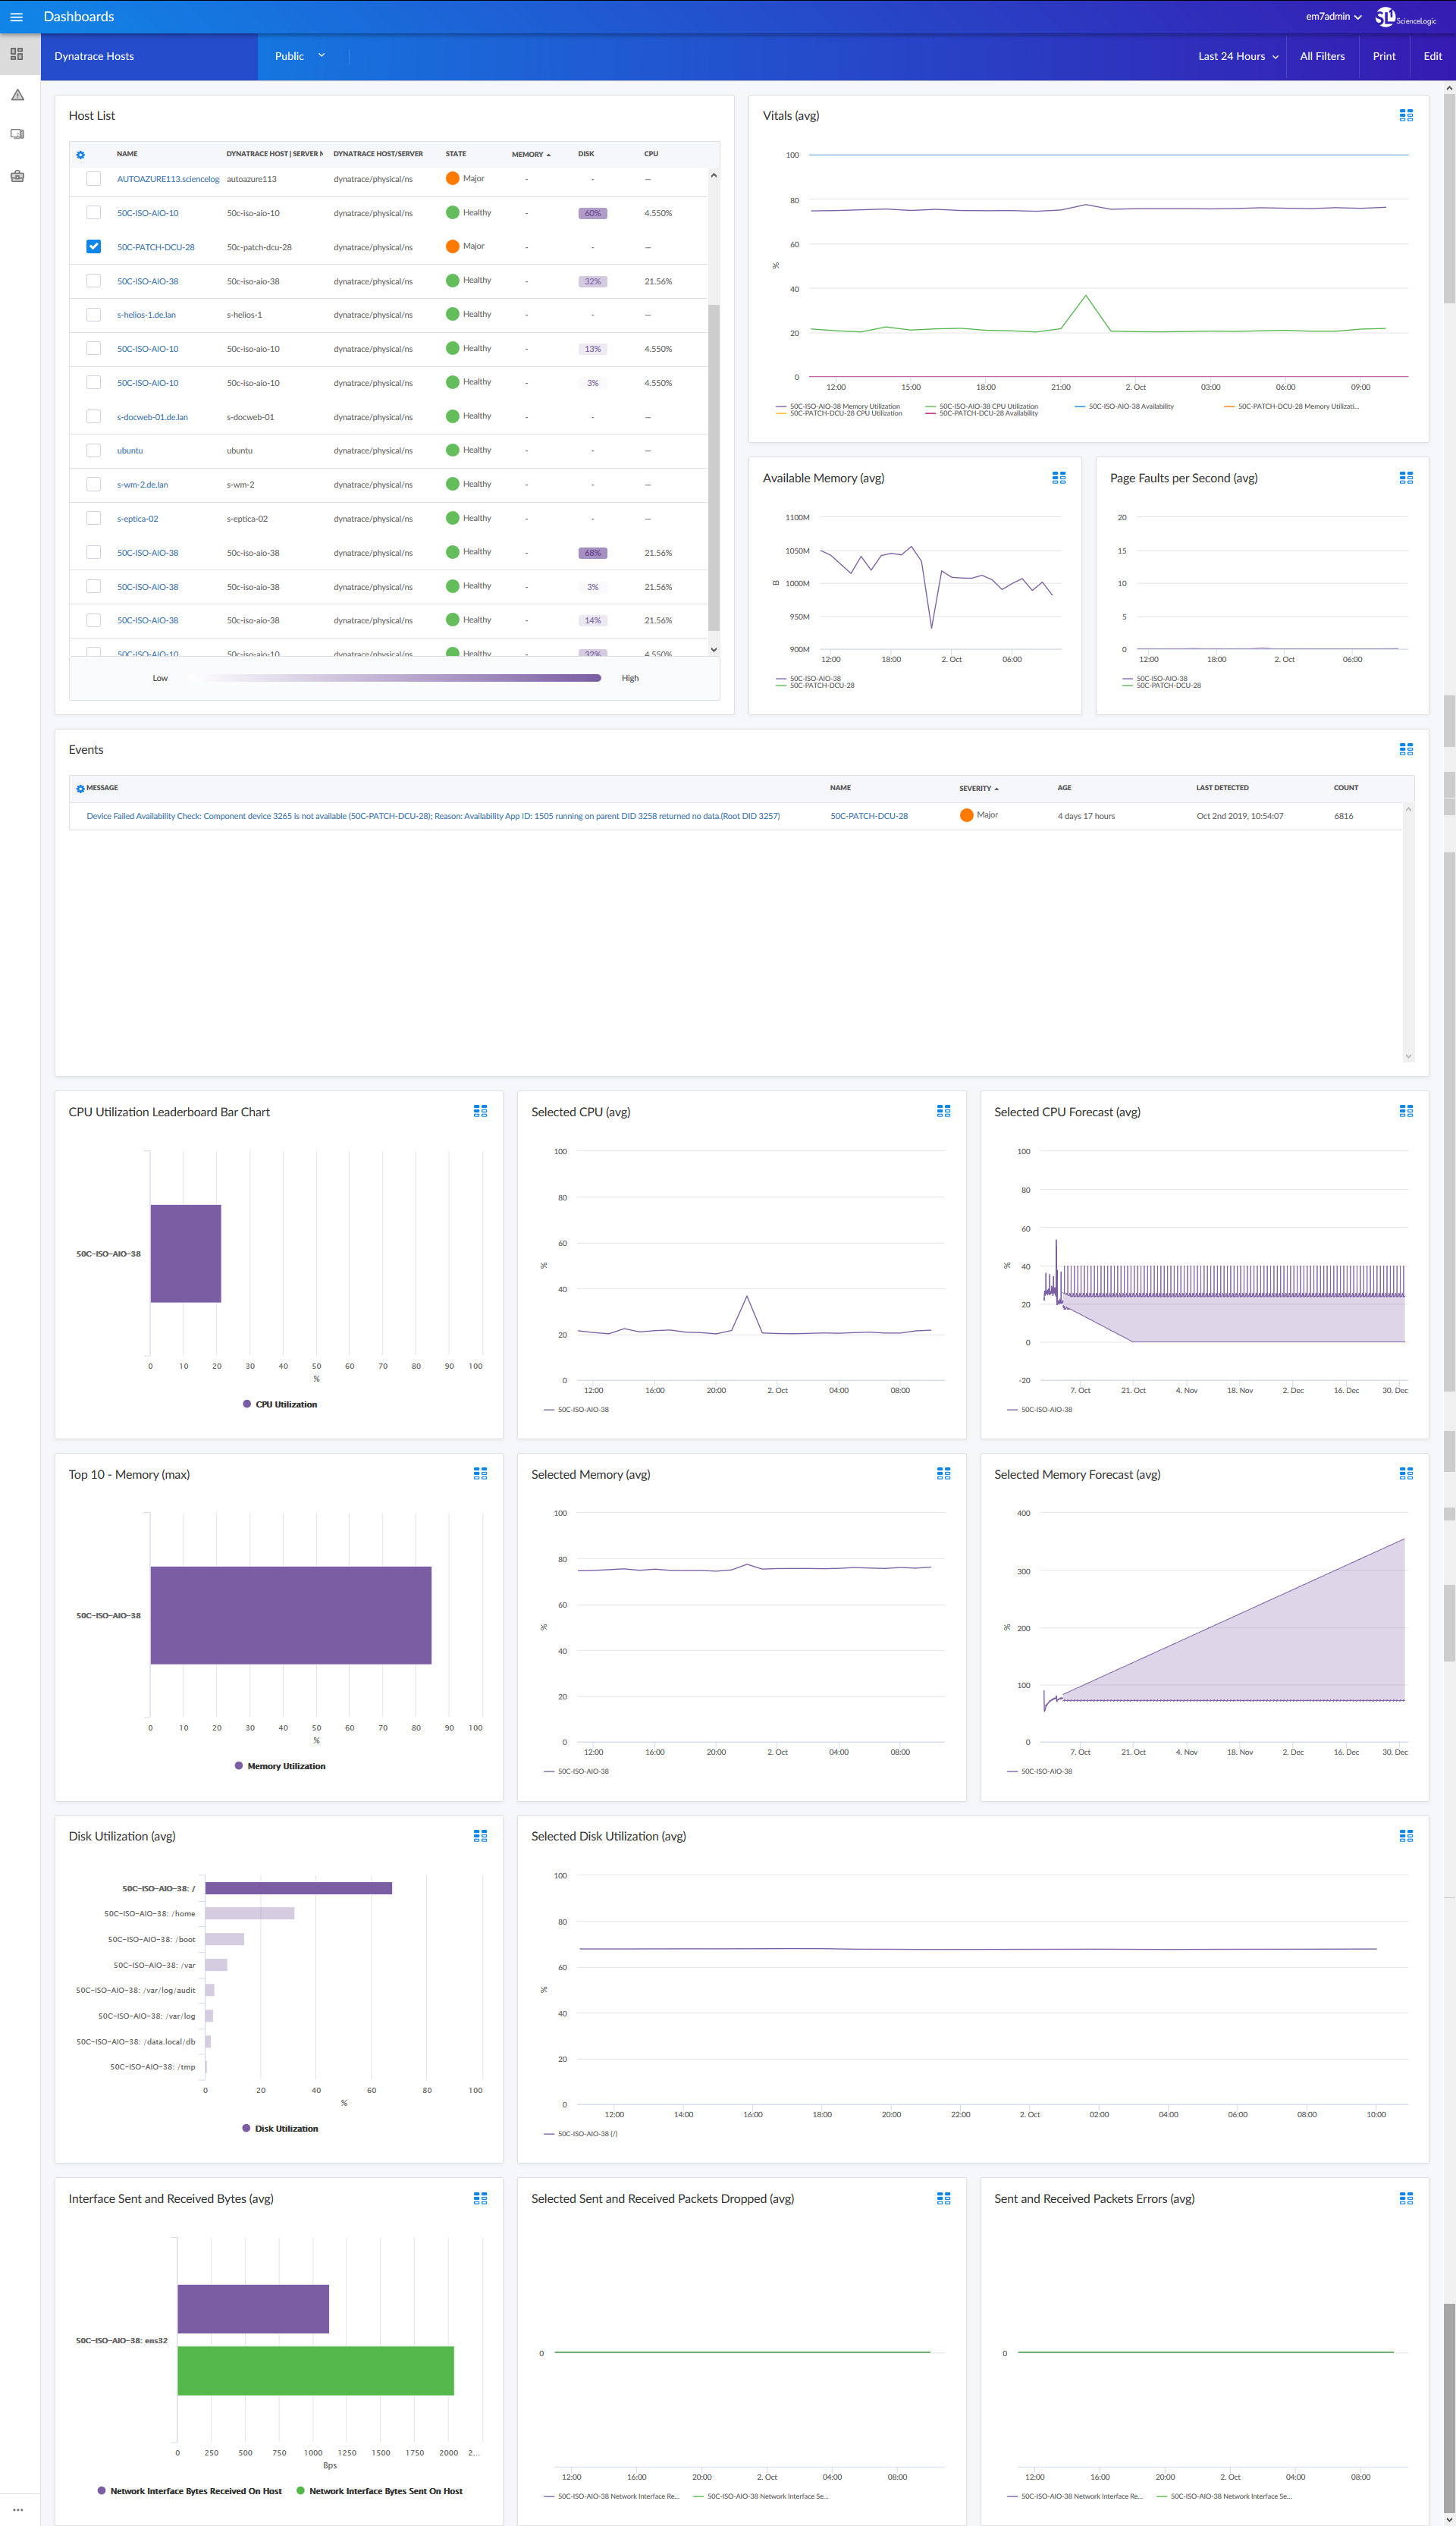
- A "Dynatrace Hosts" dashboard, which includes the following widgets that display overview data about your Dynatrace hosts:
- Host List
- Vitals (avg)
- Available Memory (avg)
- Page Faults per Second (avg)
- Events
- CPU Utilization Leaderboard Bar Chart
- Selected CPU (avg)
- Selected CPU Forecast (avg)
- Top 10 - Memory (max)
- Selected Memory (avg)
- Selected Memory Forecast (avg)
- Disk Utilization (avg)
- Selected Disk Utilization (avg)
- Interface Sent and Received Bytes (avg)
- Selected Sent and Received Packets Dropped (avg)
- Sent and Received Packets Errors (avg)
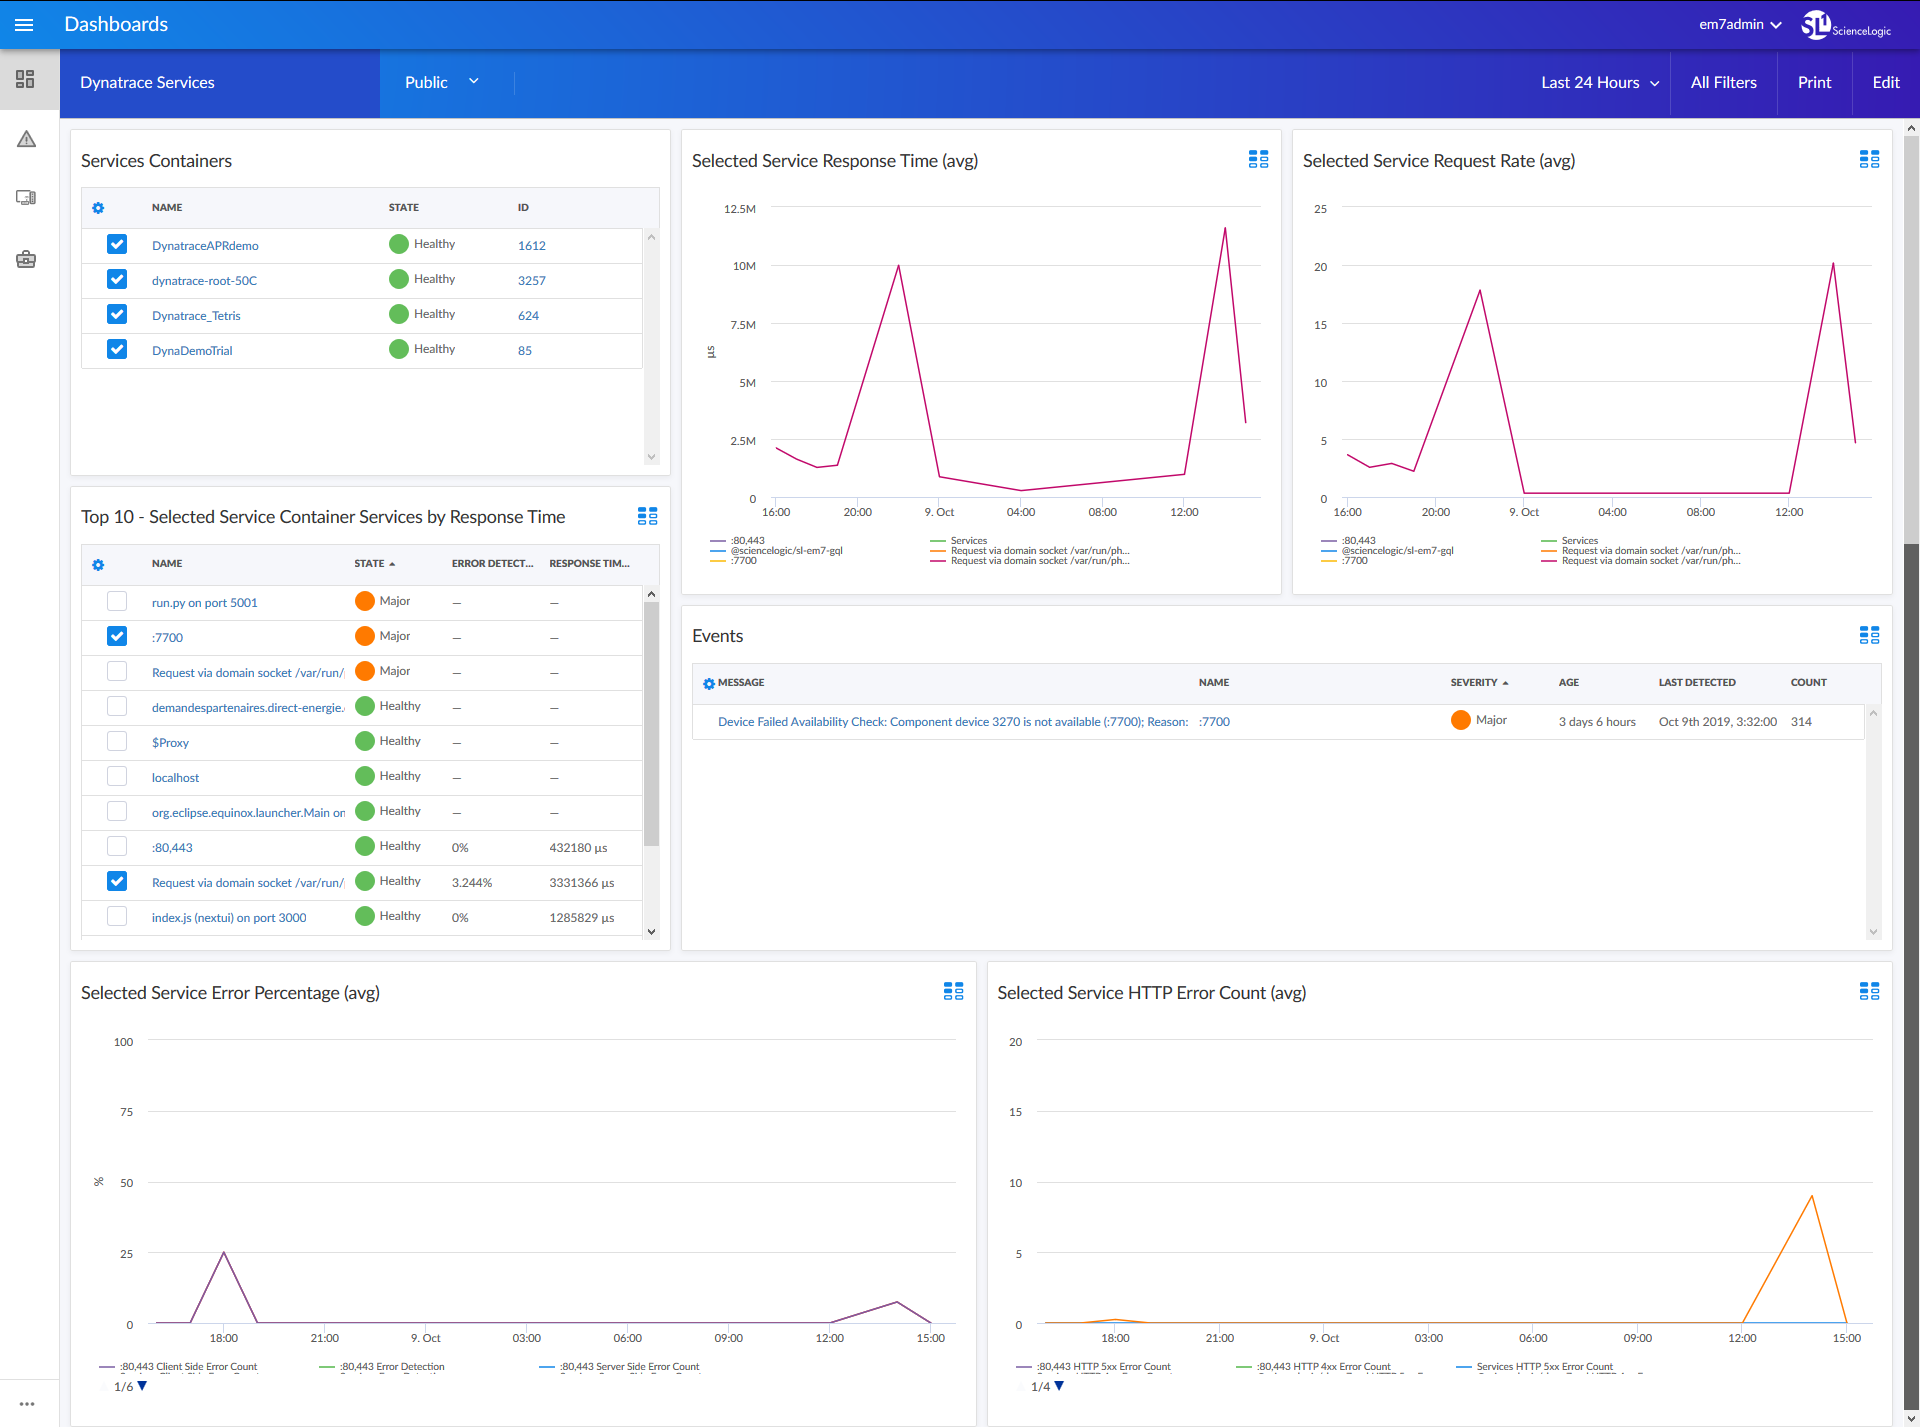
- A "Dynatrace Services" dashboard, which includes the following widgets that display data about your Dynatrace services:
- Services Containers
- Selected Service Response Time (avg)
- Selected Service Request Rate (avg)
- Top 10 - Selected Service Container Services by Response Time
- Events
- Selected Service Error Percentage (avg)
- Selected Service HTTP Error Count (avg)
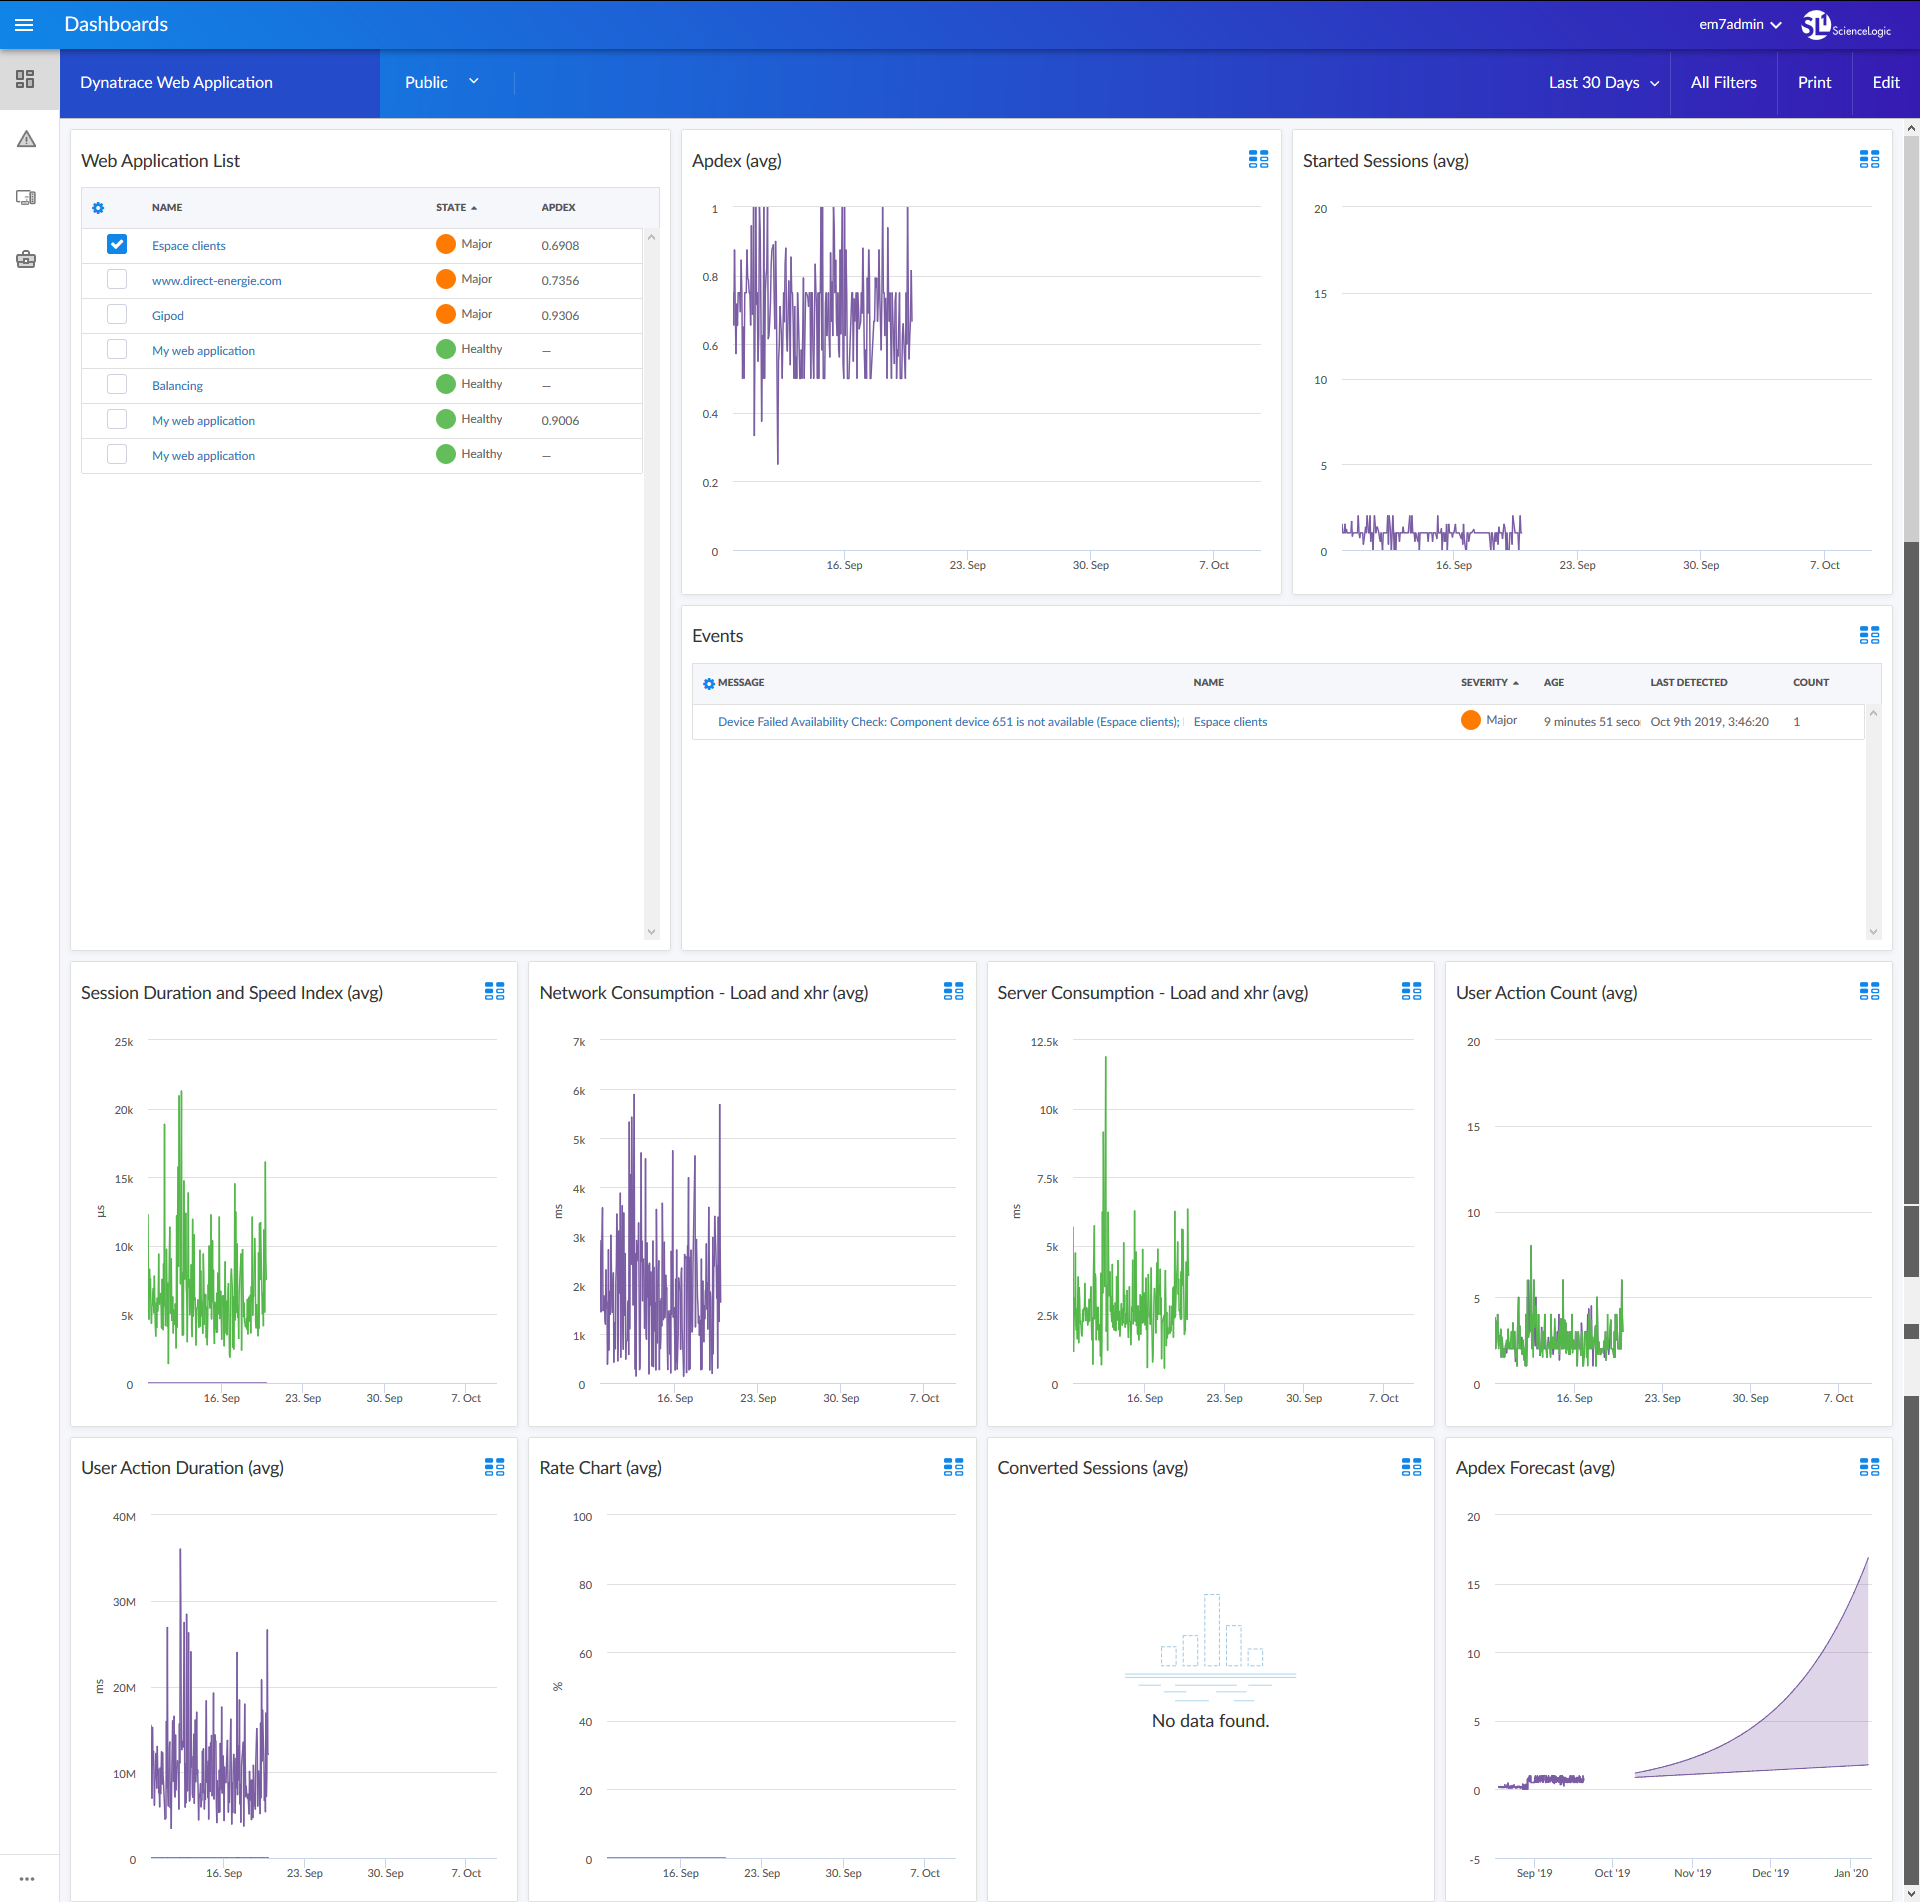
- A "Dynatrace Web Application" dashboard, which includes the following widgets that display data about your Dynatrace web applications:
- Web Application List
- Application Performance Index (Apdex) (avg)
- Started Sessions (avg)
- Events
- Session Duration and Speed Index (avg)
- Network Consumption - Load and XMLHttpRequest (xhr) (avg)
- Server Consumption - Load and xhr (avg)
- User Action Count (avg)
- User Action Duration (avg)
- Rate Chart (avg)
- Converted Sessions (avg)
- Apdex Forecast (avg)
Enhancements and Issues Addressed
The following enhancements and addressed issues are included in version 102 of the Dynatrace: SL1 Dashboards PowerPack:
- Autoselect for context-driving widgets has been enabled in all dashboards.
- The following widgets were added to the "Dynatrace Hosts" dashboard:
- Vitals (avg)
- Events
- CPU Utilization Leaderboard Bar Chart
- Selected CPU (avg)
- Selected CPU Forecast (avg)
- Top 10 - Memory (max)
- Selected Memory (avg)
- Selected Memory Forecast (avg)
- The Events widget was added to the "Dynatrace Services" dashboard:
- The Events and Apdex Forecast widgets were added to the "Dynatrace Web Application" dashboard.
Known Issues
Version 102 of the Dynatrace: SL1 Dashboards PowerPack has no known issues.