![]()
Version 100 of the IBM WebSphere SL1 Dashboards PowerPack is the initial version of the PowerPack. The PowerPack includes a Dashboard and a Device Investigator that present graphical representations of the configuration data and performance metrics that are collected for IBM WebSphere devices by the IBM WebSpherePowerPack.
NOTE: These dashboards are intended for use only in the new SL1 user interface and will not load in the classic ScienceLogic platform user interface.
- Minimum Required SL1 Version: 10.2
- Minimum Required AP2 Version: 6.12.62
- Minimum Required Widget Components Version: 2.220.8
- Minimum Required WebSpherePowerPack Version: 100
Before You Install
Before installing IBM WebSphere SL1 Dashboards PowerPack version 100, you must first ensure that you are running version 10.2 or later of SL1.
NOTE: For details on upgrading SL1, see the appropriate Release Notes.
You must also import and install theWebSpherePowerPack version 100 or later before installing the PowerPack.
Installation Process
To install this PowerPack:
- Familiarize yourself with the Known Issues for this release.
- See the Before You Install or Upgrade section. If you have not done so already, upgrade your system to the 10.2 or later release.
- Download the "IBM WebSphere SL1 Dashboards" version 100PowerPack from the Support Site to a local computer.
- Go to the PowerPack Manager page (System > Manage > PowerPacks). Click the menu and choose Import PowerPack. When prompted, import "IBM WebSphere SL1 Dashboards" version 100.
- Click the button. For details on installing PowerPacks, see the chapter on Installing a PowerPack in the PowerPacks manual.
Features
The following dashboards are included in version 100 of the IBM WebSphere SL1 Dashboards PowerPack:
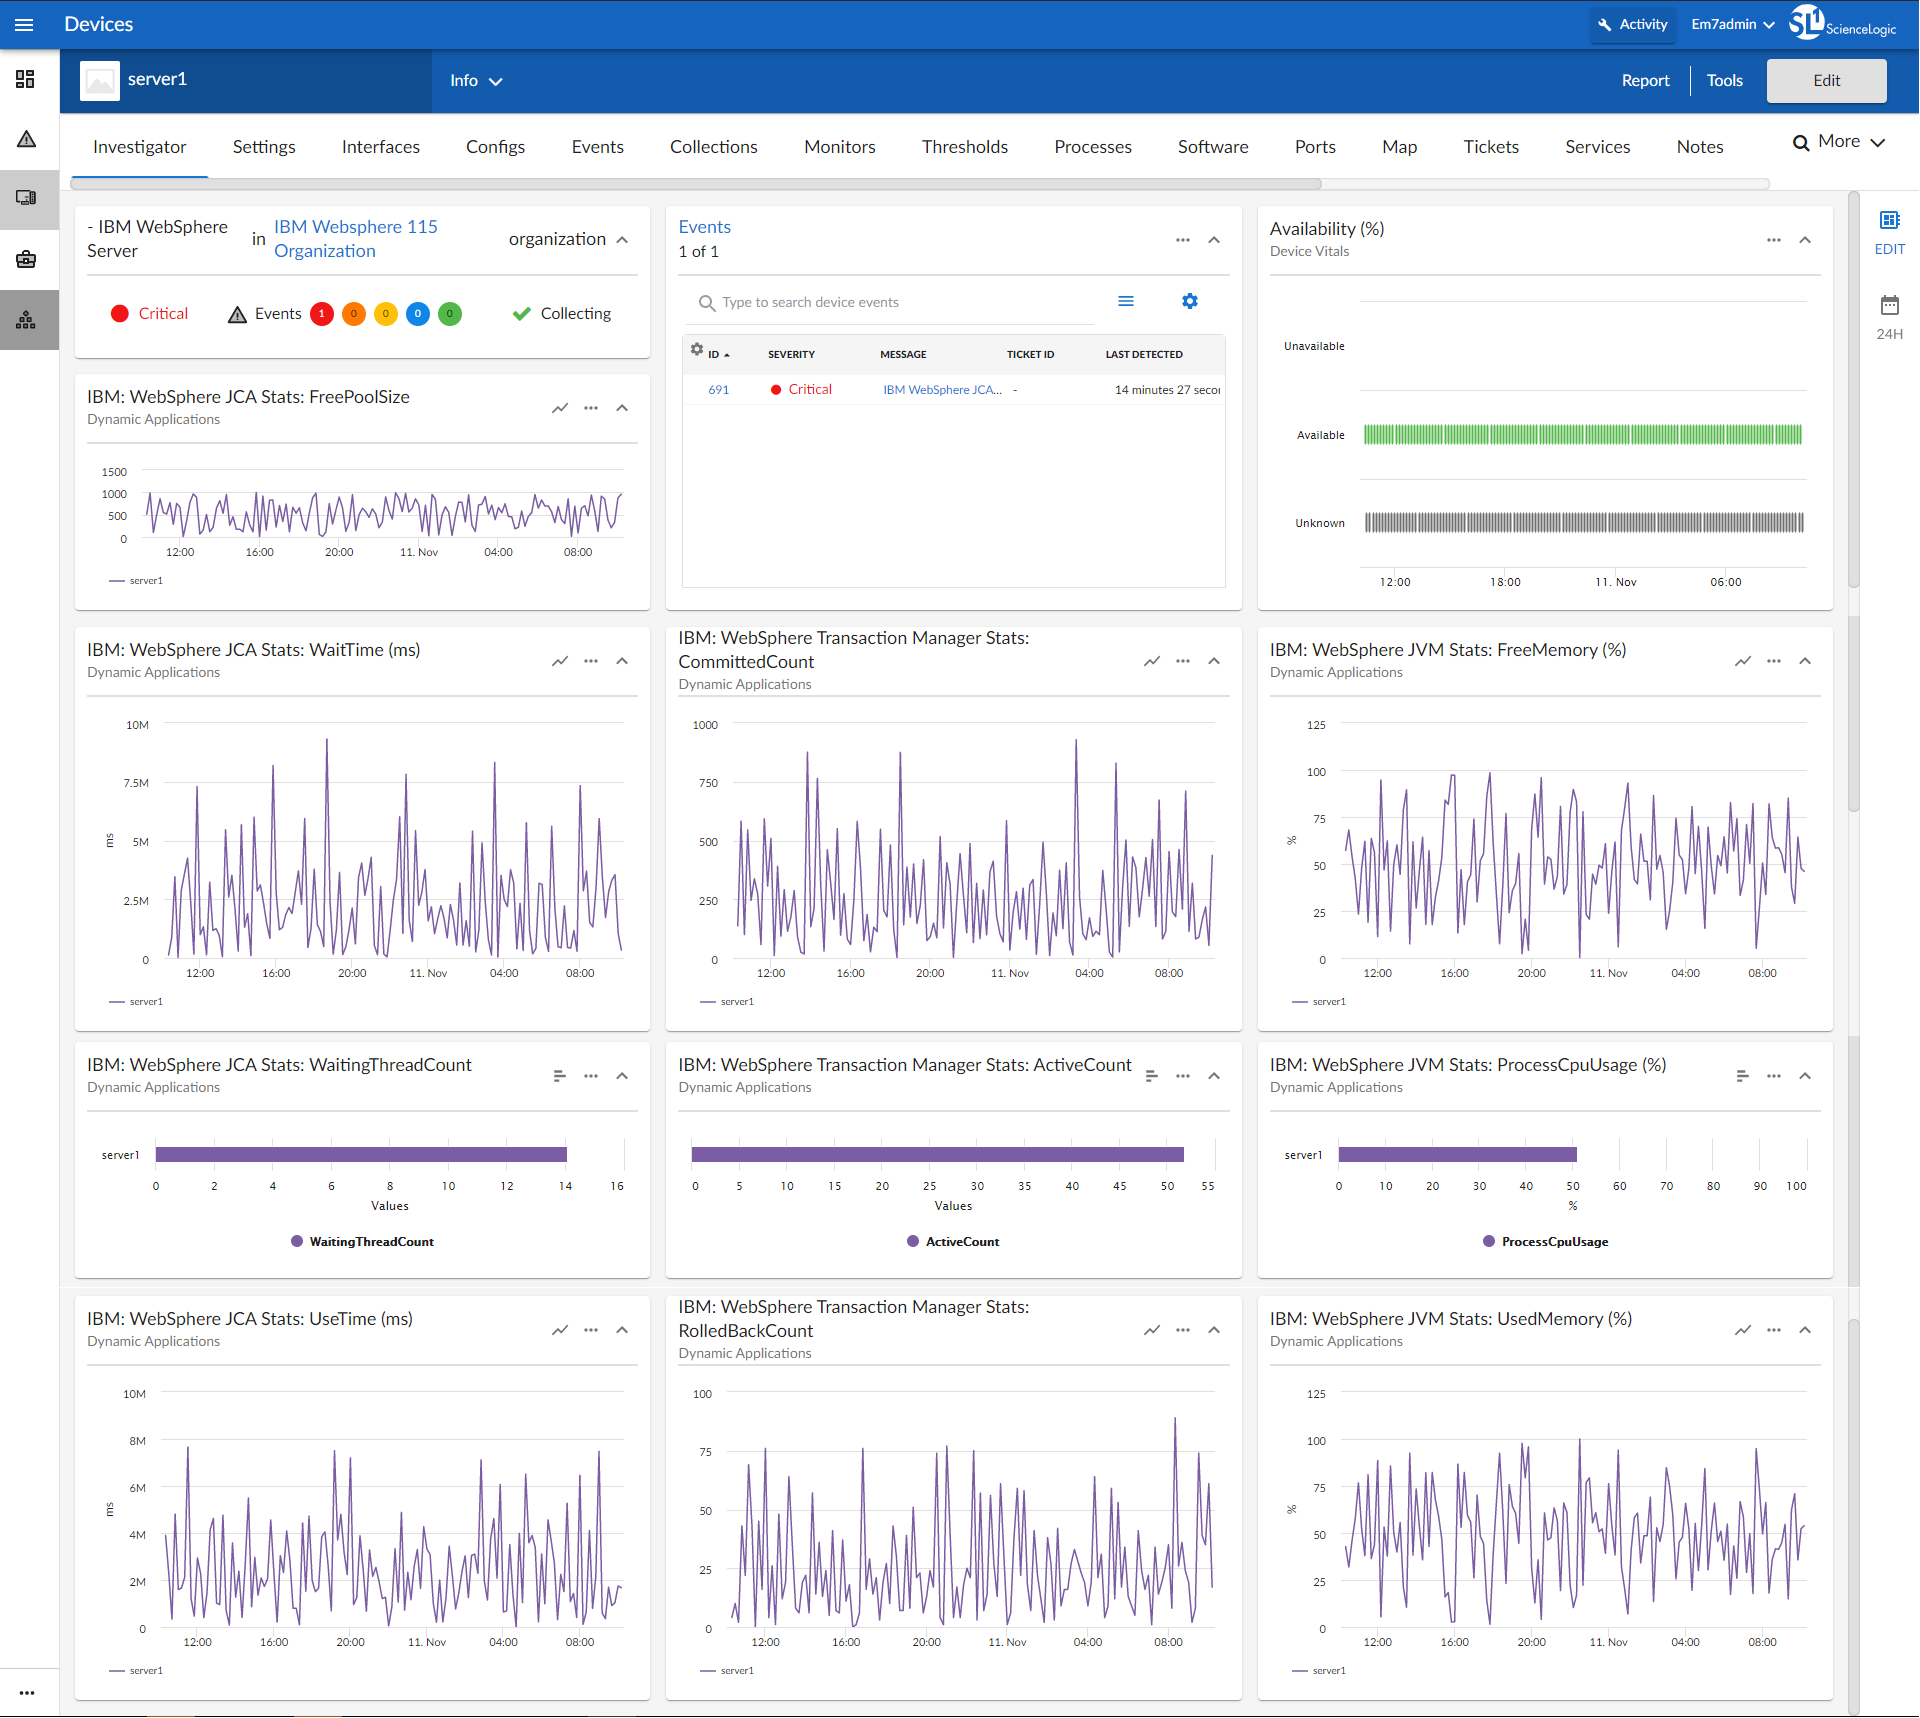
- An "IBM WebSphere Server" device investigator, which includes the following panels that display data about your selected IBM WebSphere server:
- Overview
- IBM: WebSphere JCA Stats: FreePoolSize
- Events
- Availability (%)
- IBM: WebSphere JCA Stats: WaitTime (ms)
- IBM: WebSphere Transaction Manager Stats: CommittedCount
- IBM: WebSphere JVM Stats: FreeMemory (%)
- IBM: WebSphere JCA Stats: WaitingThreadCount
- IBM: WebSphere Transaction Manager Stats: ActiveCount
- IBM: WebSphere JVM Stats: ProcessCpuUsage (%)
- IBM: WebSphere JCA Stats: UseTime (ms)
- IBM: WebSphere Transaction Manager Stats: RolledBackCount
- IBM: WebSphere JVM Stats: UsedMemory (%)
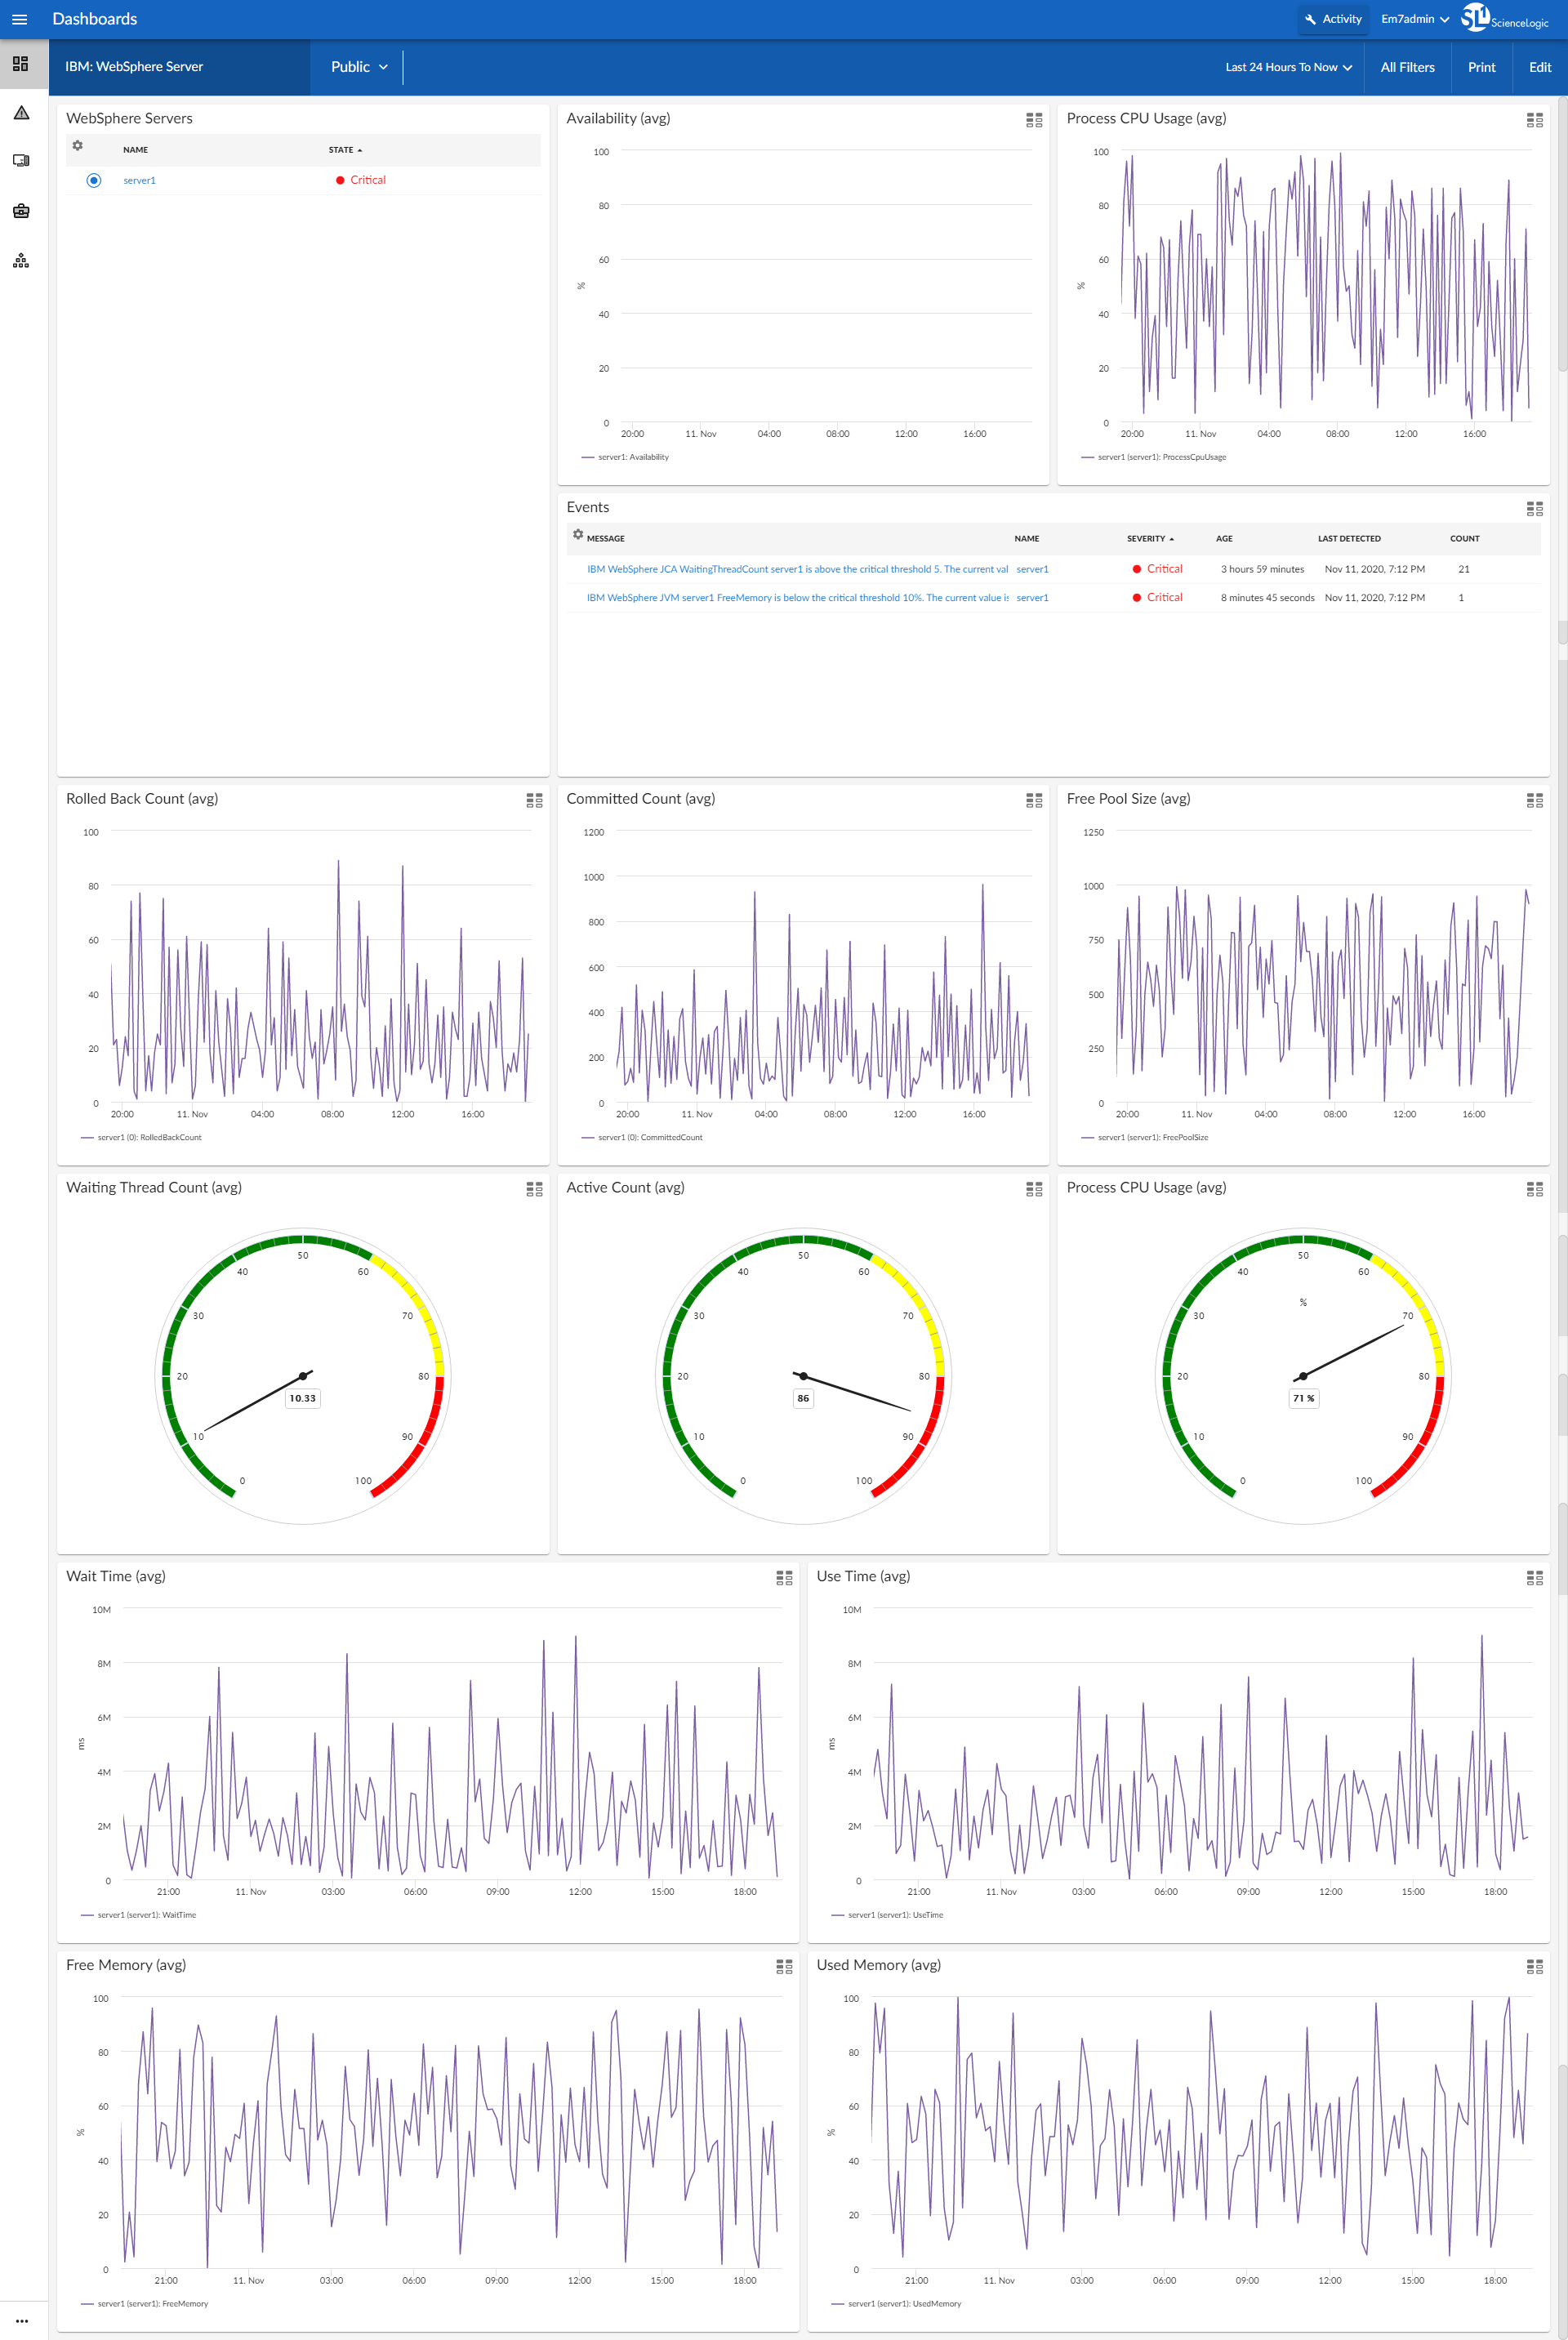
- An "IBM WebSphere Server" dashboard, which includes the following widgets that display data about your IBM WebSphere servers:
- WebSphere Servers
- Availability (avg)
- Process CPU Usage (avg)
- Events
- Rolled Back Count (avg)
- Committed Count (avg)
- Free Pool Size (avg)
- Waiting Thread Count (avg)
- Active Count (avg)
- Process CPU Usage (avg)
- Wait Time (avg)
- Use Time (avg)
- Free Memory (avg)
- Used Memory (avg)
Known Issues
Version 100 of the IBM WebSphere SL1 Dashboards PowerPack has no known issues.