![]()
Version 102 of the Kubernetes: SL1 Dashboards PowerPack includes autoselect for context-driving widgets and the addition of forecast widgets.
NOTE: These dashboards are intended for use only in the new SL1 user interface and will not load in the classic ScienceLogic platform user interface.
- Minimum Required SL1 Version: 8.12.1
- Minimum Required AP2 Version: 5.125.44
- Minimum Required Widget Components Version: 2.175.0
- Minimum Required Kubernetes PowerPack Version: 100
Before You Install or Upgrade
Before installing Kubernetes: SL1 Dashboards PowerPack version 102, you must first ensure that you are running version 8.12.1 or later of SL1.
NOTE: For details on upgrading SL1, see the appropriate Release Notes.
You must also import and install theIBM: SVCPowerPack version 100 or later before installing the PowerPack.
Installation or Upgrade Process
To install this PowerPack:
- Familiarize yourself with the Known Issues for this release.
- See the Before You Install or Upgrade section. If you have not done so already, upgrade your system to the 8.12.1 or later release.
- Download the "Kubernetes: SL1 Dashboards" version 102PowerPack from the Support Site to a local computer.
- Go to the PowerPack Manager page (System > Manage > PowerPacks). Click the menu and choose Import PowerPack. When prompted, import "Kubernetes: SL1 Dashboards" version 102.
- Click the button. For details on installing PowerPacks, see the chapter on Installing a PowerPack in the PowerPacks manual.
Features
The following dashboards are included in version 102 of the Kubernetes: SL1 Dashboards PowerPack:

- A "Kubernetes: Cluster" dashboard, which includes the following widgets that display overview data about your Kubernetes clusters:
- Kubernetes Clusters
- Number of CPUs
- Number of Controllers
- Total Number of SL1 Devices
- Total Number of Nodes
- Number of PODS
- Total Ready Nodes
- POD Lifetime (avg)
- Events
- Top 10 - Host Nodes by CPU Utilization (avg)
- Selected Node CPU Utilization (avg)
- Selected Node CPU Utilization Forecast (avg)
- Top 10 - Host Nodes by Memory (avg)
- Selected Node Memory (avg)
- Selected Node Memory Forecast (avg)
- Top 10 - Host Nodes by Running Containers (avg)
- Selected Node Running/Stopped Containers (avg)
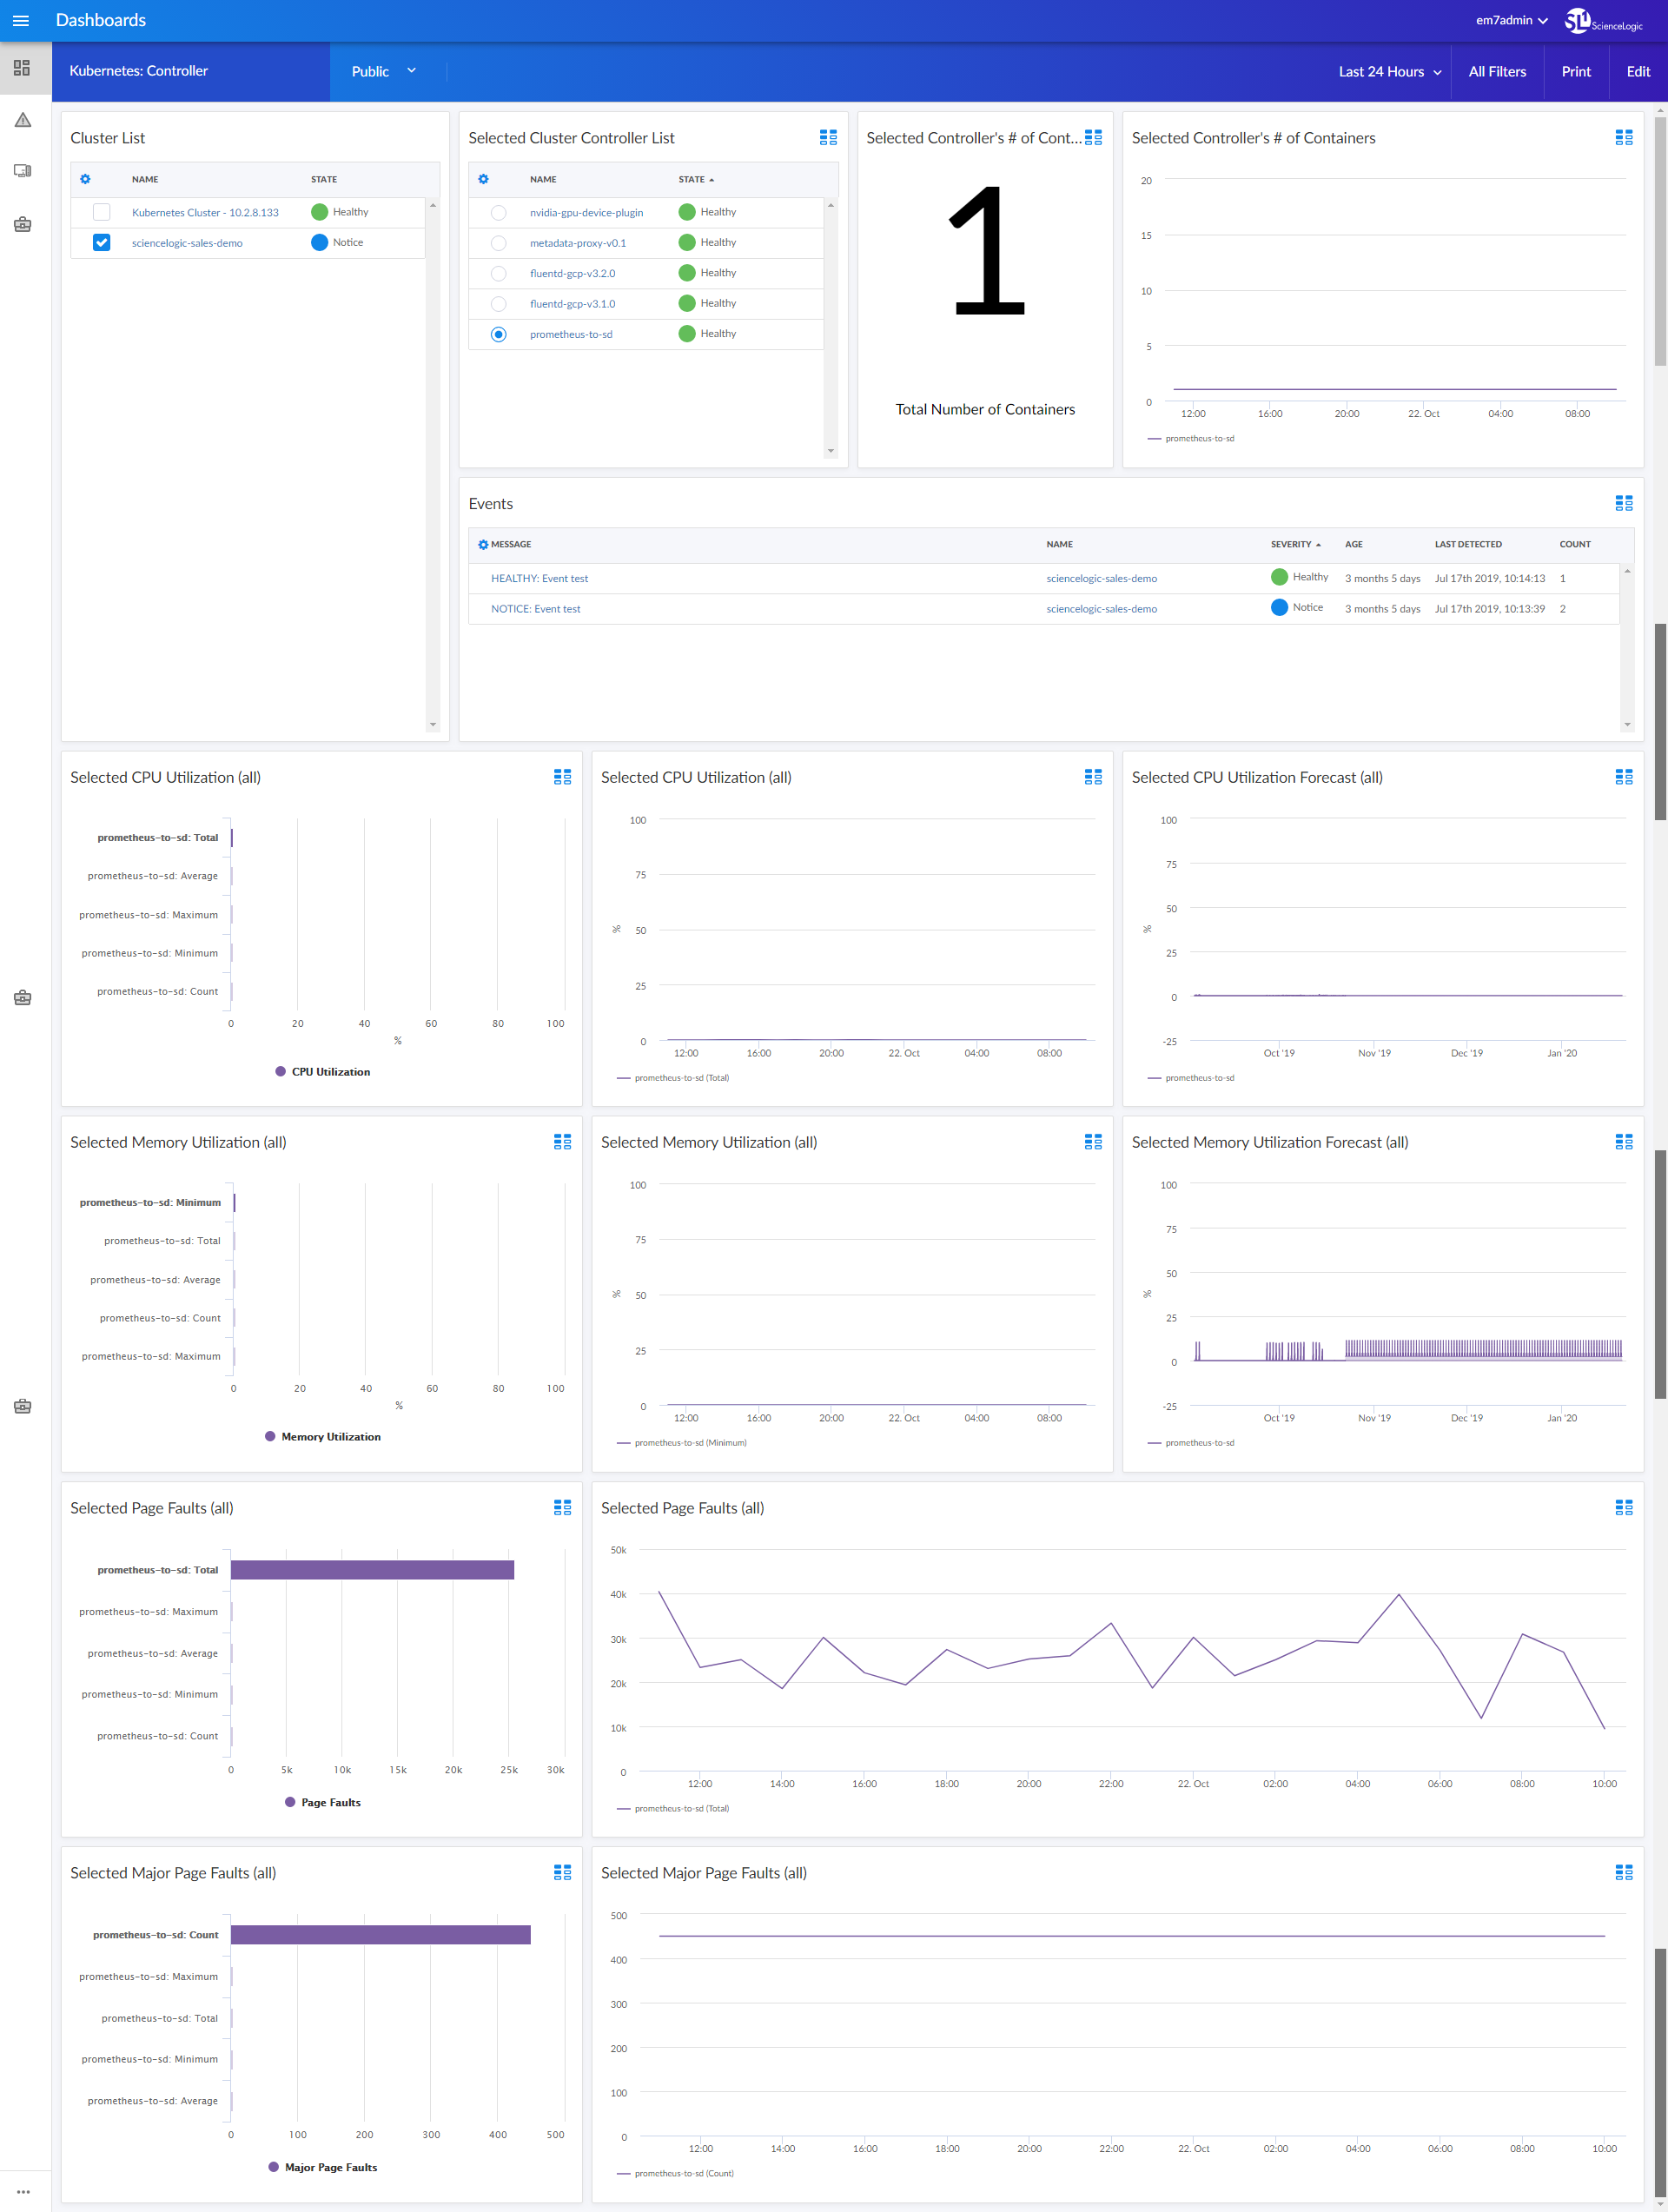
- A "Kubernetes: Controller" dashboard, which includes the following widgets that display data about your Kubernetes controllers:
- Cluster List
- Selected Cluster Controller List
- Selected Controller's Number of Containers (Big Number)
- Selected Controller's Number of Containers (Line Chart)
- Events
- Selected CPU Utilization (all)
- Selected CPU Utilization Forecast (all)
- Selected Memory Utilization (all)
- Selected Memory Utilization Forecast (all)
- Selected Page Faults (all)
- Selected Major Page Faults (all)
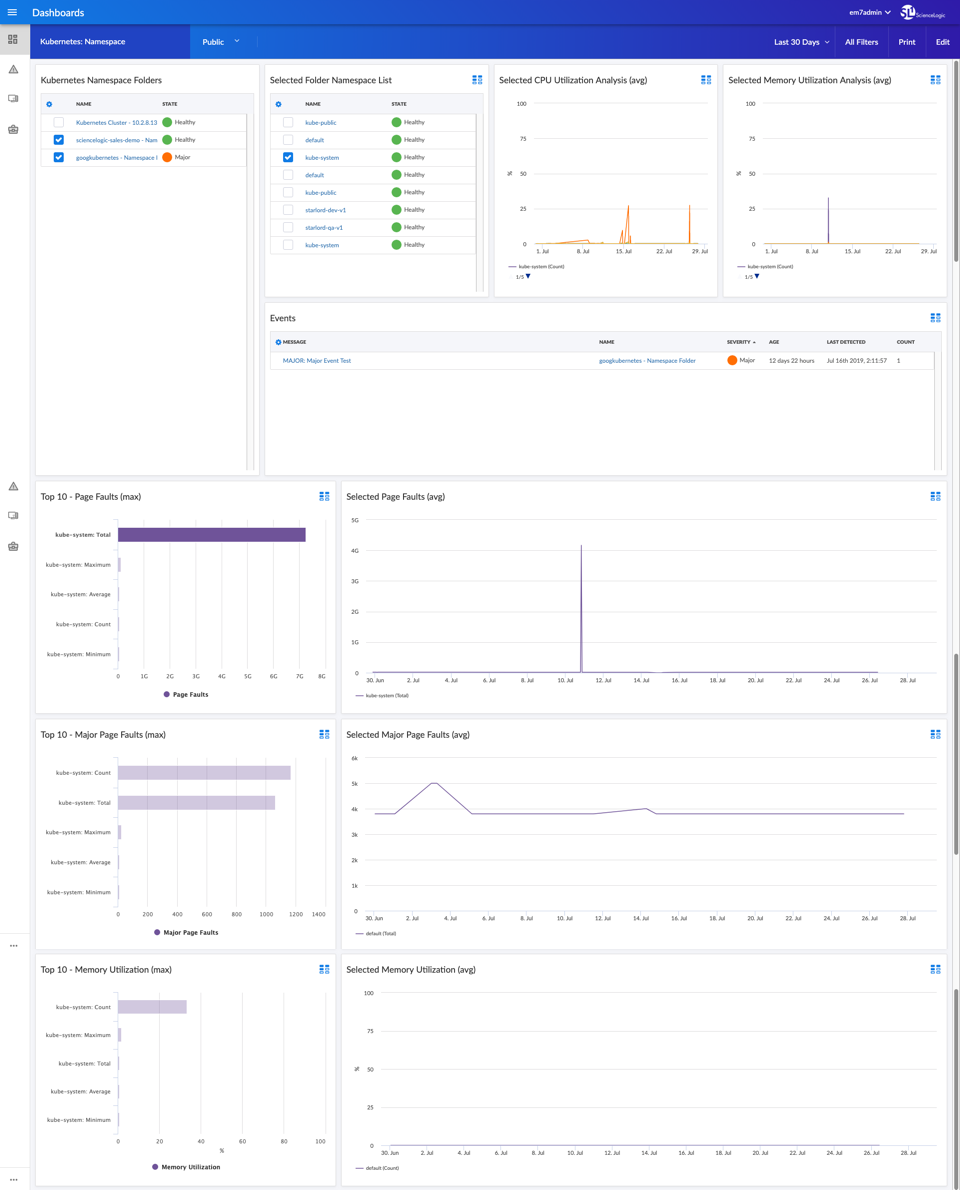
- A "Kubernetes: Namespace" dashboard, which includes the following widgets that display data about your Kubernetes namespaces:
- Kubernetes Namespace Folders
- Selected Folder Namespace List
- Selected CPU Utilization Analysis (avg)
- Selected Memory Utilization Analysis (avg)
- Events
- Top 10 - Page Faults (max)
- Selected Page Faults (avg)
- Top 10 - Major Page Faults (max)
- Selected Major Page Faults (avg)
- Top 10 - Memory Utilization (max)
- Selected Memory Utilization (avg)
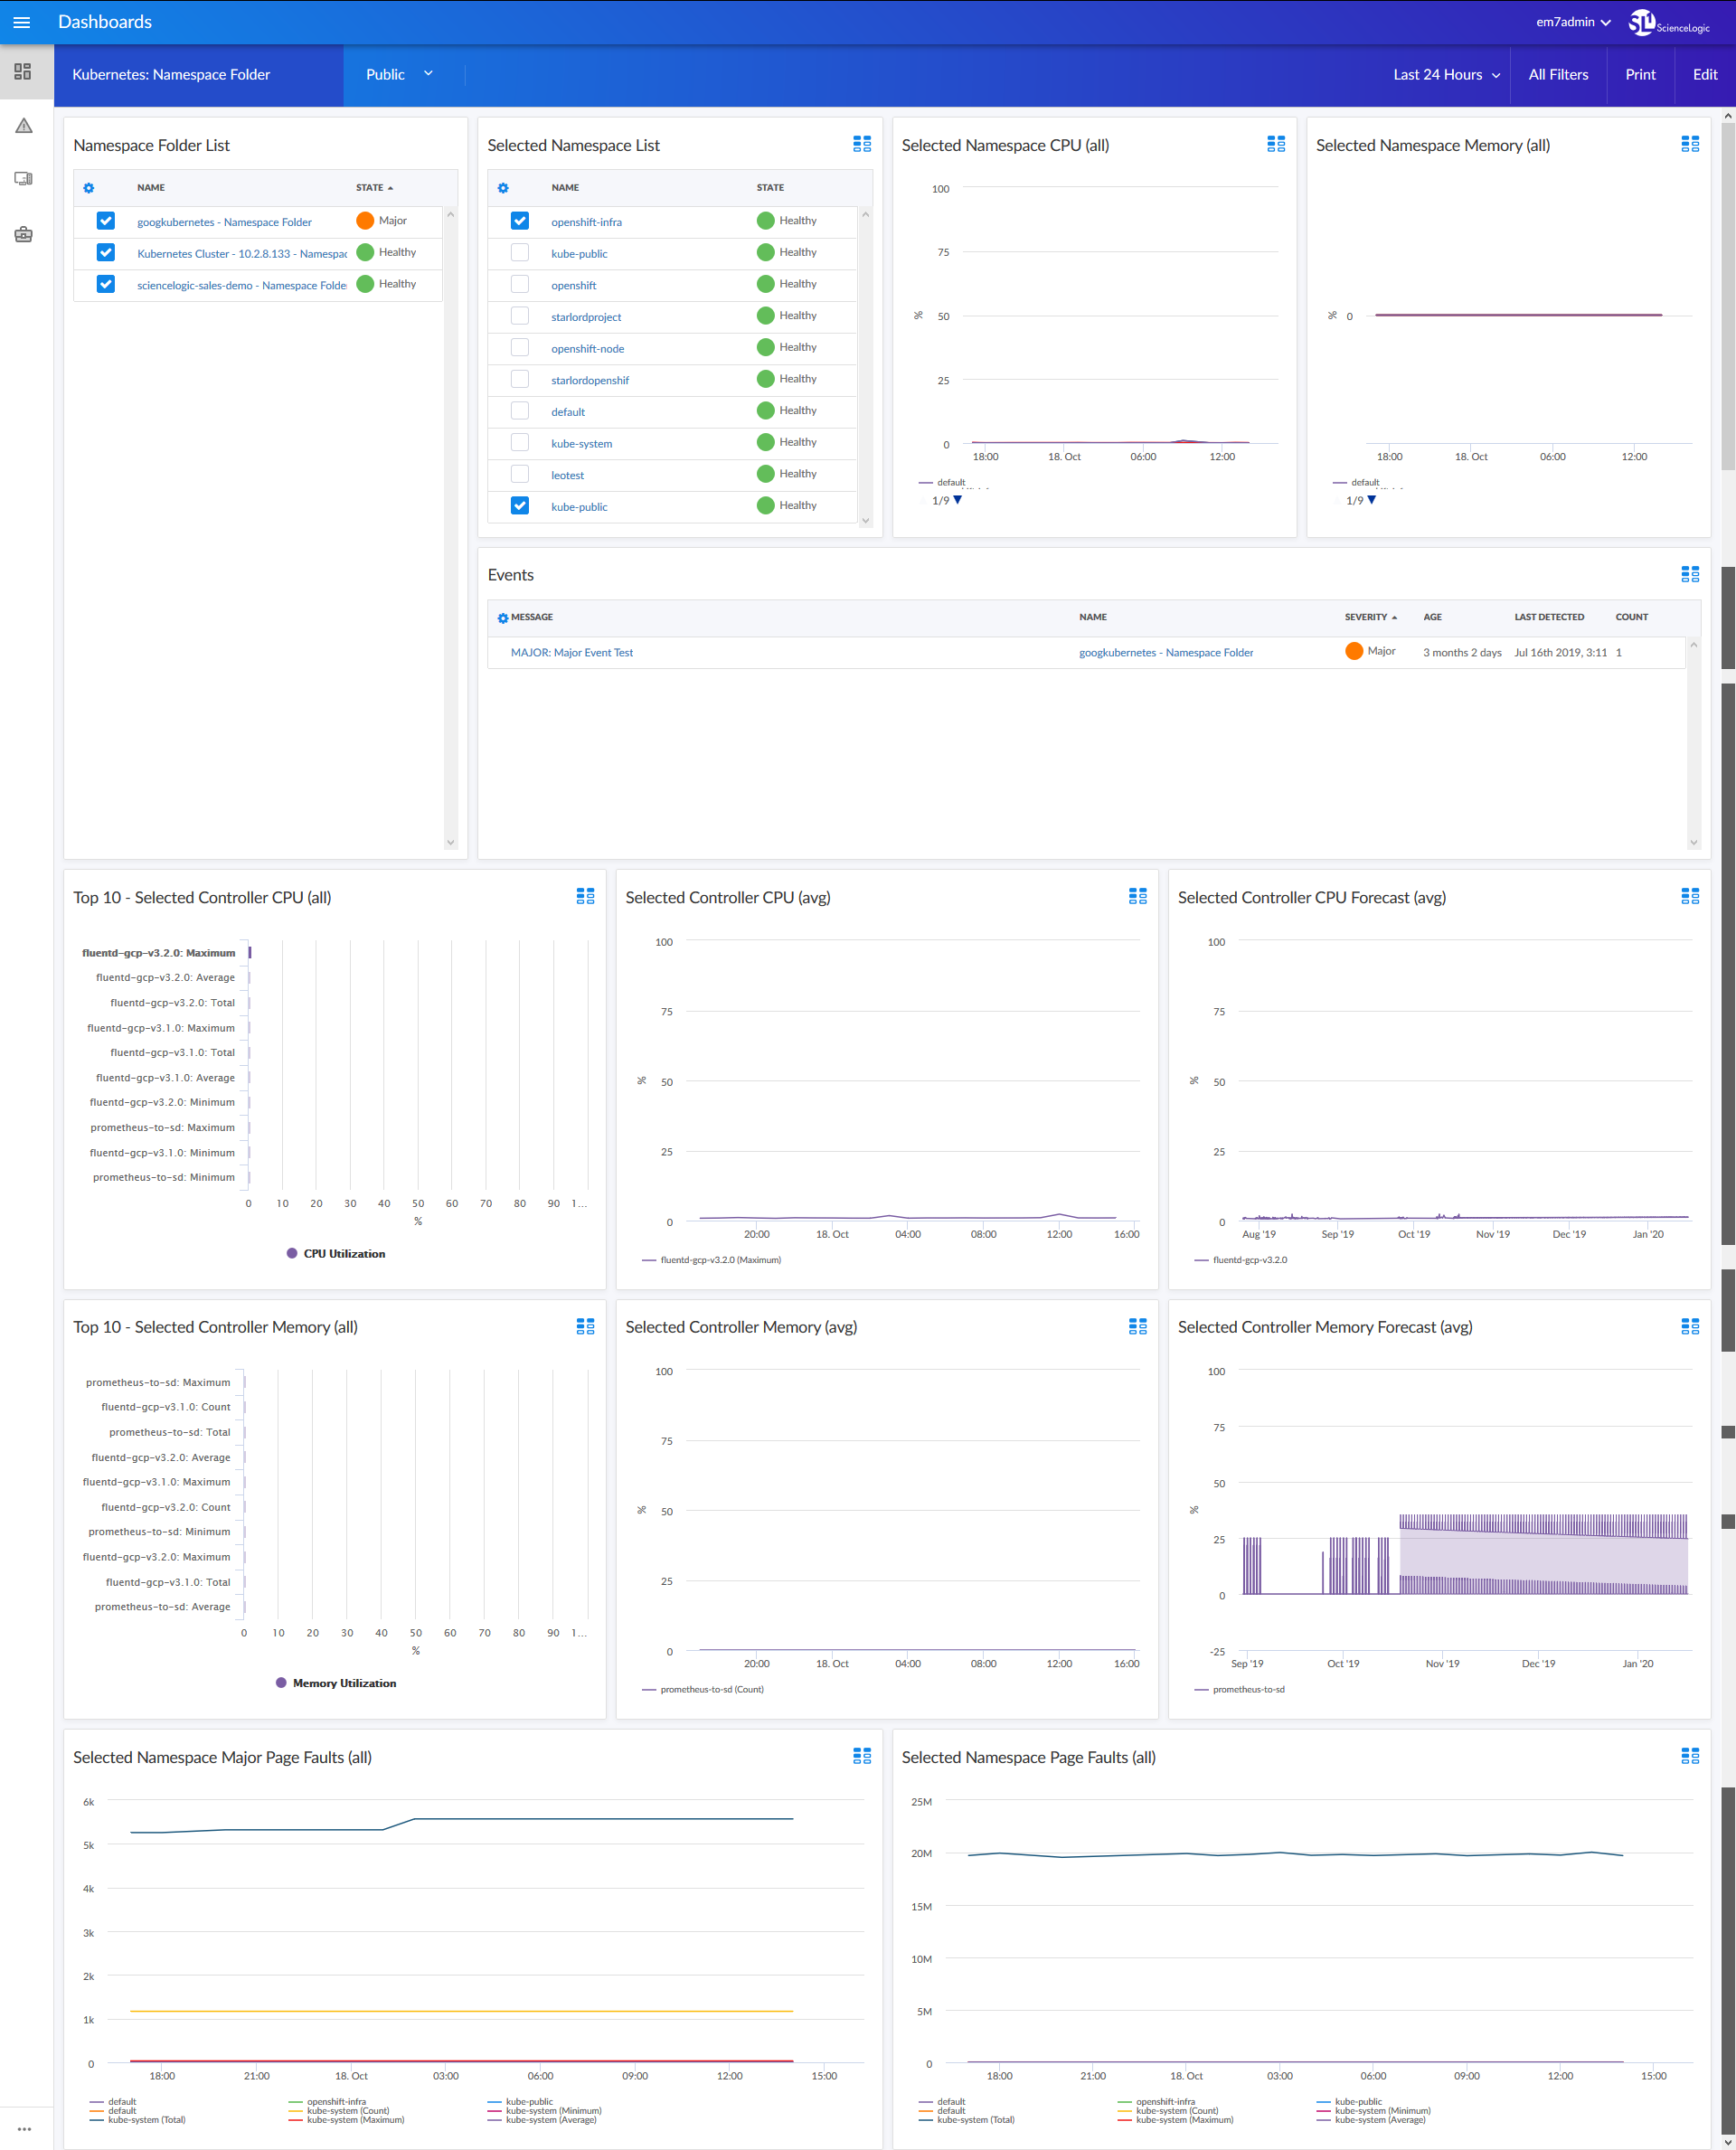
- A "Kubernetes: Namespace Folder" dashboard, which includes the following widgets that display data about your Kubernetes namespace folders:
- Namespace Folder List
- Selected Namespace List
- Selected Namespace CPU (all)
- Selected Namespace Memory (all)
- Events
- Top 10 - Selected Controller CPU (all)
- Selected Controller CPU (avg)
- Selected Controller CPU Forecast (avg)
- Top 10 - Selected Controller Memory (all)
- Selected Controller Memory (avg)
- Selected Controller Memory Forecast (avg)
- Selected Namespace Major Page Faults (all)
- Selected Namespace Page Faults (all)
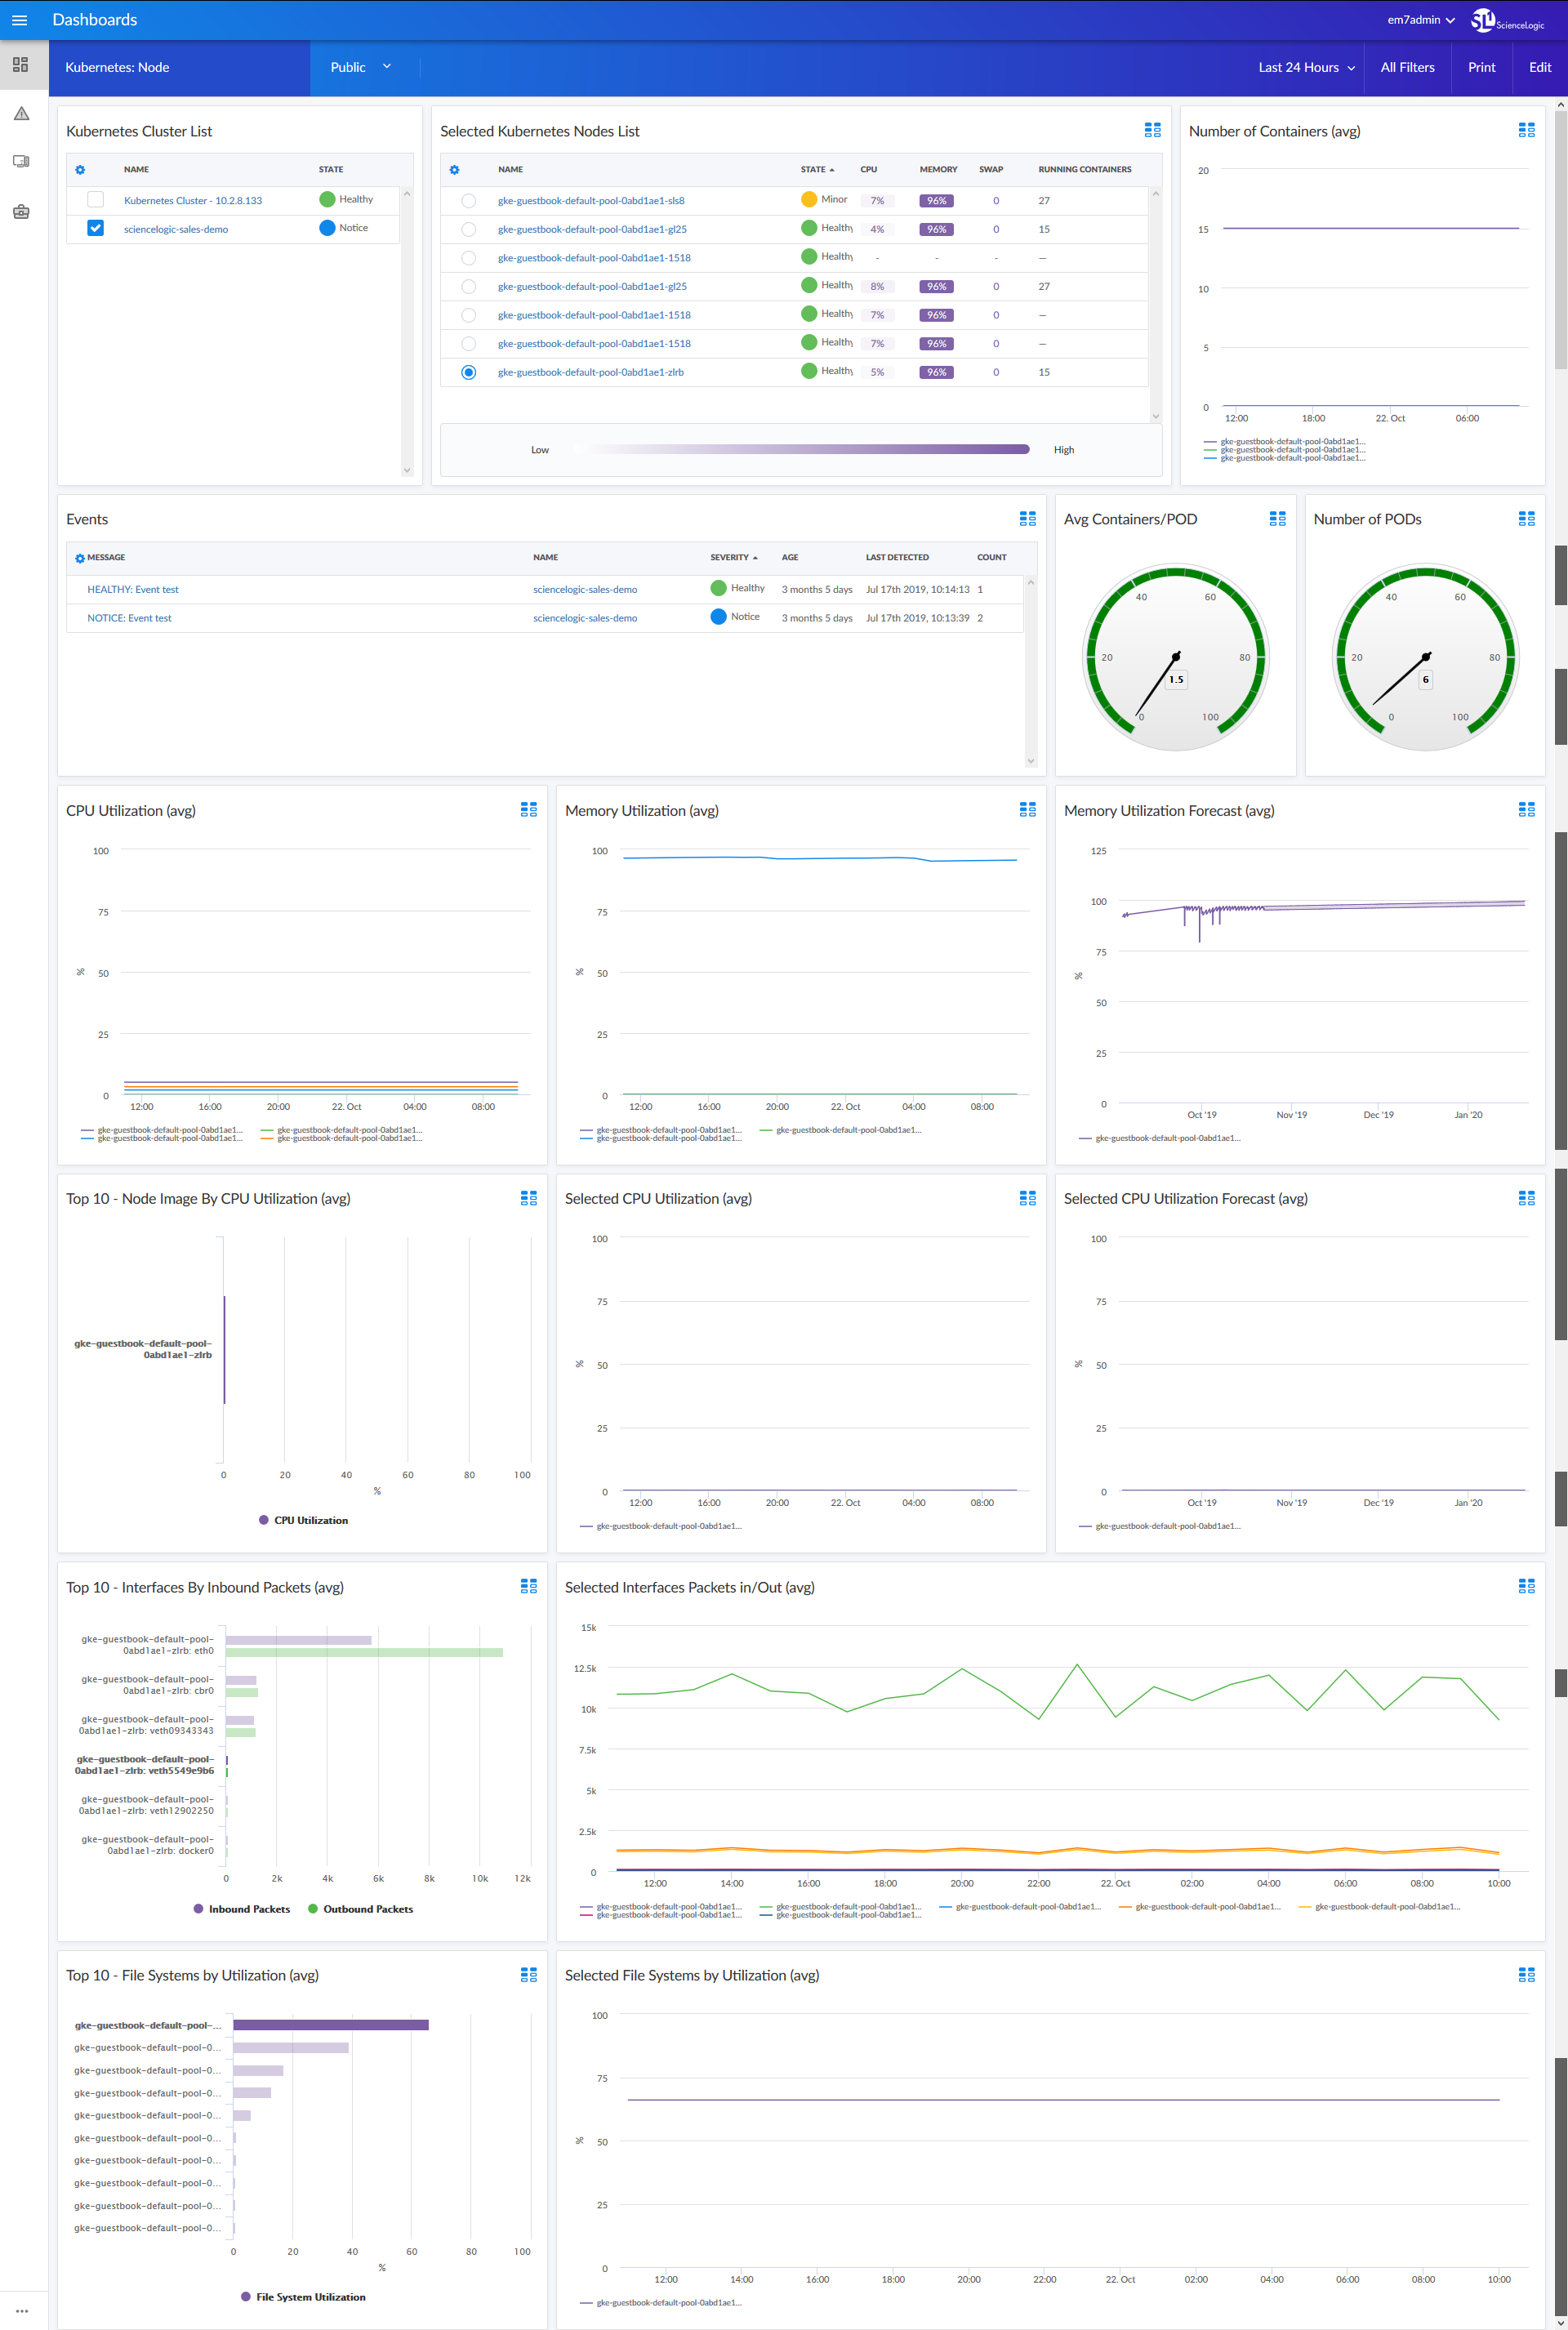
- A "Kubernetes: Node" dashboard, which includes the following widgets that display data about your Kubernetes nodes:
- Kubernetes Cluster List
- Selected Kubernetes Nodes List
- Number of Containers (avg)
- Events
- Average Containers per POD
- Number of PODs
- CPU Utilization (avg)
- Memory Utilization (avg)
- Memory Utilization Forecast (avg)
- Top 10 Node Images by CPU Utilization (avg)
- Selected CPU Utilization (avg)
- Selected CPU Utilization Forecast (avg)
- Top 10 Interfaces by Inbound Packets (avg)
- Selected Interfaces Packets In/Out (avg)
- Top 10 File Systems by Utilization (avg)
- Selected File Systems by Utilization (avg)
Enhancements and Issues Addressed
The following enhancements and addressed issues are included in version 102 of the Kubernetes: SL1 Dashboards PowerPack:
- Autoselect for context-driving widgets has been enabled in the "Microsoft: Exchange Server Performance" dashboard.
- The following widgets were added to the "Kubernetes: Cluster" dashboard:
- Events
- Selected Node CPU Utilization Forecast
- Top 10 - Host Nodes by Memory
- Selected Node Memory
- Selected Node Memory Forecast
- POD Lifetime
- The Events widget was added to the "Kubernetes: Namespace" dashboard.
- The following widgets were added to the "Kubernetes: Namespace Folder" dashboard:
- Events
- Selected Controller CPU
- Selected Controller CPU Forecast
- Selected Controller Memory
- Selected Controller Memory Forecast
- The Events, Memory Utilization Forecast, and Selected CPU Utilization Forecast widgets were added to the "Kubernetes: Node" dashboard.
- The Events, Selected Memory Utilization Forecast, and Selected CPU Utilization Forecast widgets were added to the "Kubernetes: Controller" dashboard.
Known Issues
Version 102 of the Kubernetes: SL1 Dashboards PowerPack has no known issues.