![]()
Version 102 of the Linux Server SL1 Dashboards PowerPack includes autoselect for context-driving widgets and the addition of forecast widgets to each dashboard.
NOTE: These dashboards are intended for use only in the new SL1 user interface and will not load in the classic ScienceLogic platform user interface.
- Minimum Required SL1 Version: 8.12.1
- Minimum Required AP2 Version: 5.125.44
- Minimum Required Widget Components Version: 2.175.0
- Minimum Required Linux Base Pack PowerPack Version: 102
Before You Install or Upgrade
Before installing Linux Server SL1 Dashboards PowerPack version 102, you must first ensure that you are running version 8.12.1 or later of SL1.
NOTE: For details on upgrading SL1, see the appropriate Release Notes.
You must also import and install theLinux Base Pack PowerPack version 102 or later before installing the PowerPack.
Installation or Upgrade Process
To install this PowerPack:
- Familiarize yourself with the Known Issues for this release.
- See the Before You Install or Upgrade section. If you have not done so already, upgrade your system to the 8.12.1 or later release.
- Download the "Linux Server SL1 Dashboards" version 102PowerPack from the Support Site to a local computer.
- Go to the PowerPack Manager page (System > Manage > PowerPacks). Click the menu and choose Import PowerPack. When prompted, import "Linux Server SL1 Dashboards" version 102.
- Click the button. For details on installing PowerPacks, see the chapter on Installing a PowerPack in the PowerPacks manual.
Features
The following dashboards are included in version 102 of the Linux Server SL1 Dashboards PowerPack:
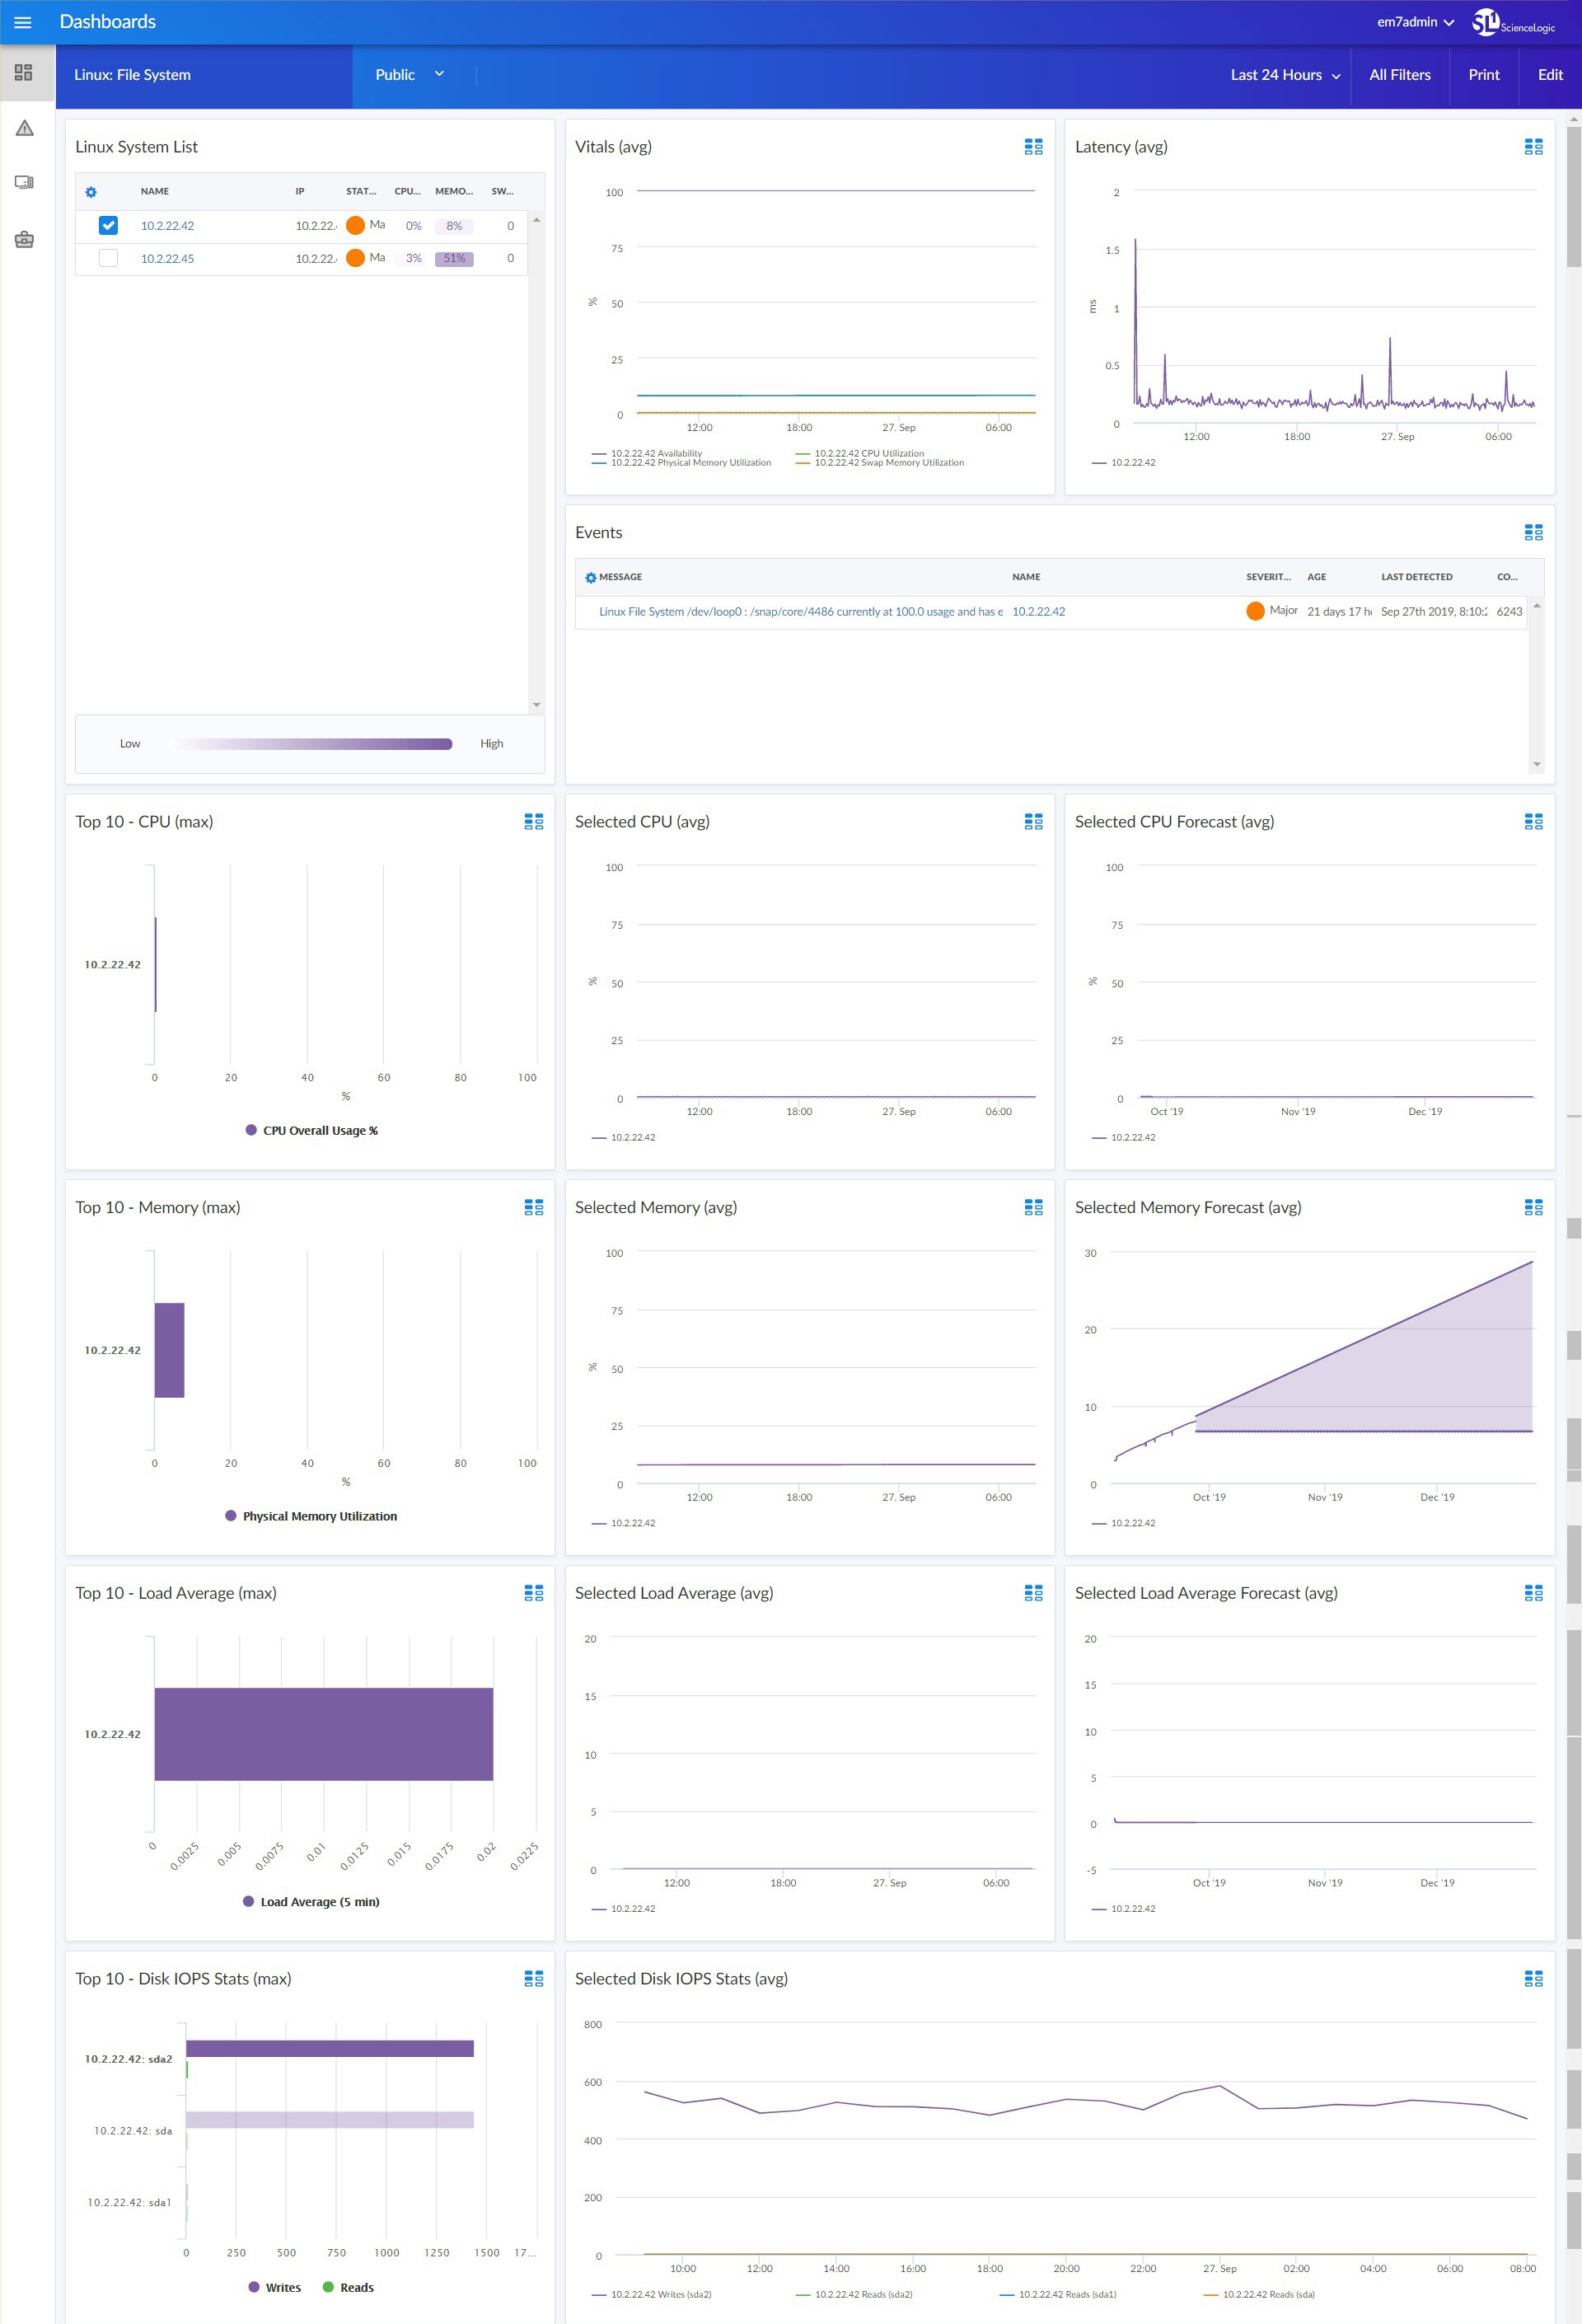
- A "Linux: File System" dashboard, which includes the following widgets that display overview data about your Linux file systems:
- Linux System List
- Vitals (avg)
- Latency (avg)
- Events
- Top 10 - CPU (max)
- Selected CPU (avg)
- Selected CPU Forecast (avg)
- Top 10 - Memory (max)
- Selected Memory (avg)
- Selected Memory Forecast (avg)
- Top 10 - Load Average (max)
- Selected Load Average (avg)
- Selected Load Average Forecast (avg)
- Top 10 - Disk Input/Output per Second (max)
- Selected Disk Input/Output per Second Stats (avg)
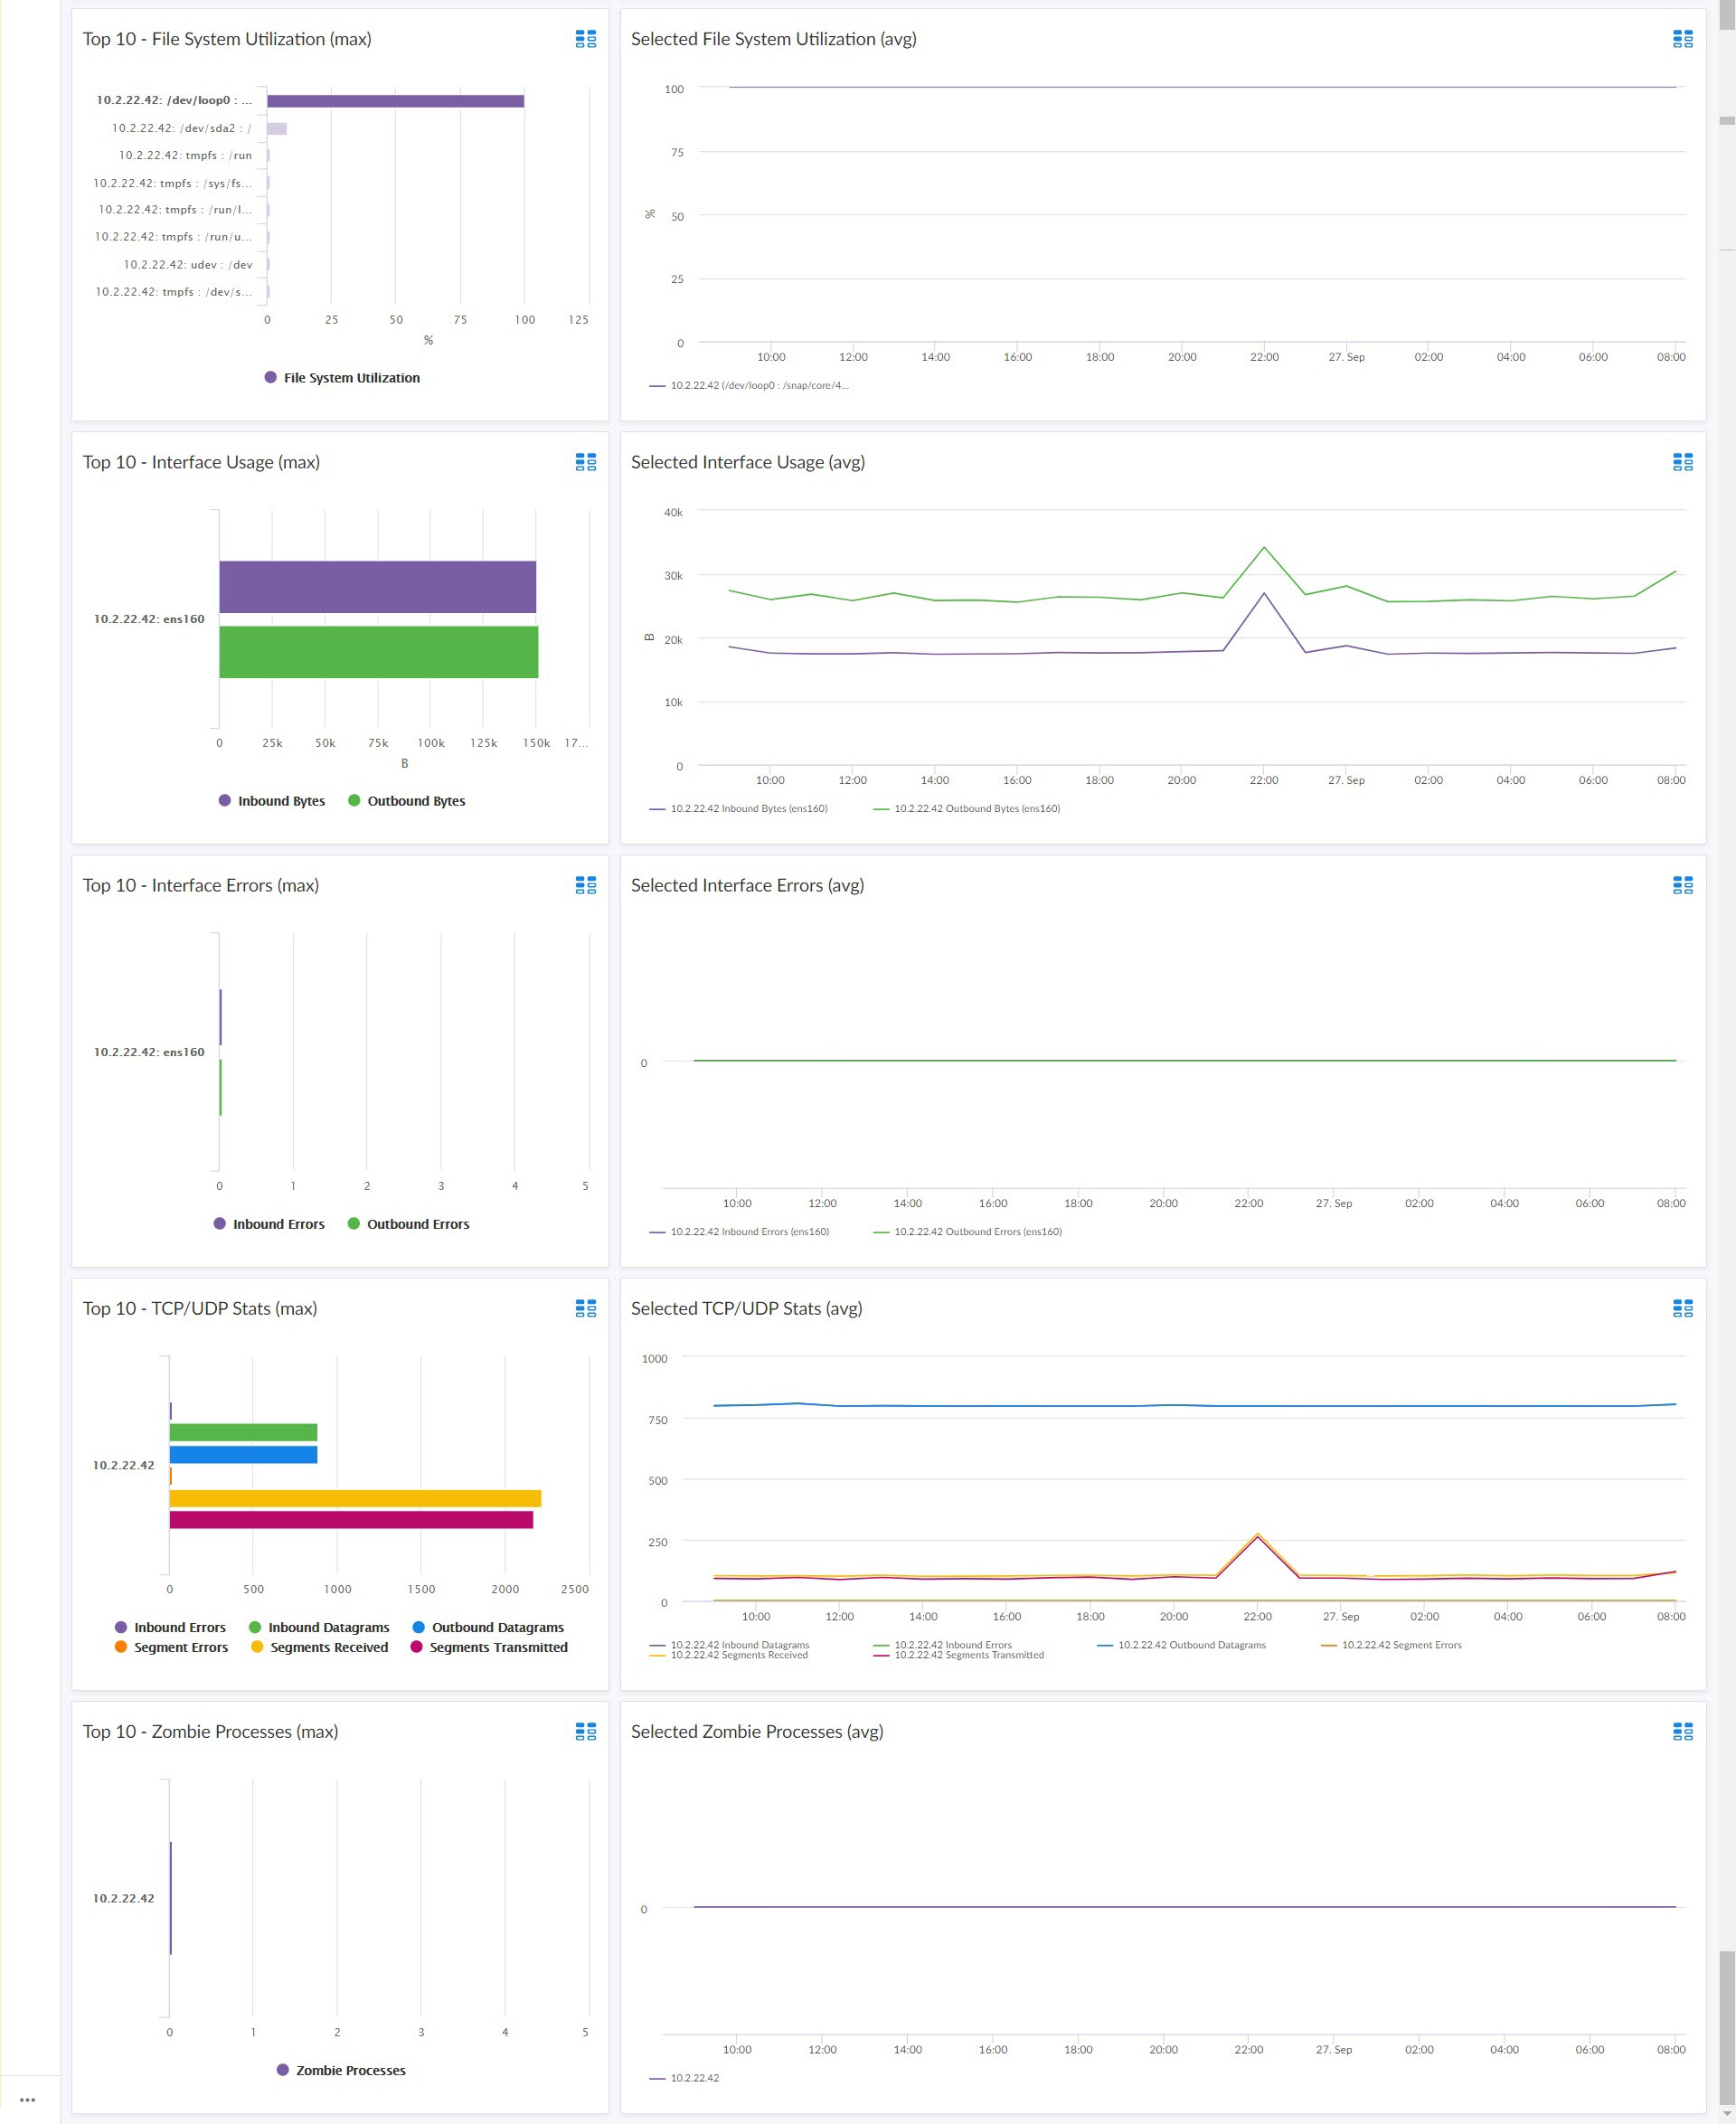
- Top 10 - File System Utilization (max)
- Selected File System Utilization (avg)
- Top 10 - Interface Usage (max)
- Selected Interface Usage (avg)
- Top 10 - Interface Errors (max)
- Selected Interface Errors (avg)
- Top 10 - TCP/UDP Stats (max)
- Selected TCP/UDP Stats (avg)
- Top 10 - Zombie Processes (max)
- Selected Zombie Processes (avg)
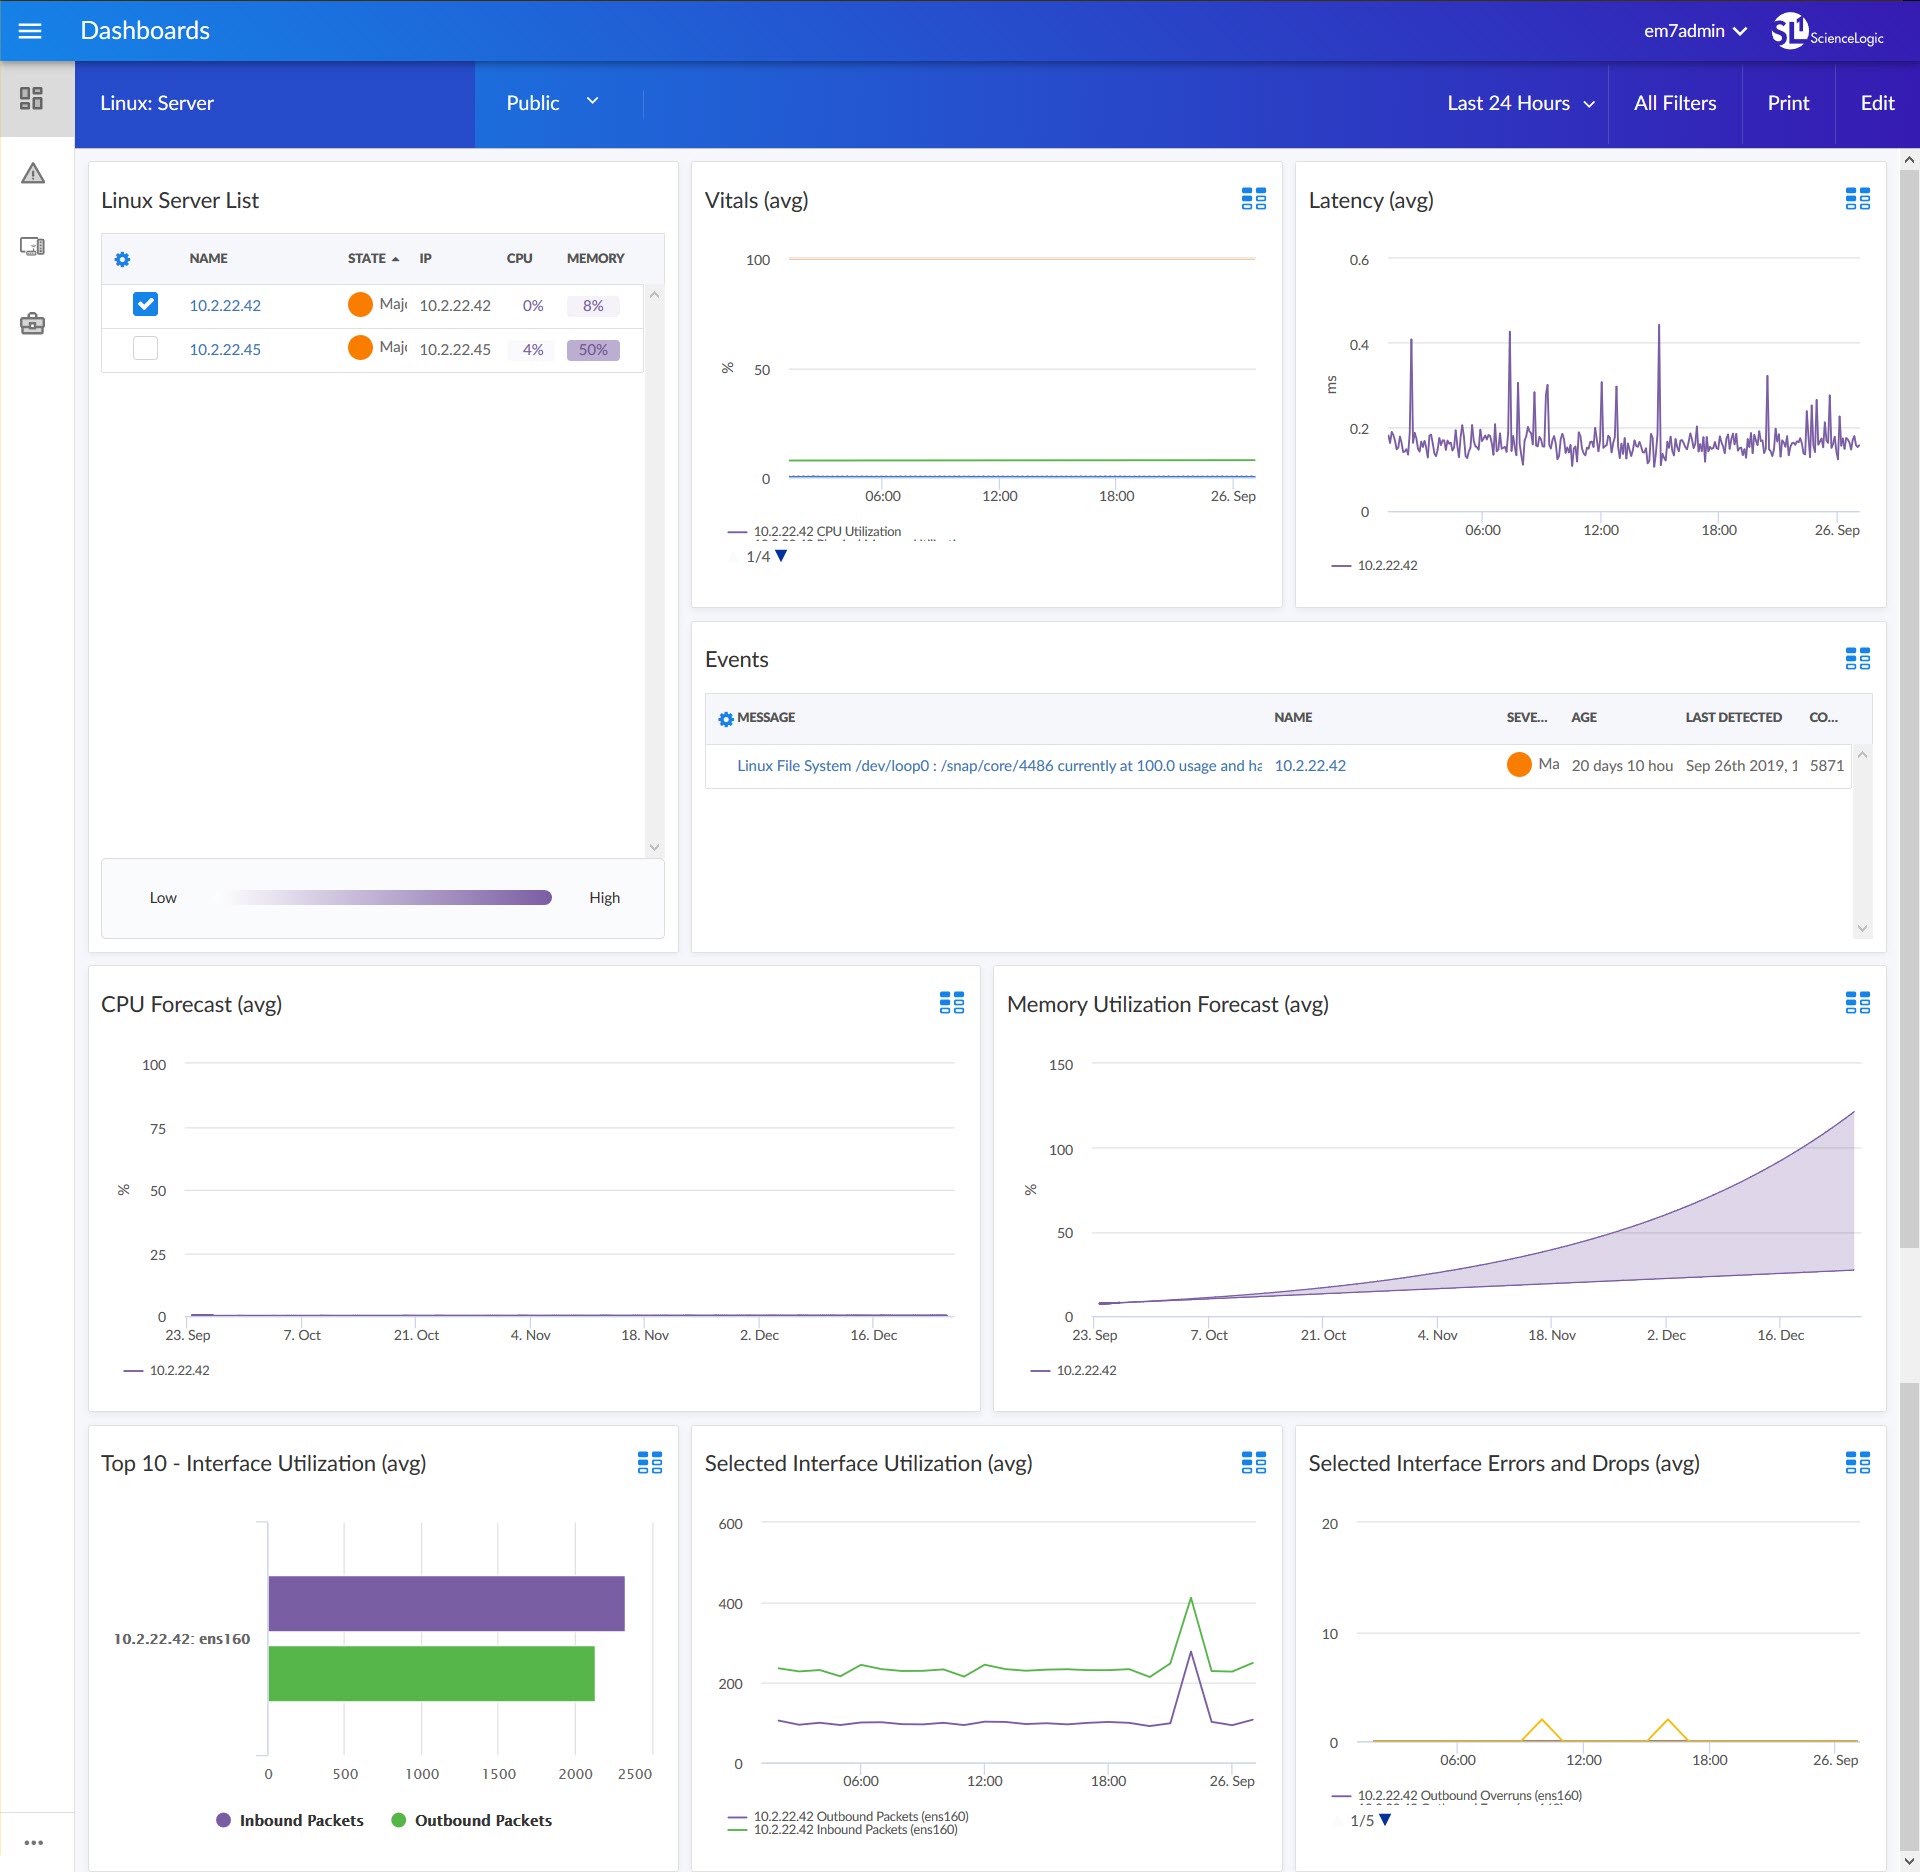
- A "Linux: Server" dashboard, which includes the following widgets that display data about your Linux servers:
- Linux Server List
- Vitals (avg)
- Latency (avg)
- Events
- CPU Forecast (avg)
- Memory Utilization Forecast (avg)
- Top 10 - Interface Utilization (avg)
- Selected Interface Utilization (avg)
- Selected Interface Errors and Drops (avg)
Enhancements and Issues Addressed
The following enhancements and addressed issues are included in version 102 of the Linux Server SL1 Dashboards PowerPack:
- Autoselect for context-driving widgets has been enabled in all dashboards in the PowerPack.
- The Events, Selected CPU Forecast, Selected Memory Forecast, and Selected Load Average Forecast widgets were added to the "Linux: File System" dashboard.
- The Events, CPU Forecast, and Memory Utilization Forecast widgets were added to the "Linux: Server" dashboard.
Known Issues
Version 102 of the Linux Server SL1 Dashboards PowerPack has no known issues.