![]()
Version 102 of the New Relic: SL1 Dashboards PowerPack is the initial version of the PowerPack. The PowerPack includes Dashboards that present graphical representations of the configuration data and performance metrics that are collected for New Relic devices by the New Relic: APMPowerPack.
NOTE: These dashboards are intended for use only in the new SL1 user interface and will not load in the classic ScienceLogic platform user interface.
- Minimum Required SL1 Version: 8.12.1
- Minimum Required AP2 Version: 5.155.0-hotfix.8
- Minimum Required Widget Components Version: 2.185.0-hotfix.3
- Minimum Required New Relic: APMPowerPack Version: 101
Before You Install
Before installing New Relic: SL1 Dashboards PowerPack version 102, you must first ensure that you are running version 8.12.1 or later of SL1.
NOTE: For details on upgrading SL1, see the appropriate Release Notes.
You must also import and install theNew Relic: APMPowerPack version 101 or later before installing the PowerPack.
Installation Process
To install this PowerPack:
- Familiarize yourself with the Known Issues for this release.
- See the Before You Install or Upgrade section. If you have not done so already, upgrade your system to the 8.12.1 or later release.
- Download the "New Relic: SL1 Dashboards" version 102PowerPack from the Support Site to a local computer.
- Go to the PowerPack Manager page (System > Manage > PowerPacks). Click the menu and choose Import PowerPack. When prompted, import "New Relic: SL1 Dashboards" version 102.
- Click the button. For details on installing PowerPacks, see the chapter on Installing a PowerPack in the PowerPacks manual.
Features
The following dashboards are included in version 102 of the New Relic: SL1 Dashboards PowerPack:
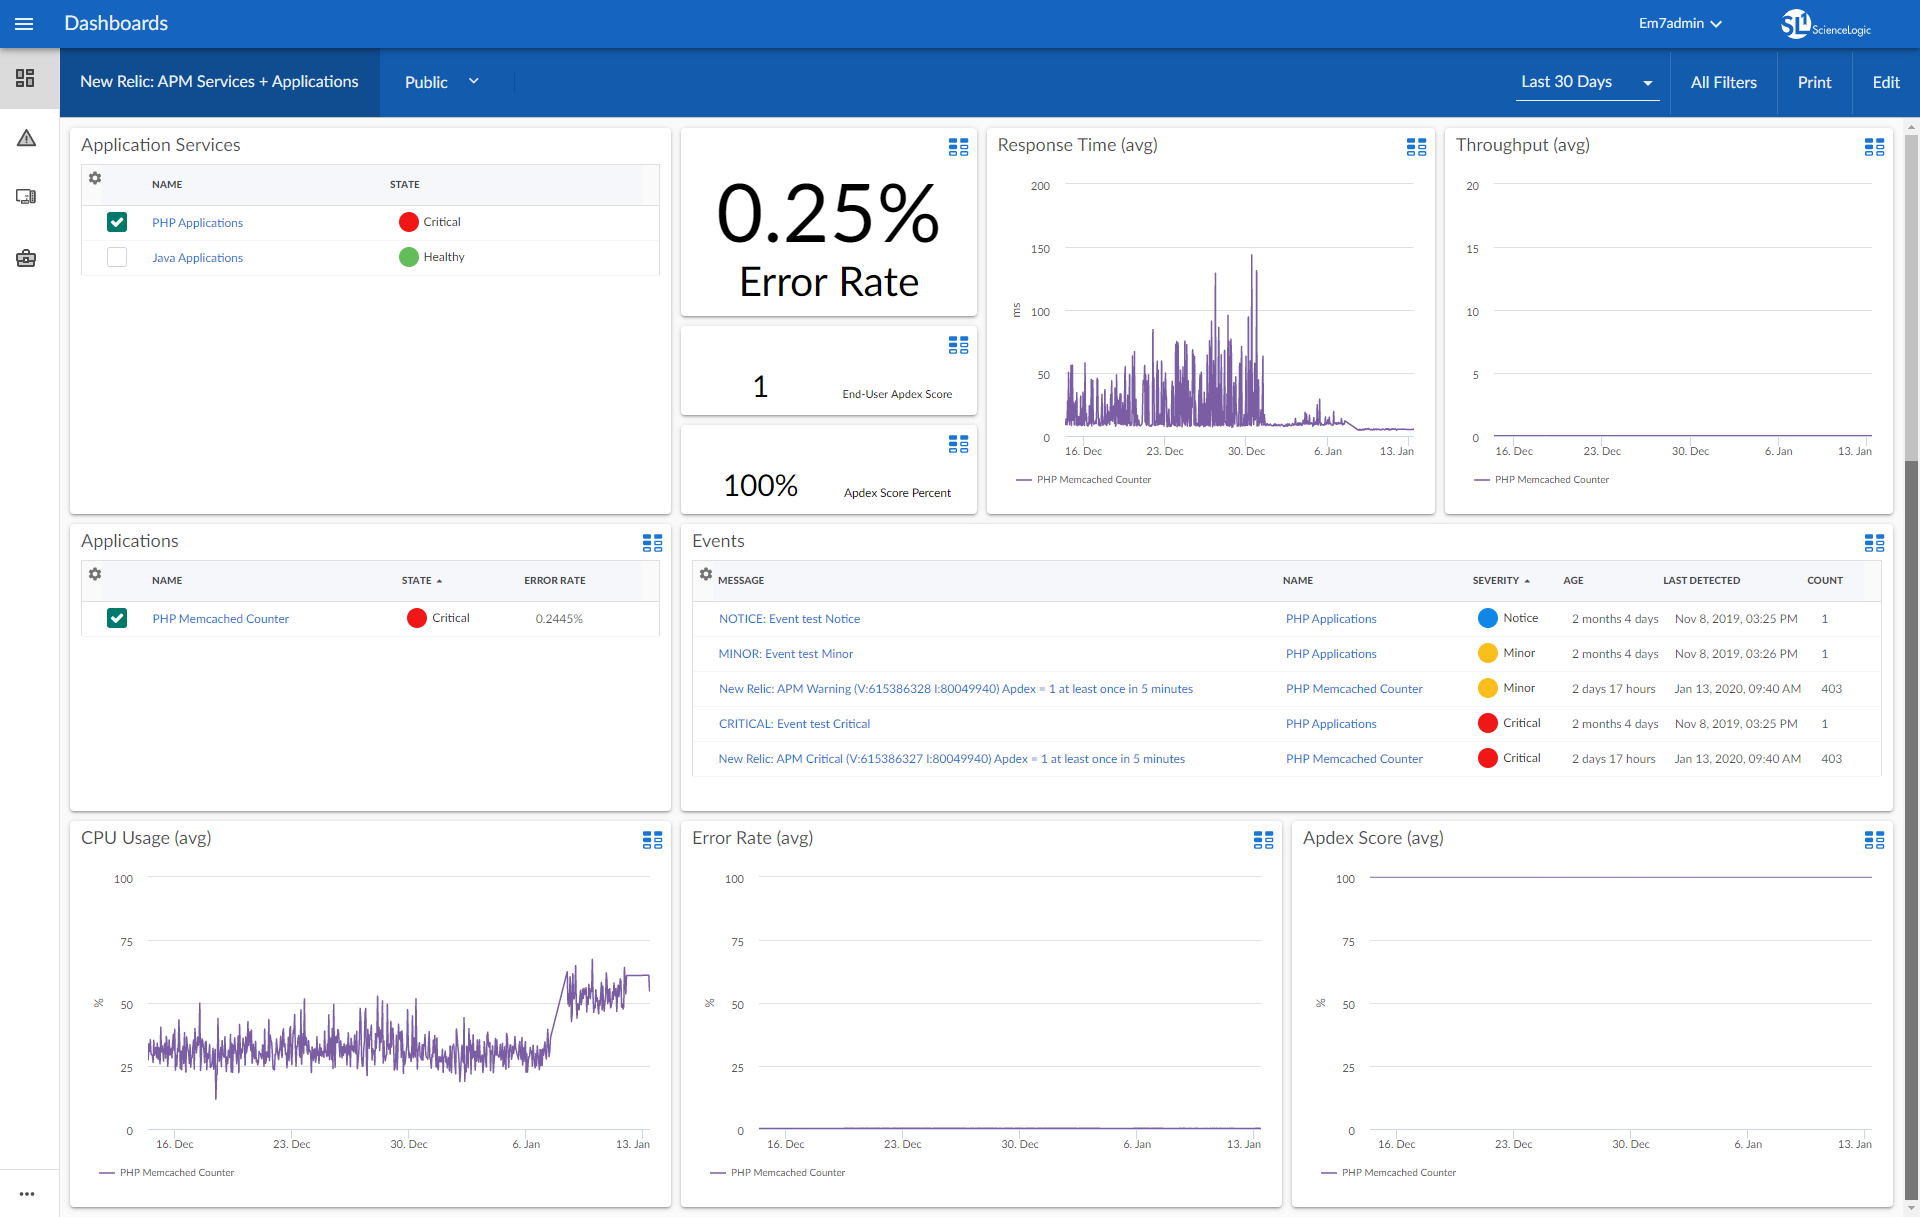
- A "New Relic: APM Services + Applications" dashboard, which includes the following widgets that display data about your New Relic services:
- Application Services
- Error Rate
- End-User Apdex Score
- Apdex Score Percent
- Response Time (avg)
- Throughput (avg)
- Applications
- Events
- CPU Usage (avg)
- Error Rate (avg)
- Apdex Score (avg)
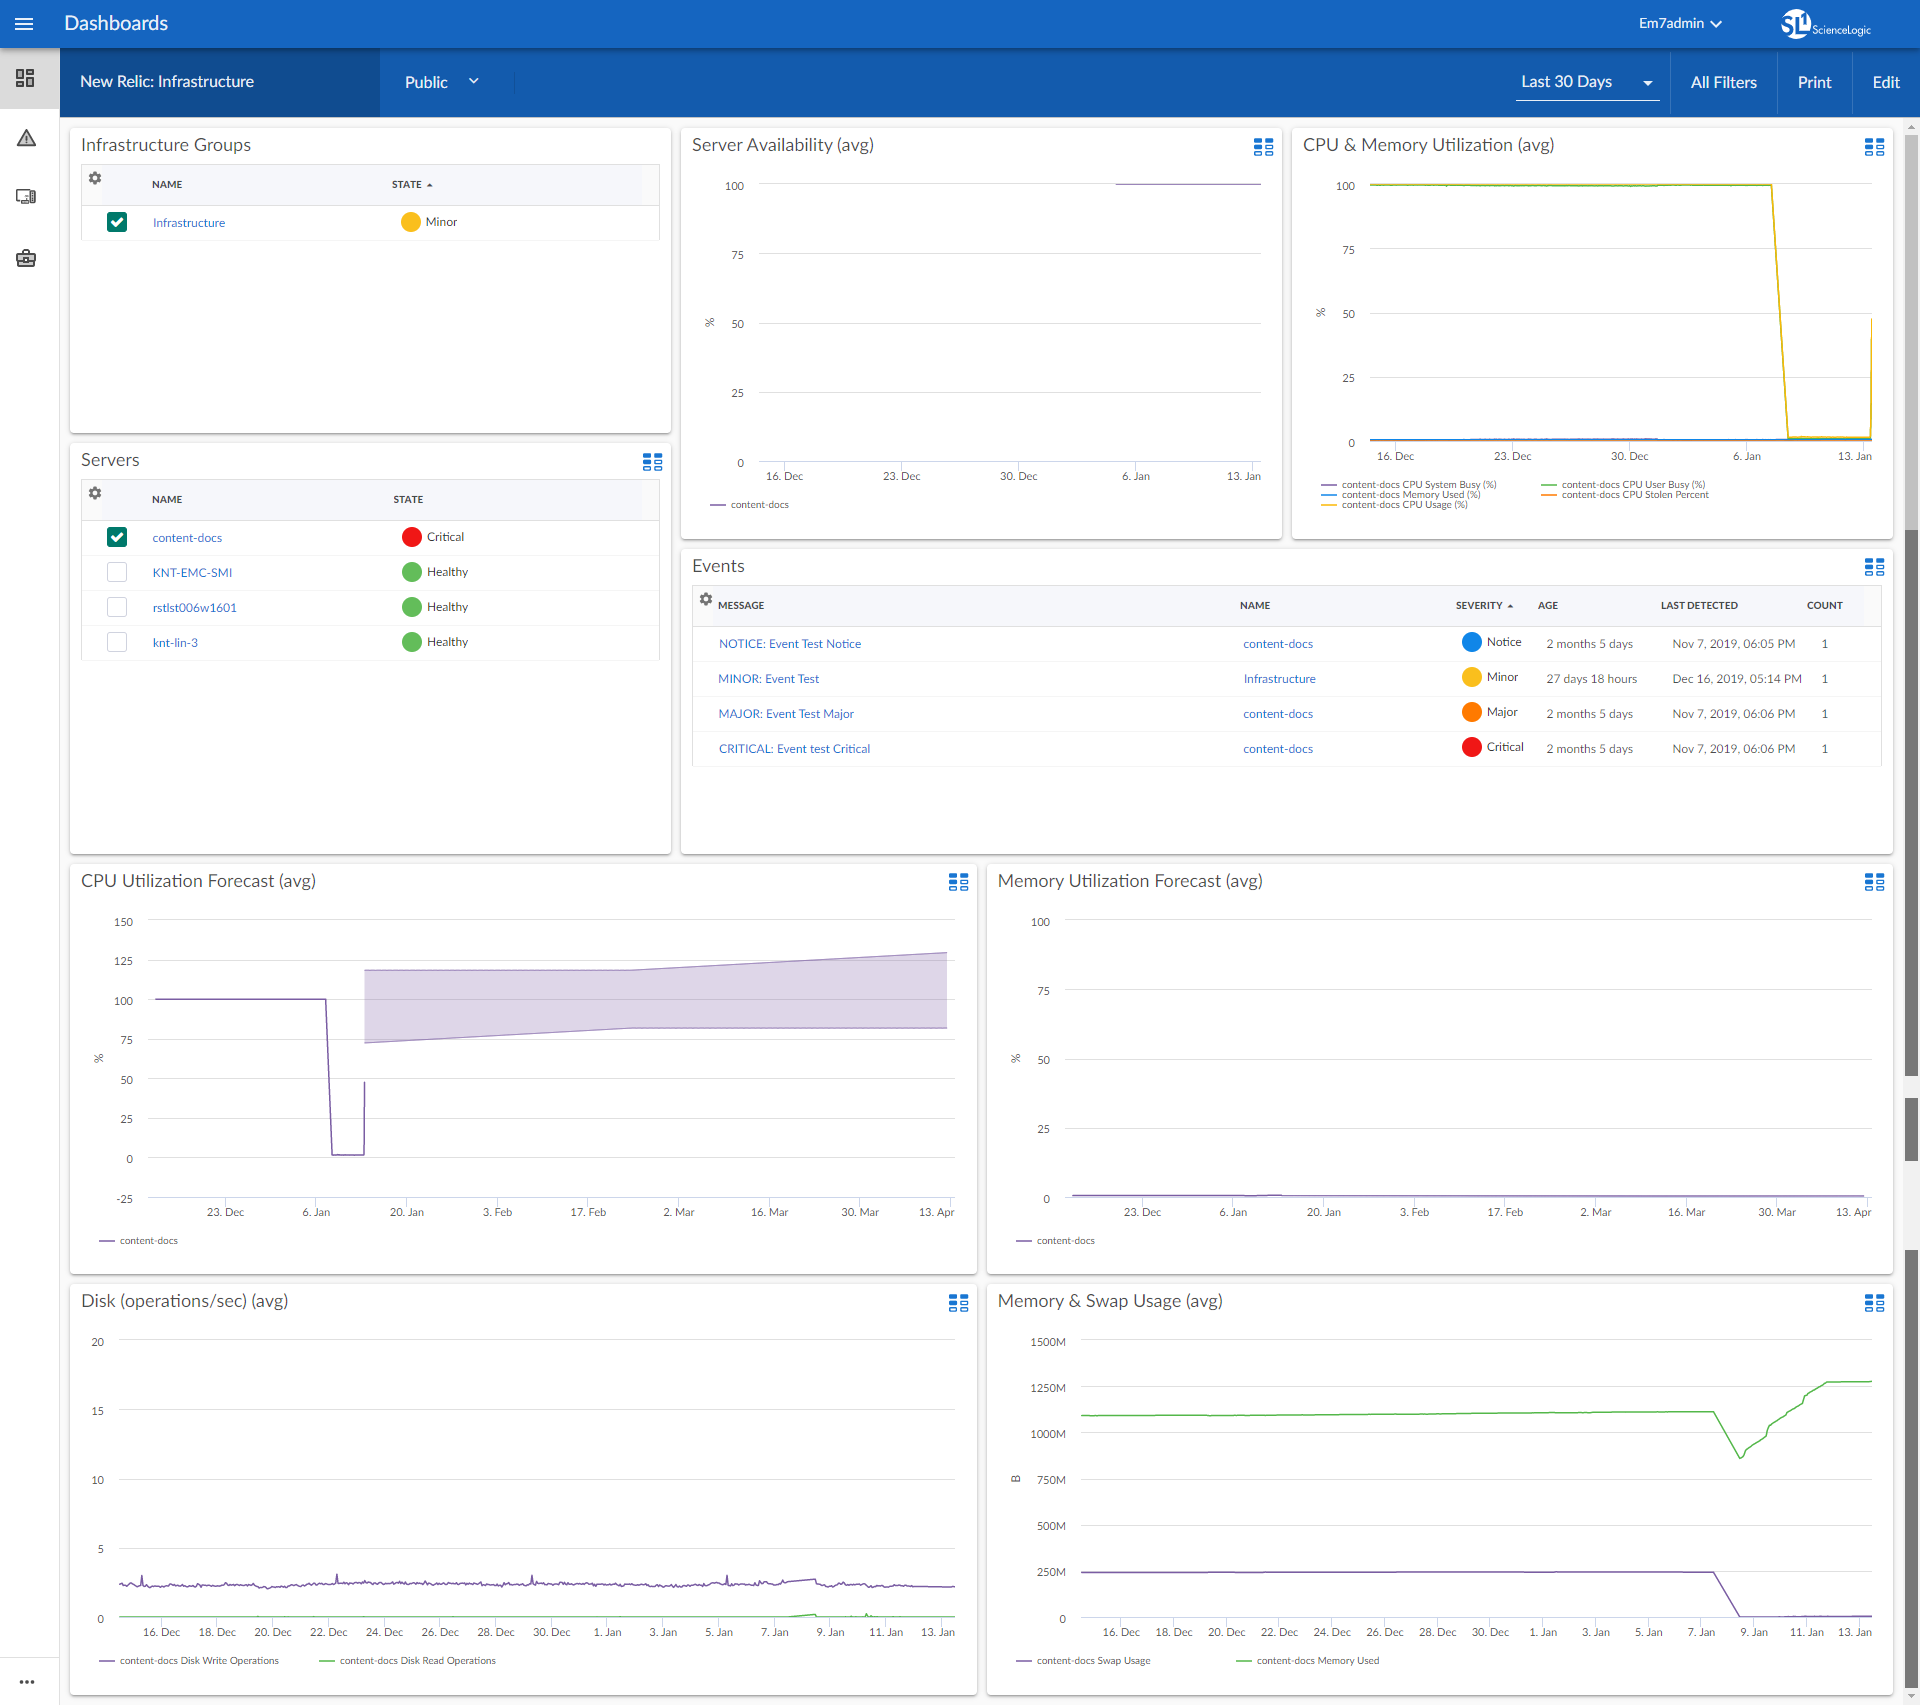
- A "New Relic: Infrastructure" dashboard, which includes the following widgets that display overview data about your New Relic infrastructure:
- Infrastructure Groups
- Server Availability (avg)
- CPU & Memory Utilization (avg)
- Servers
- Events
- CPU Utilization Forecast (avg)
- Memory Utilization Forecast (avg)
- Disk (operations/sec) (avg)
- Memory & Swap Usage (avg)
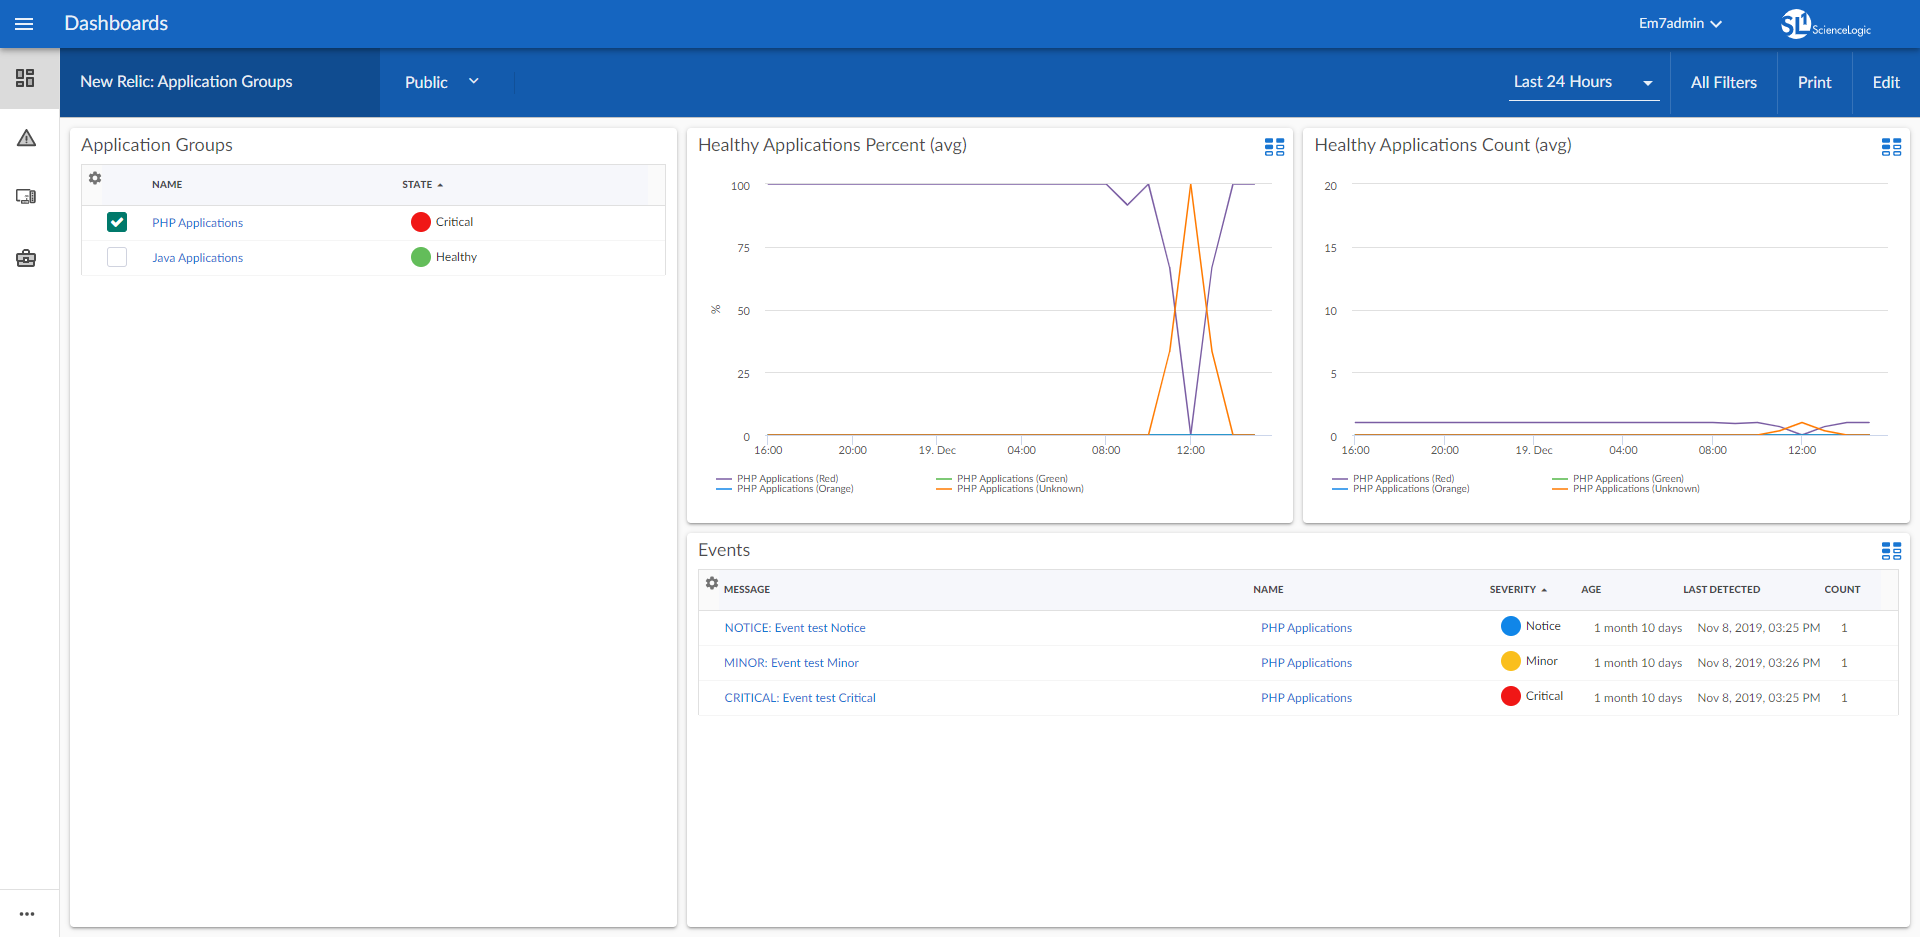
- A "New Relic: Application Groups" dashboard, which includes the following widgets that display data about your New Relic application groups:
- Application Groups
- Healthy Applications Percent (avg)
- Healthy Applications Count (avg)
- Events
Known Issues
Version 102 of the New Relic: SL1 Dashboards PowerPack has no known issues.