![]()
Version 102 of the VMware vSphere: SL1 Dashboards PowerPack includes the addition of CPU Forecast and Memory Forecast widgets to each dashboard and autoselect for context-driving widgets.
NOTE: These dashboards are intended for use only in the new SL1 user interface and will not load in the classic ScienceLogic platform user interface.
- Minimum Required SL1 Version: 8.12.1
- Minimum Required AP2 Version: 5.125.44
- Minimum Required Widget Components Version: 2.175.0
- Minimum Required VMware: vSphere Base Pack PowerPack Version: 213
Before You Install or Upgrade
Before installing VMware vSphere: SL1 Dashboards PowerPack version 102, you must first ensure that you are running version 8.12.1 or later of SL1.
NOTE: For details on upgrading SL1, see the appropriate Release Notes.
You must also import and install theVMware: vSphere Base PackPowerPack version 213 or later before installing the PowerPack.
Installation or Upgrade Process
To install this PowerPack:
- Familiarize yourself with the Known Issues for this release.
- See the Before You Install or Upgrade section. If you have not done so already, upgrade your system to the 8.12.1 or later release.
- Download the "VMware vSphere: SL1 Dashboards" version 102PowerPack from the Support Site to a local computer.
- Go to the PowerPack Manager page (System > Manage > PowerPacks). Click the menu and choose Import PowerPack. When prompted, import "VMware vSphere: SL1 Dashboards" version 102.
- Click the button. For details on installing PowerPacks, see the chapter on Installing a PowerPack in the PowerPacks manual.
Features
The following dashboards are included in version 102 of the VMware vSphere: SL1 Dashboards PowerPack:
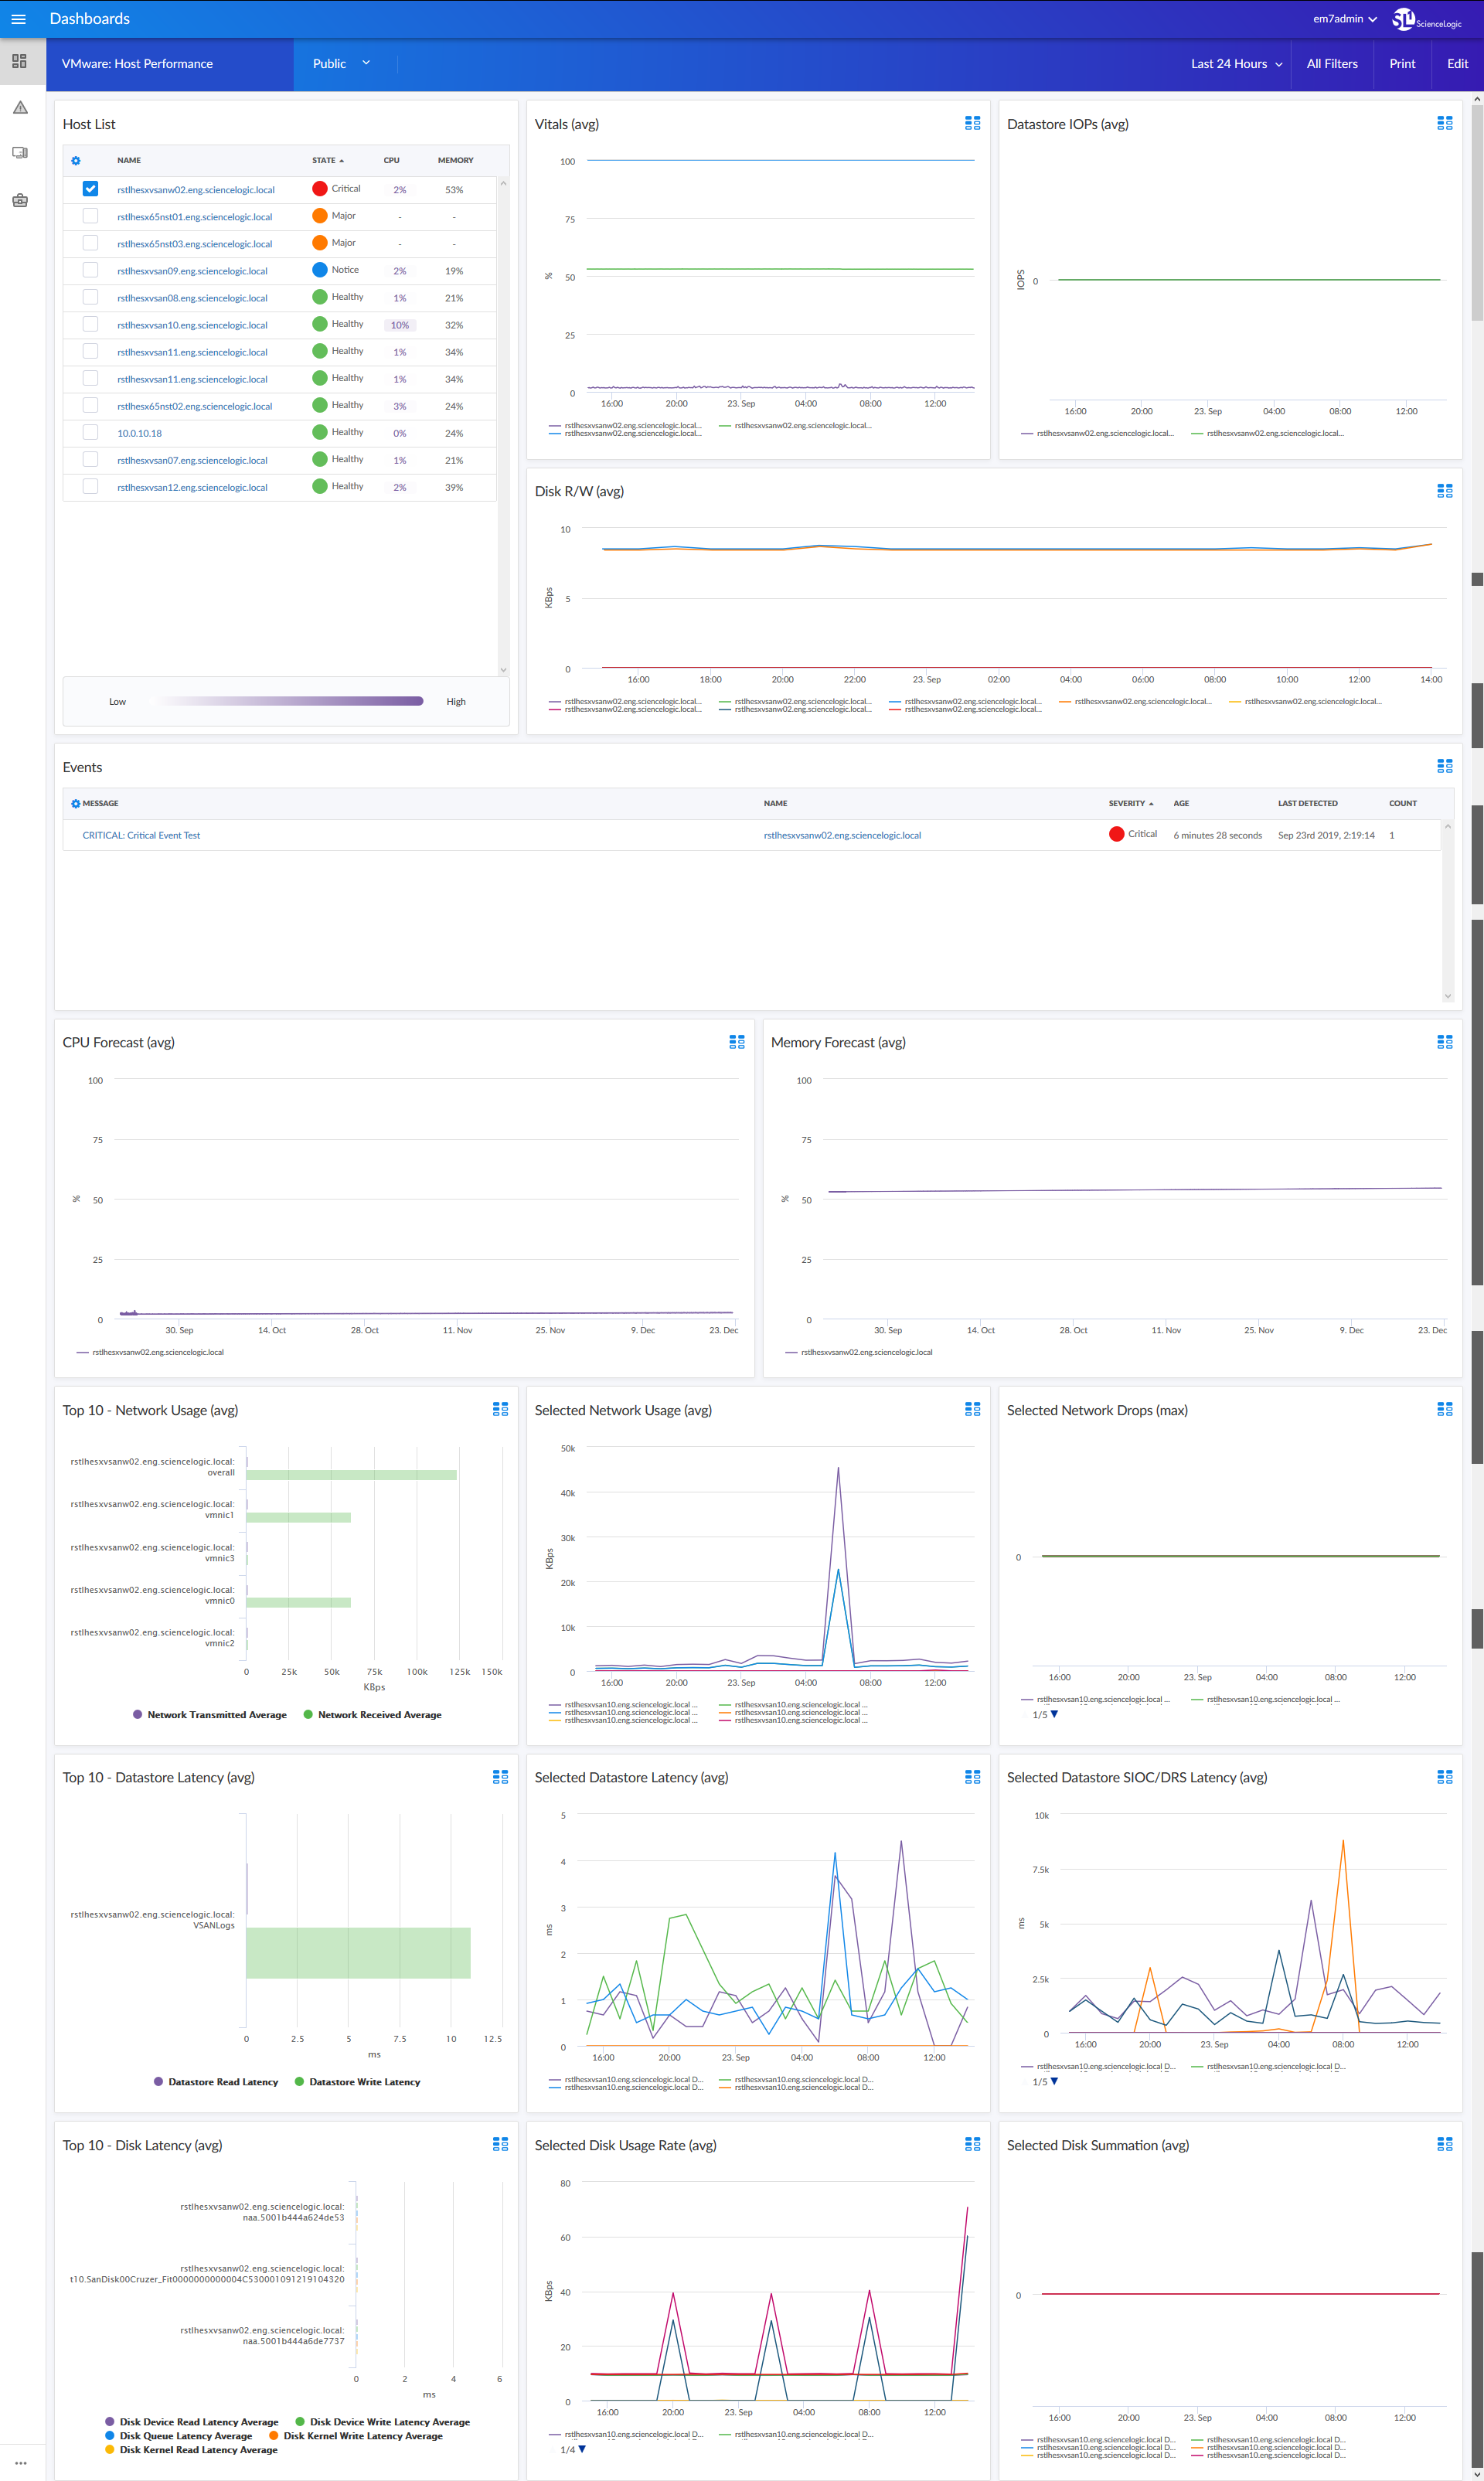
- A "VMware: Host Performance" dashboard, which includes the following widgets that display data about your VMware hosts:
- Host List
- Vitals (avg)
- Datastore Input/Output Operations per Second (IOPS) (avg)
- Disk Read/Write (avg)
- Events
- CPU Forecast (avg)
- Memory Forecast (avg)
- Top 10 - Network Usage (avg)
- Selected Network Usage (avg)
- Selected Network Drops (max)
- Top 10 - Datastore Latency (avg)
- Selected Datastore Latency (avg)
- Selected Datastore Storage I/O Control and Distributed Resource Scheduler (SIOC/DRS) Latency (avg)
- Top 10 - Disk Latency (avg)
- Selected Disk Usage Rate (avg)
- Selected Disk Summation (avg)
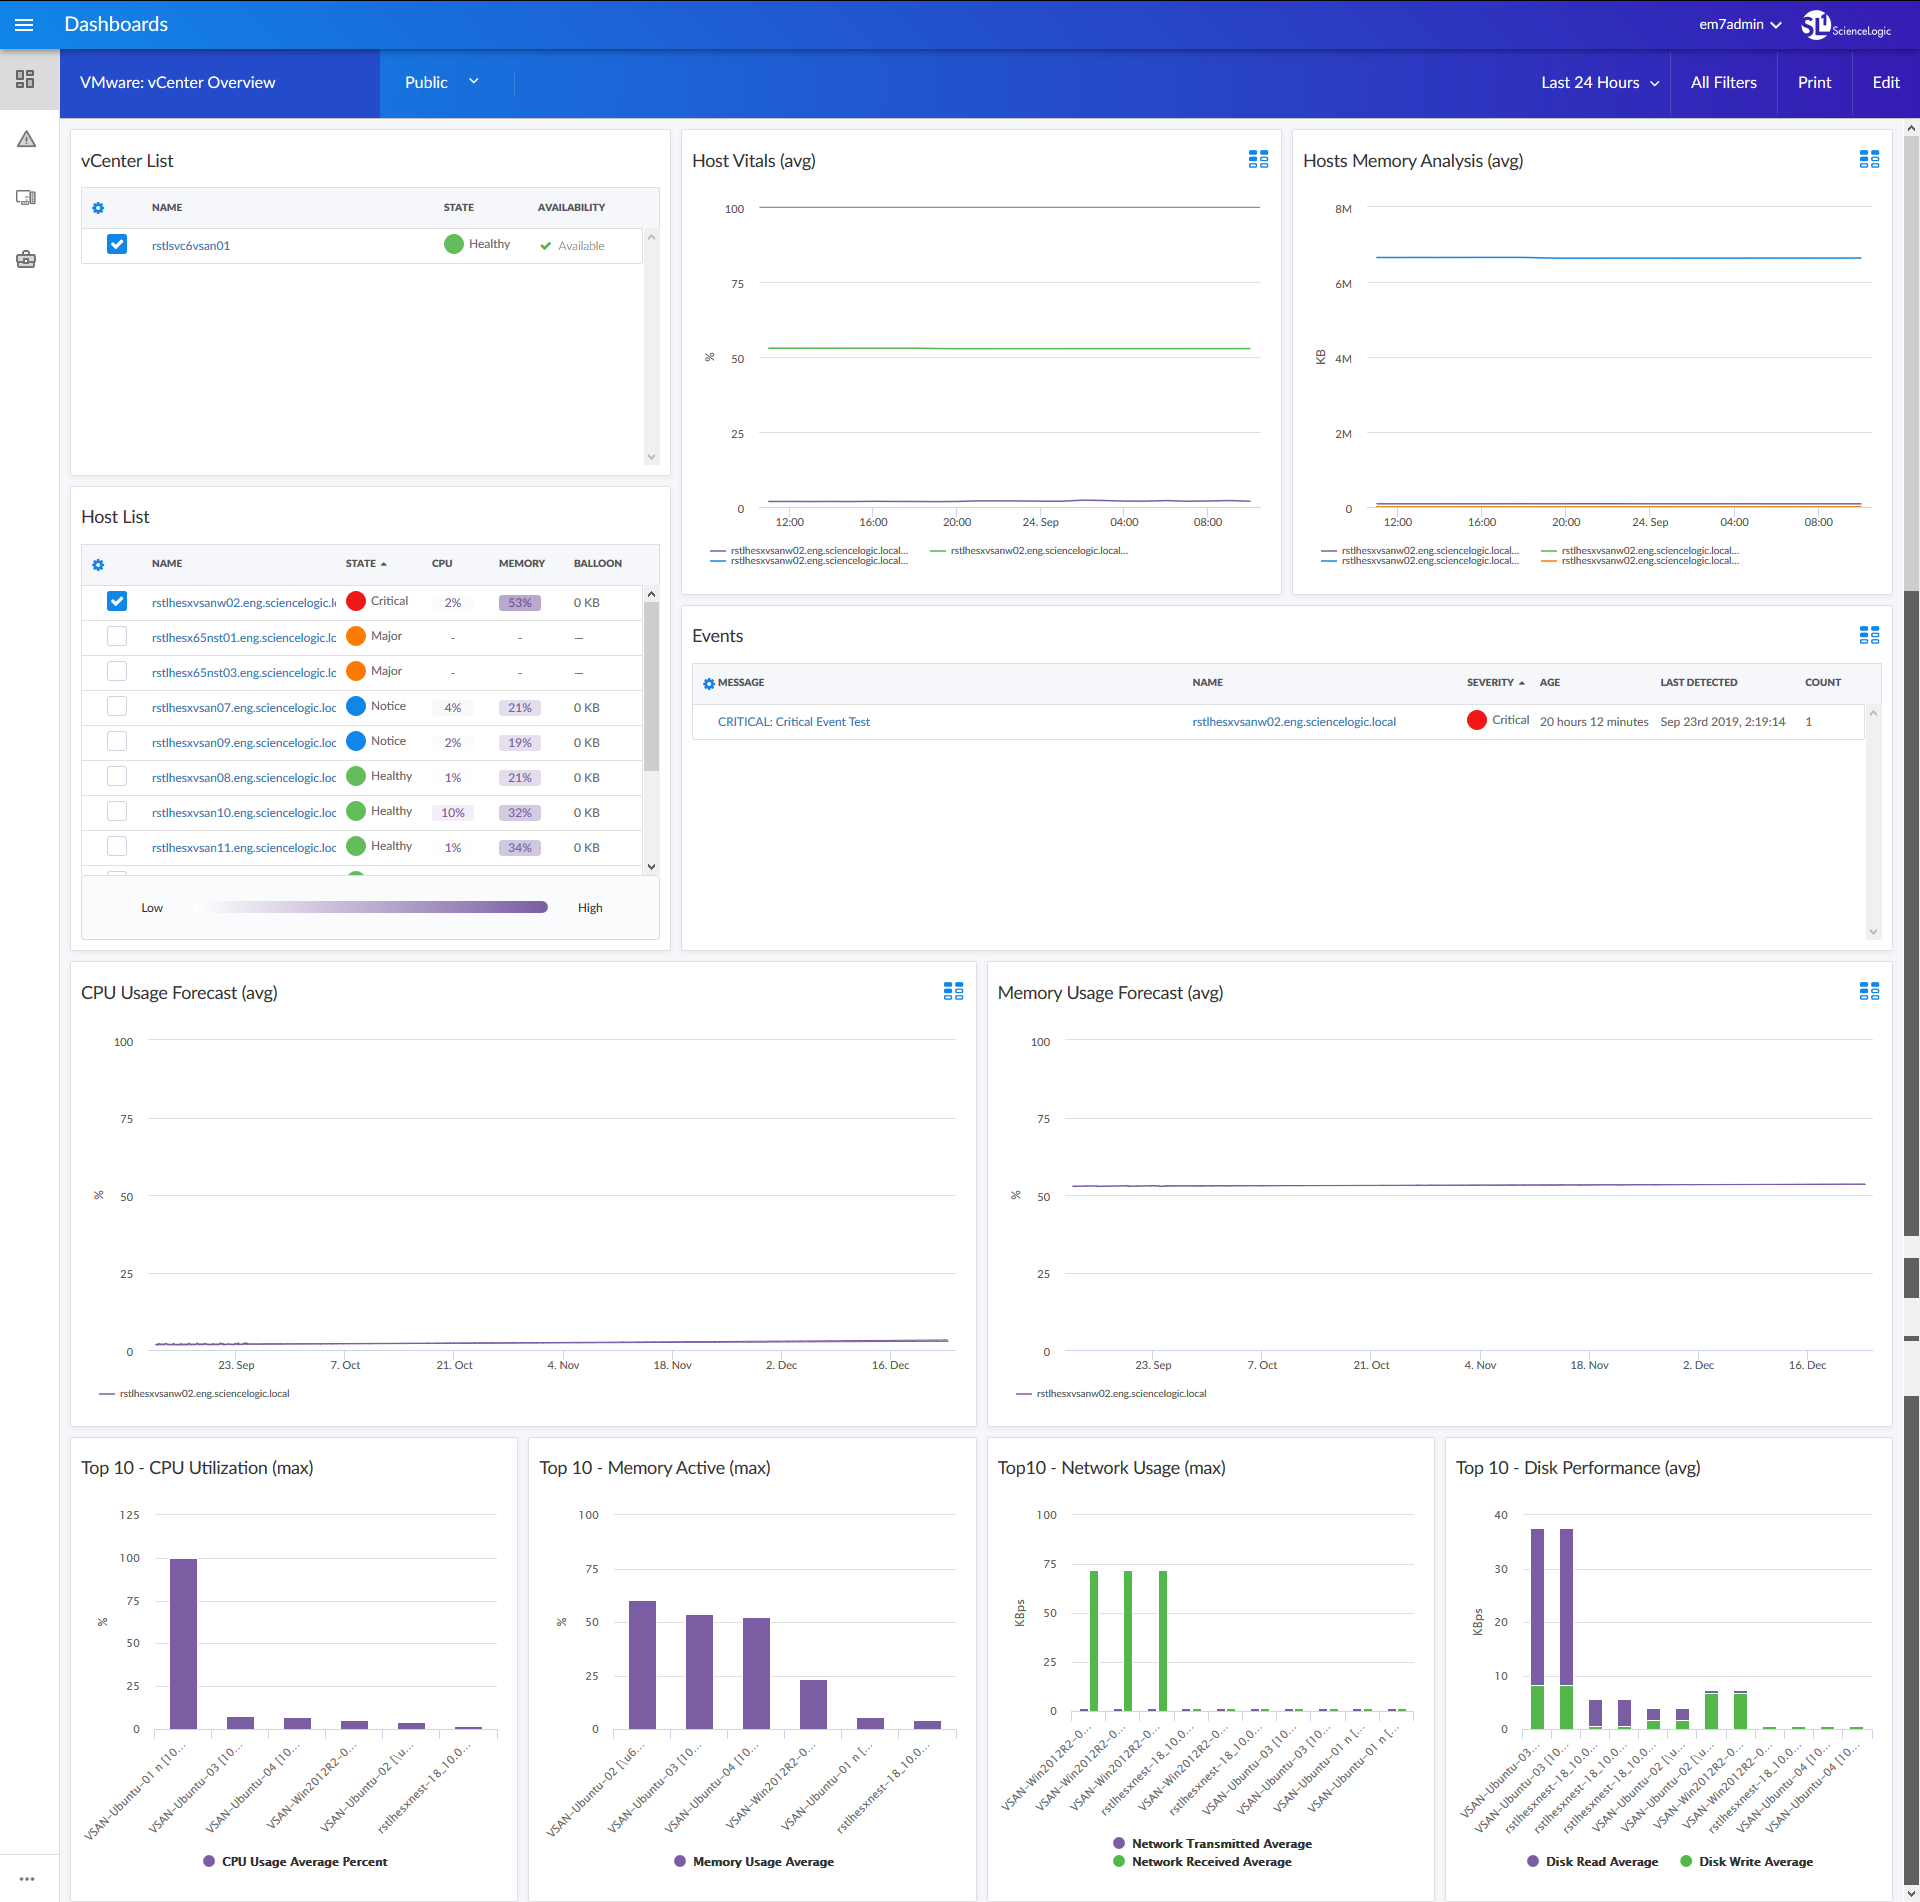
- A "VMware: vCenter Overview" dashboard, which includes the following widgets that display data about vCenter:
- vCenter List
- Host List
- Host Vitals (avg)
- Hosts Memory Analysis (avg)
- Events
- CPU Usage Forecast (avg)
- Memory Usage Forecast (avg)
- Top 10 - CPU Utilization (max)
- Top 10 - Network Usage (max)
- Top 10 - Memory Active (max)
- Top 10 - Disk Performance (avg)
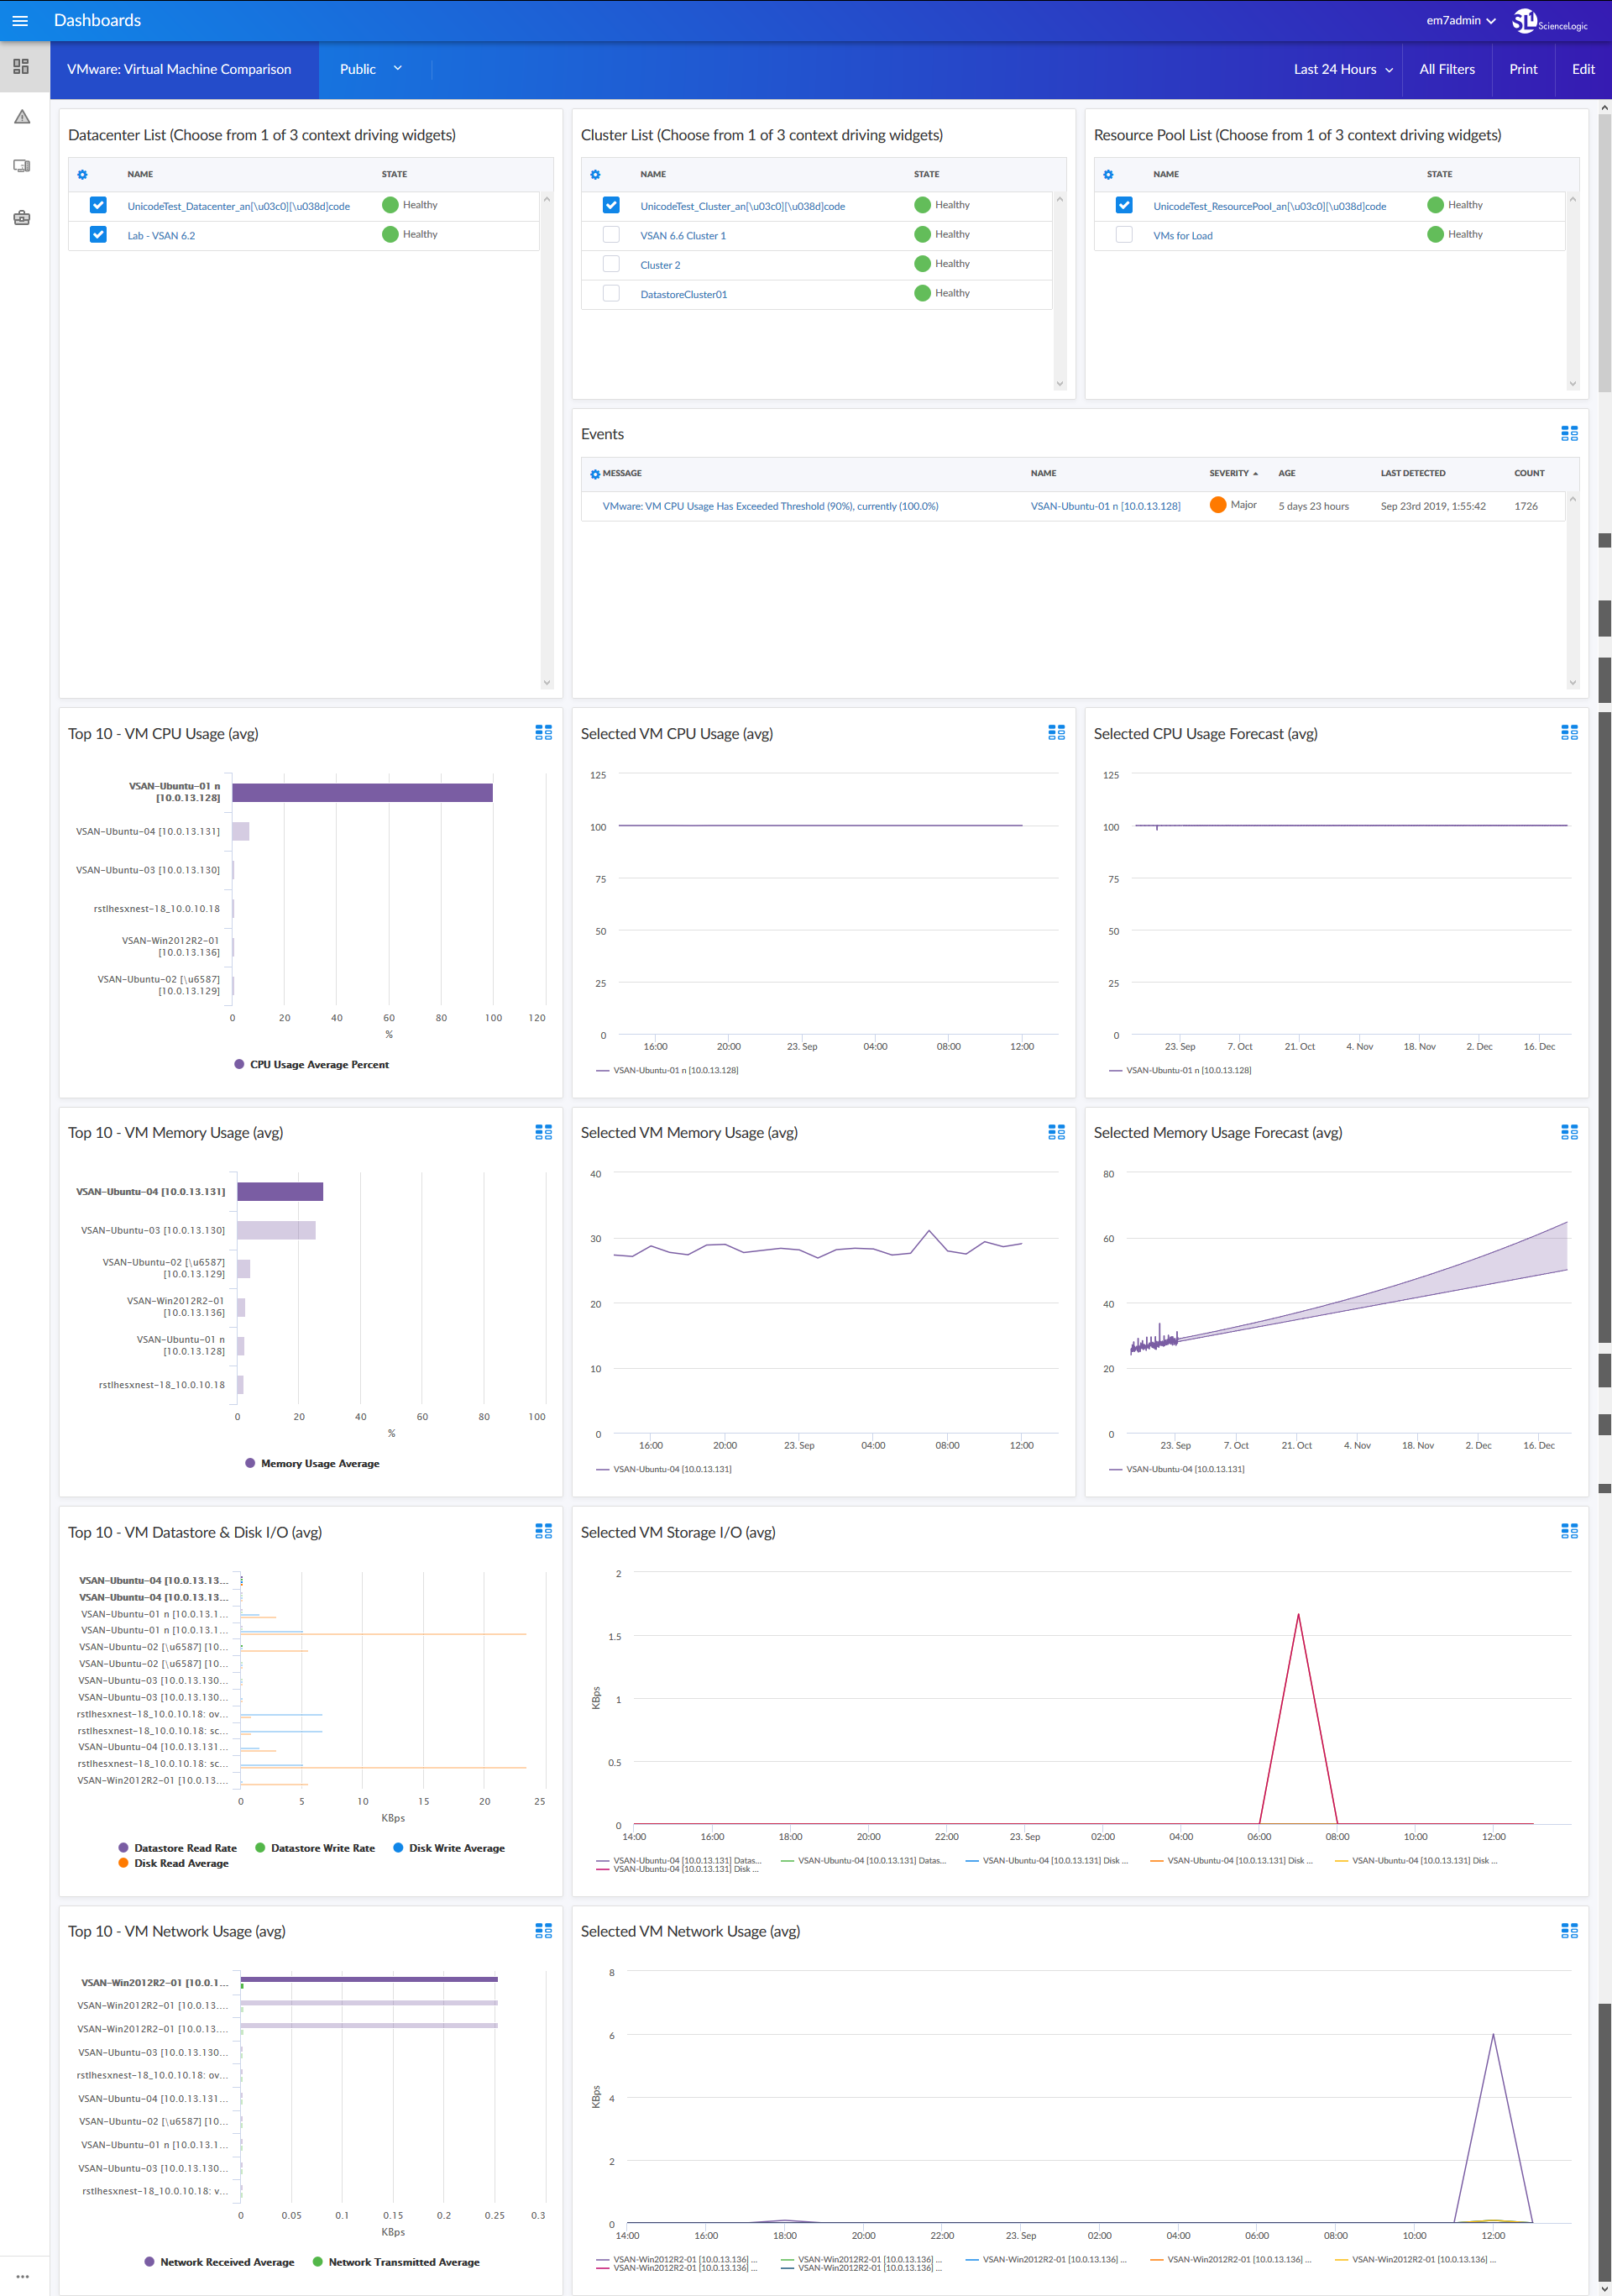
- A "VMware: Virtual Machine Comparison" dashboard, which includes the following widgets that display data about your VMware VMs:
- Datacenter List
- Cluster List
- Resource Pool List
- Events
- Top 10 - VM CPU Usage (avg)
- Selected VM CPU Usage (avg)
- Selected CPU Usage Forecast (avg)
- Top 10 - VM Memory Usage (avg)
- Selected VM Memory Usage (avg)
- Selected Memory Usage Forecast (avg)
- Top 10 - VM Datastore & Disk I/O (avg)
- Selected VM Storage I/O (avg)
- Top 10 - VM Network Usage (avg)
- Selected VM Network Usage (avg)
Enhancements and Issues Addressed
The following enhancements and addressed issues are included in version 102 of the VMware vSphere: SL1 Dashboards PowerPack:
- Autoselect for context-driving widgets has been enabled in all dashboards in the PowerPack.
- The CPU Forecast and Memory Forecast widgets were added to the "VMware: Host Performance" dashboard:
- The Events, Selected CPU Usage Forecast, and Selected Memory Usage Forecast widgets were added to the "VMware: Virtual Machine Comparison" dashboard.
- The Top 10 - VM Datastore I/O and Top 10 - VM Disk I/O widgets were combined into the Top 10 - VM Datastore & Disk I/O widget in the "VMware: Virtual Machine Comparison" dashboard.
- The following updates were made to the "VMware: vCenter Overview" dashboard:
- The vCenter List, Events, CPU Usage Forecast, and Memory Usage Forecast widgets were added to the dashboard.
- The following widgets were removed:
- Selected CPU Usage
- Selected CPU Reserved Capacity
- Selected Network Usage
- Selected Network Drops
- Selected Memory Analysis
- Selected Disk Performance
Known Issues
Version 102 of the VMware vSphere: SL1 Dashboards PowerPack has no known issues.