
OpenTelemetry provides a flexible solution for transferring observability data from an application into Skylar AI. You can enable other data sources for importing data in addition to Skylar One, including data from an OpenTelemetry (OTel) Collector.
You can view and create alert policies based on metrics received by the Skylar AI OTel Collector.
As of version 2.8, Skylar Advisor accepts OTel logs and metrics, but not traces. Only metrics are available for your to interact with and view in the Skylar Advisor user interface , and histograms are not supported. For performance reasons, ScienceLogic suggests that you currently send only the OTel data that you intend to use immediately. More metrics will be available in future releases.
Configuring the Skylar AI OTel Collector
You will need to configure and deploy an OTel Collector that collects a range of data and then converts that data into OpenTelemetry. That data gets sent to Skylar AI using OpenTelemetry Protocol (OTLP), a vendor-neutral standard that defines how telemetry data is encoded and transmitted between a source and a destination.
Configuration
To configure the Skylar AI OTel Collector:
-
Log in to Skylar AI and go to the Access Tokens page (
 > Account Settings > Instances > Access Tokens).
-
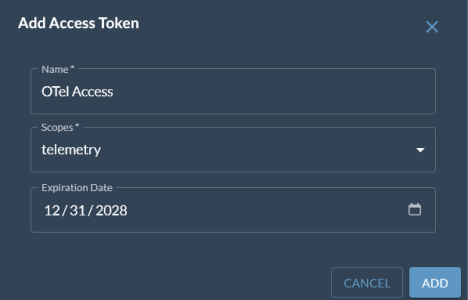
Click the button. The Add Access Token window appears.
-
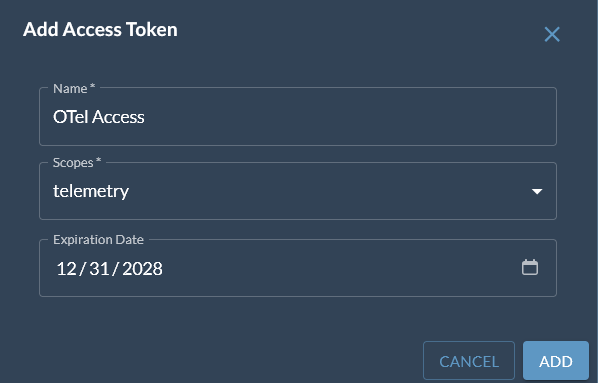
Complete the following fields:
-
Name. Type a name for the token, such as "Web Server 01".
-
Scopes. The scope of an access token determines which application or service you can connect to with the access token. You can select more than one scope for an access token.
If you are creating this access token to Create a Service Connection in Skylar One, select both sl1_connector and telemetry.
If you are creating this access token to Configure an OTel Collector for Skylar Advisor, select telemetry.
Do not use the same access token for a Skylar One service connection and the Skylar AI OTel Collector.
-
Expiration Date. Select an expiration date.
-
Click the button. The access token is added to the Access Tokens page.
-
Click the copy icon (
 ) to copy the access token to the clipboard.
-
In the Skylar Advisor user interface, go to the Preview Features page (
> Account Settings > Preview Features) and make sure that the Alert Builder option on the view is selected (blue). -
Go to the Skylar OTEL Collector page (
> Account Settings > Data Collection > Skylar OTEL Collector).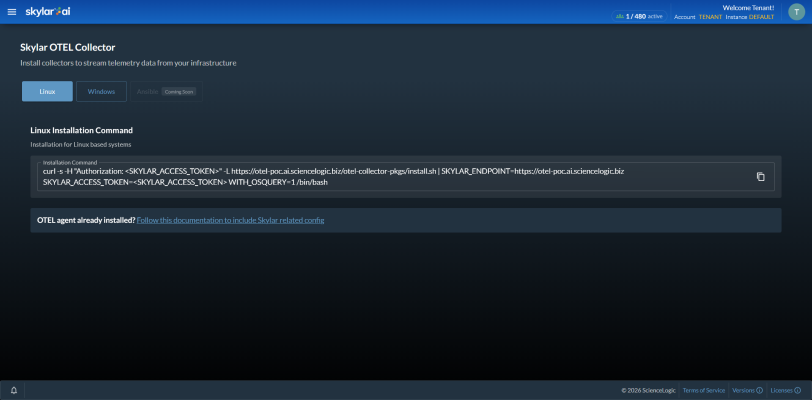
-
Based on the operating system of your collector, click the or button and copy the installation commands.
If your platform is not listed, you can use an OTel collector that matches your platform, based on the following configurations:
-
Run the relevant commands on your collector. Be sure to replace <SKYLAR_ACCESS_TOKEN> with your new token from steps 1-5. You must be an administrator to run these commands.
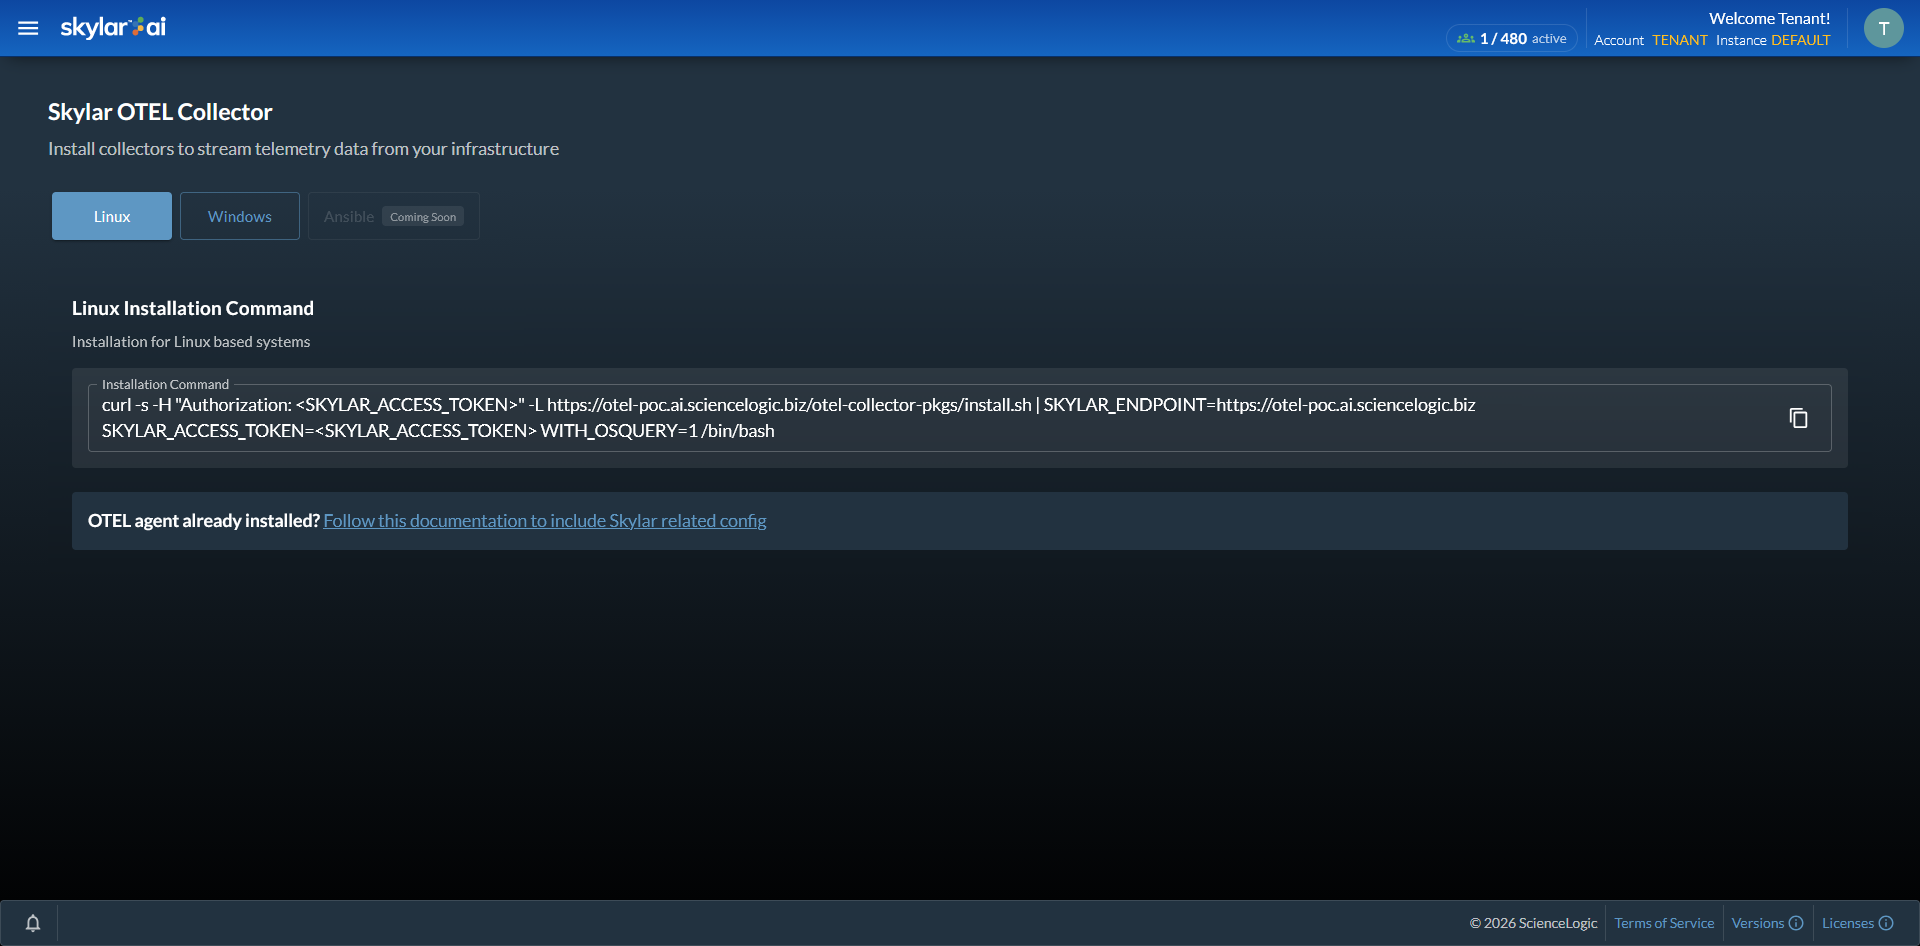
For more detailed configuration information, see Additional Configuration for the OTel Collector Exporter.
The OSQUERYcommand is only available for Linux, and it can be set to not install by changing the following environment variable from the copied installation command: WITH_OSQUERY=1should be WITH_OSQUERY=0.
After Configuration
As soon as you enable the newly installed Skylar AI OTel Collector and log in to the Skylar Advisor user interface, refresh the browser. You will see a link to the Alert Configuration page in the Skylar AI menu ( > Advisor > Alert Configuration).
Please note that the pages are initially inoperable as Skylar Advisor might take up to three to five minutes to become aware that the feature is enabled. After that time, the page should be functional, and the and tabs will stop returning error messages.
If you disable the OTel Collector by turning off the preview feature, Skylar Advisor will continue to ingest OTel data that is properly transmitted, but the processing of this OTel data for alerts will stop. Existing processed data remains in the database until it meets the TTL. Alerts continue to operate, but as no new data is processed for alert evaluation, they will never get triggered.
Considerations for OTel Data
Keep in mind the following details when using OTel data with Skylar Advisor:
- Alert policies cannot currently be created for OTel traces and logs.
- Alert policies apply to OTel collected metrics, not data from Skylar One.
- Alert policy conditions cannot be combined across metrics like a Skylar One formula.
- An alert policy with an occurrence count greater than 1, when updated or upon creation, will not backfill historical data. This means it will need to partially fill its buffer before alerting.
- You can only have 32 alert policies with an occurrence count greater than 1. Alert policies with an occurrence count of 1 are unlimited.
- Currently, there are no alert policies for when a device stops sending data to Skylar Advisor.
- Collecting OTel data requires an account licensed for Skylar Advisor.
The Alert Configuration Page
The metric data gathered by your OTel Collector appears in Skylar Advisor on the Alert Configuration page ( > Insights > Alert Configuration). You can use this OTel data to create new alert policies to generate alerts that can then be ingested and used by Skylar Advisor.
To use the Alert Configuration page in version 2.8.0 of Skylar AI, you will need to enable Alert Builder in the view on the Preview Features page ( > Preview Features).
On the tabs of the Alert Configuration page, you can browse OTel metrics and create alert policies directly from those metrics.
This page includes two tabs:
The Alert Definitions Tab
The tab on the Alert Configuration page contains a list of the alert policies you have created for OTel metrics. This tab also displays additional information for each alert policy, such as the conditions that will trigger the alert, and the severity and status of the alert.
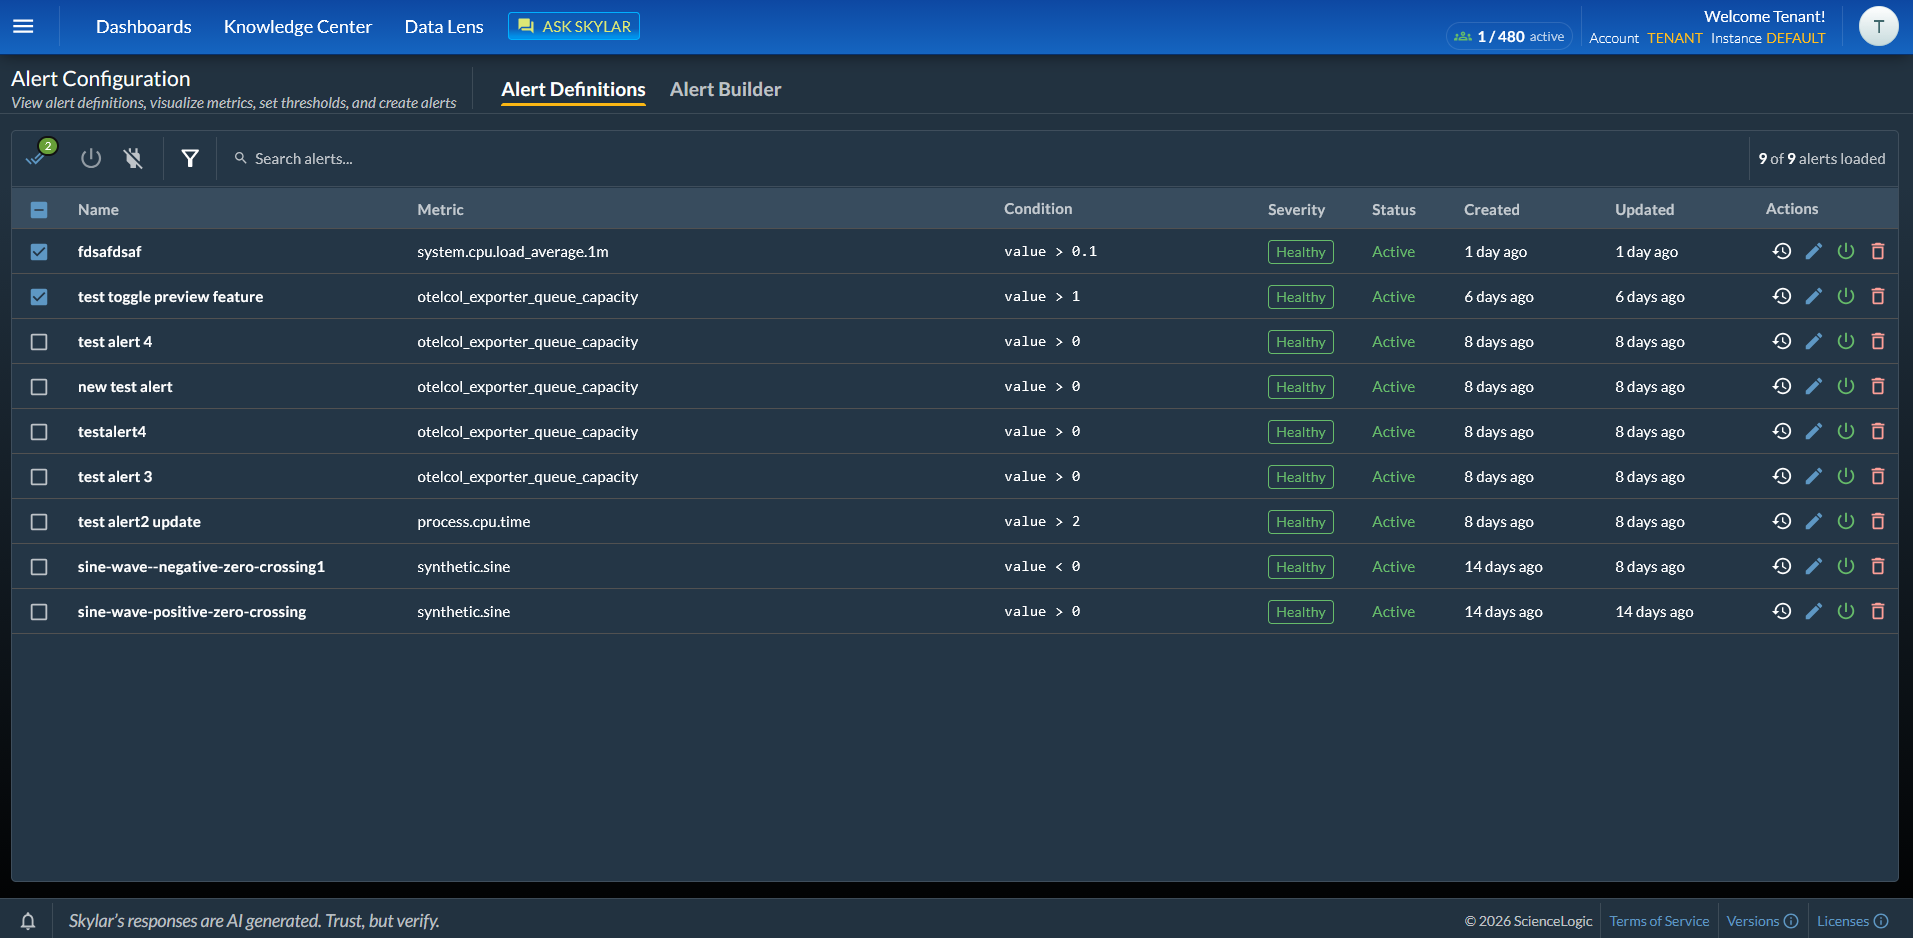
Editing Alerts
In the Actions column, you click an icon to edit an alert policy, make an alert policy inactive, or delete an alert policy.
You can sort the columns on the tab by clicking the table headings. You can also sort the list by typing search criteria into the Search field above the table.
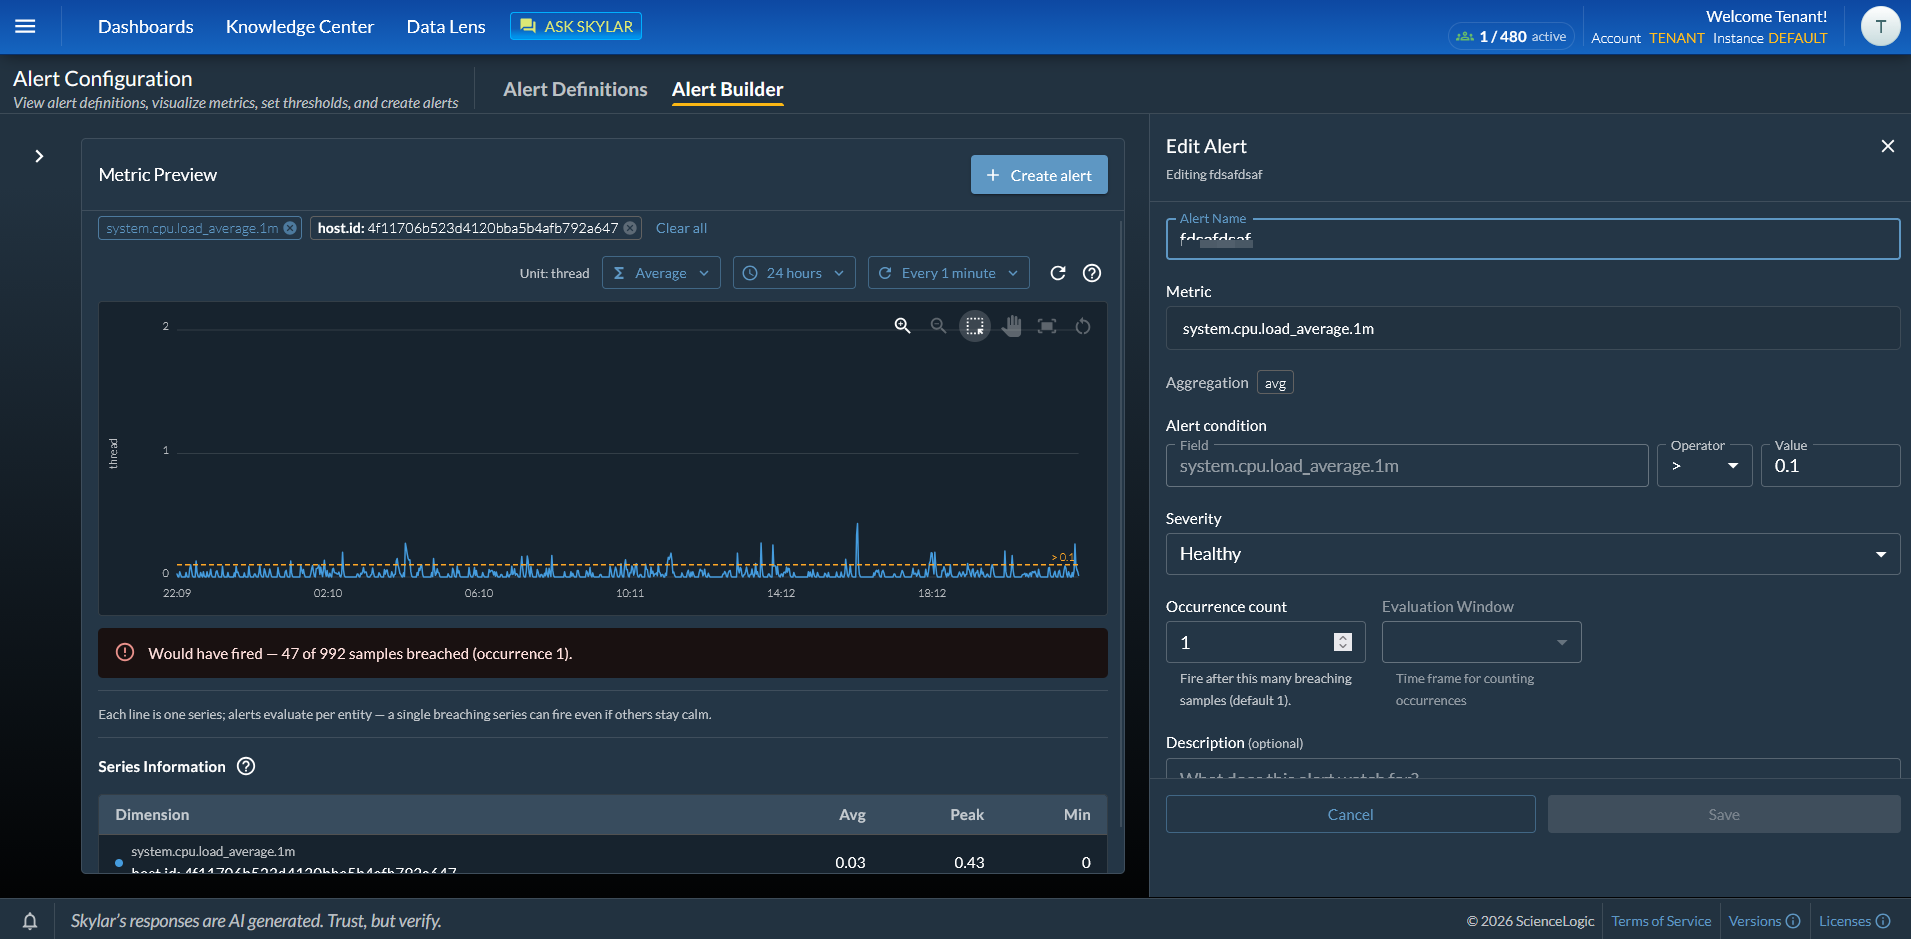
When you click the edit icon ( ) for an alert, an Edit Alert pane appears on the right with data about that alert policy. For more information, see To create an alert policy based on OTel metrics .
Viewing Triggered Alerts
You can view more details about a triggered (or "fired") alert on the Alert history pane. To access this pane, go to the Alert Definitions page ( > Advisor > Alert Configuration) and click the "View alert history" icon ( ) for a specific alert.
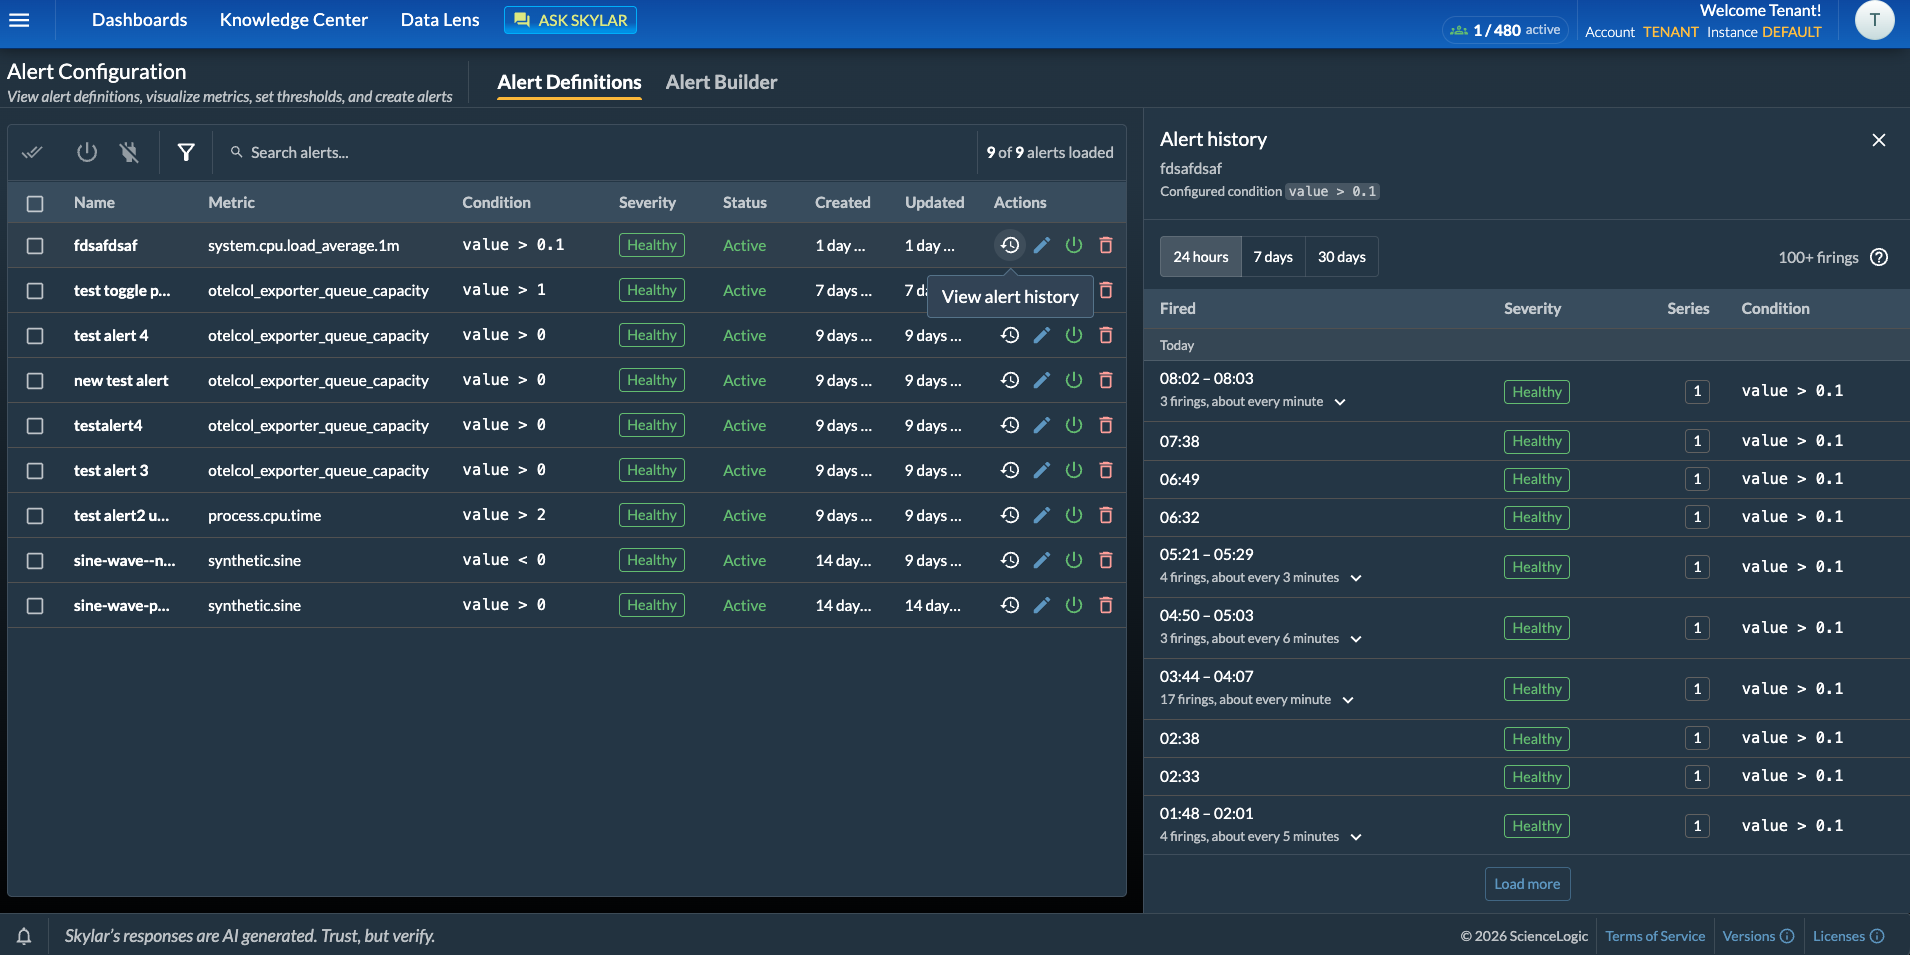
This view is paginated and shows up to 100 triggered alerts at a time. You can view the alert time, the severity, the condition for triggering it, and the number of series that triggered it for that time period.
The Alert Builder Tab
The tab on the Alert Configuration page lets you search the existing OTel metrics, view a graph based on that data, and create an alert policy for those metrics as needed.
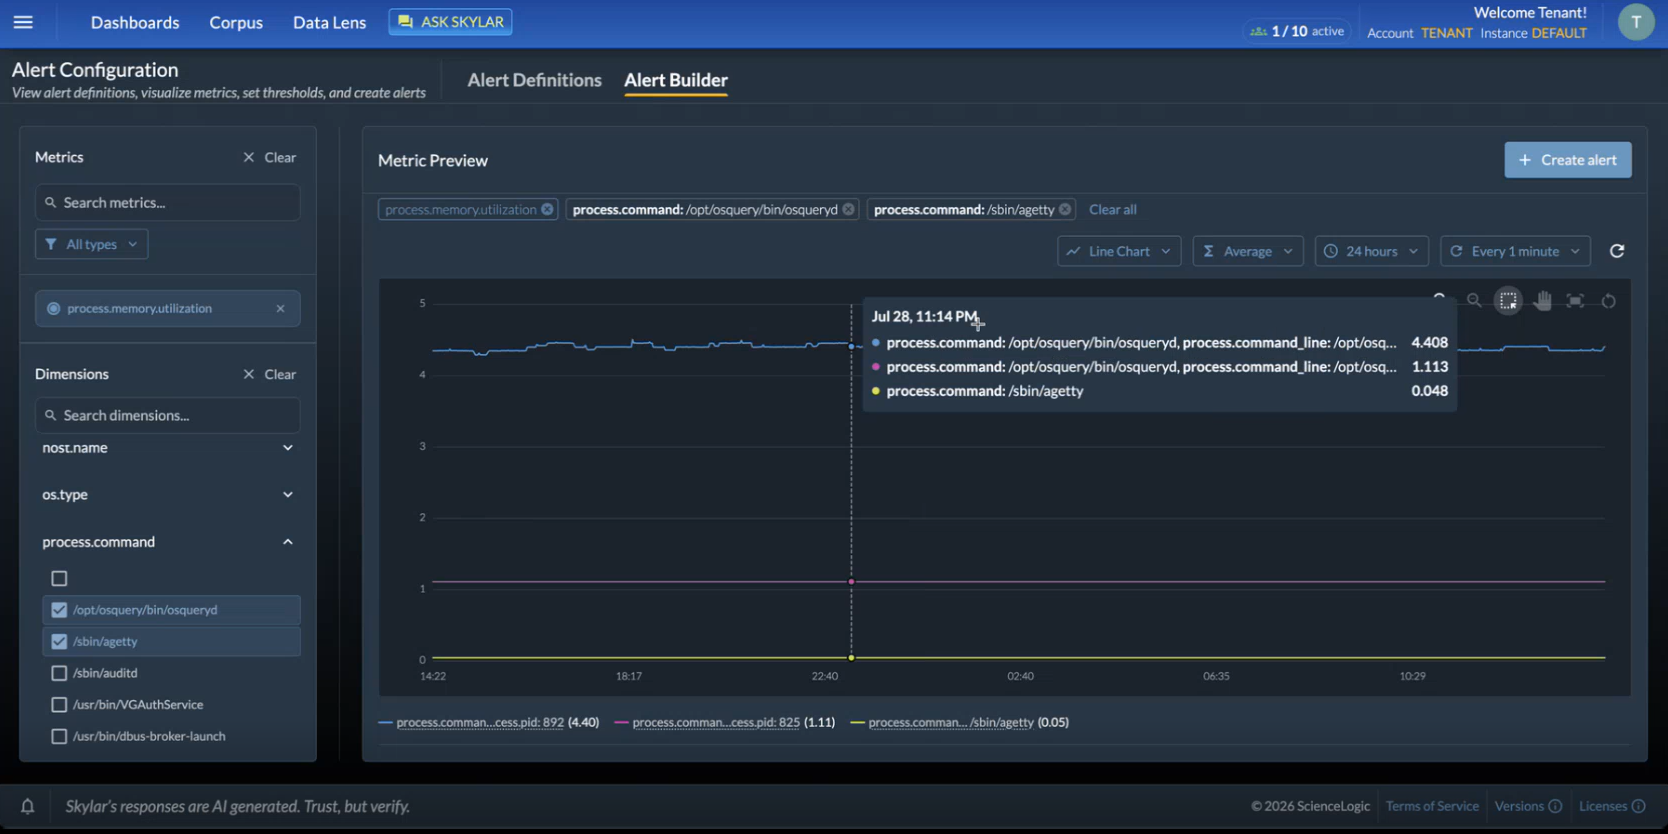
On the tab, you can create and manage threshold-based alert policies for OTel metrics.
To create an alert policy based on OTel metrics:
-
On the tab, go to the Metrics panel on the left and search for one or more metrics to monitor for the new alert policy.
You can sort the metrics by how the data is recorded:
-
Gauge: A value measured at a point in time, such as memory used.
-
Sum. A counter that accumulates, such as requests served.
-
-
Select a metric and one or more dimensions for that metric. The Metric Preview panel updates with a graph showing the history for that metric.
-
If needed, you can adjust the settings for the graph using the filter buttons on the Metric Preview panel.
-
When you have located the metric and dimensions that you want to monitor, click the button. An Alert Builder pane appears on the right.
-
Complete the fields on the Create Alert pane:
-
Alert Name. Type a descriptive name for this alert policy.
-
Metric. Lists the metric you selected for this alert policy. This field is read-only.
-
Aggregation. Displays the type of aggregation used for this alert policy, such as avg for average or min for minimum. This field is read-only. For more information, see Alert Builder Aggregations.
-
-
The following fields let you set up a threshold for this metric:
-
Alert condition. Specify the threshold that must be crossed to generate the alert.
-
Severity. Select one of five severity levels: Healthy, Notice, Minor, Major and Critical.
-
Occurrence count. Specify how many times a threshold must be crossed ("breached") before the alert is generated. The default is 1.
-
Evaluation window. The period over which the alert condition is evaluated. The alert triggers when the condition is met the number of times set in Occurrence count within this window. Available only when Occurrence count is greater than 1.
-
-
Description. Type a short explanation of what your alert policy does and why. Optional.
- Click . The new alert policy is added to the tab on the Alert Configuration page.
Alert Builder Aggregations
The Alert Builder page lets you choose an aggregation type when you are creating or editing an alert policy. An aggregation is an operation that compresses time series data so that a single data point represents collected data points over a defined span of time. The goal of an aggregation is for data that is being collected at a high frequency and the customer wants to reduce the amount of alerts they see over time.
The Alert Builder page currently offers the following aggregation options:
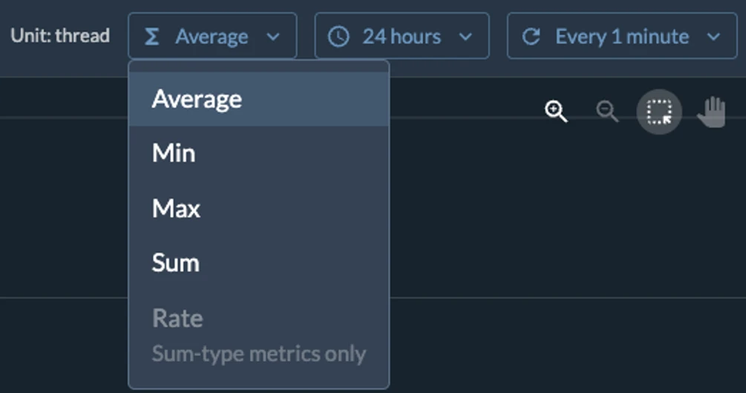
The best way to think of these spans of time is as buckets that either choose the sum, maximum, minimum or average value within the bucket.
- Average takes the average of all the datapoints, and that would represent the data at the middle of the bucket.
- Min takes the lowest value of all the datapoints shown at the oldest timestamp.
- Max takes the highest value of all the datapoints shown at the oldest timestamp.
- Sum adds up all of the datapoints in a specified bucket of time.
- Rate is used only for counter or sum metric types. The way that Skylar AI calculates the rate within the bucket is (max - min) / (bucket size in seconds).
Typically our bucket size is fixed to 60 seconds. This true with the exception of our 24-hour time period.
For example, let's say that we have six data points across six seconds. We have a bucket/step size of three seconds. The aggregation is set to Max value. For every bucket we choose the Max value and report that as the latest time value:
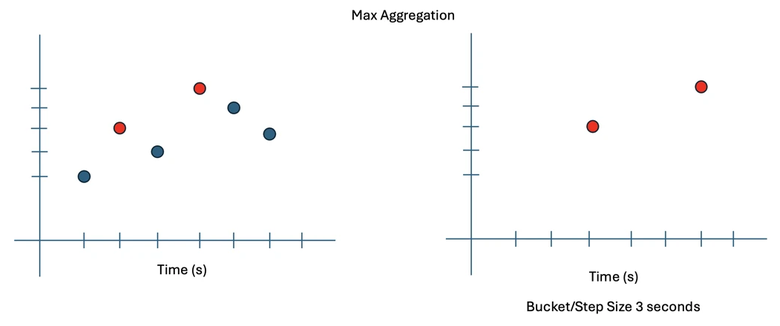
The result is fewer, but more relevant data points over time, for a clearer picture of what is going on in your environment.
Alert definitions currently do not take into account aggregation. Instead, they operate solely on the instantaneous collection interval, and alerts are triggered per sample.
Notes for This Release
This section lists key considerations for the Alert Configuration and Alert Builder features.
Data and Scope
- Alert policies on the tab are based only on OTel metrics. Traces and logs sent by the OTel Collector are not available for alert creation.
- Alert policies apply to data sent by the OTel Collector. They do not apply to data imported from Skylar One.
Alert Conditions
- Each alert policy has a single condition that compares the metric value to a threshold, using one of these operators: >, >=, <, <=, ==, !=. Multiple conditions cannot be combined in one alert policy.
- A limited number of alerts per instance can use an Occurrence count greater than 1. The default maximum is 32.
Alert Timing
- When the Occurrence count is 1, an alert policy can take up to five minutes to trigger after the condition is met.
- When Occurrence count is greater than 1, the time to trigger the alert policy depends on the Occurrence window: up to ten minutes for a one-hour window, and up to two hours for a 12-hour or one-day window.
- Creating, editing, or re-enabling an alert policy with an Occurrence count greater than 1 resets its history (no historical backfill). The alert cannot trigger until the condition has been met the required number of times within the Evaluation window after the change.
- If Skylar AI cannot activate an alert policy after you save it, the alert policy is saved with a status of Inactive. Check the Status column on the Alert Definitions tab and re-enable the alert policy.
The Alert Builder Page
- After an OTel collector starts sending data, its metrics can take several minutes to appear in the Metrics panel. Metrics that arrive later may not appear until the page data is refreshed.
- The "Metric Preview" graph is a visual aid. Data gaps are reported as a 0 value. Negative values are clipped.
OTel Collector Installation and Operation
- The installation commands contain an access token. Treat the commands as confidential.
- After you upgrade a collector, verify that the collector service is running and that its endpoint and access token settings are unchanged.
Additional Configuration for the OTel Collector Exporter
This topic contains an example of how to use the hostmetrics receiver to collect such items as the host CPU, memory and other metrics.
ScienceLogic suggests batching and using a memory limit processor. ScienceLogic suggests using a memory limit processor because in cases where our internal collector is degraded, Skylar AI applies back pressure, letting your collector know to resend the data in the form of 429s with a retry-after. This will cause memory to grow in the your collector and will not release until our collector is stable again. In some cases, it might make sense to drop data to avoid an OOM event wherever the you may be hosting your collector.
In the section below, where the Skylar AI URL and token are needed, use the access token from the Access Token page in the Skylar AI user interface to create a new token (do not use the same access token you used for the Skylar AI OTel Collector). It must be a valid token or the sent data will be rejected. Logs are the best place to look for proper sends.
The Skylar AI endpoint should look something like https://stcollab.ai.sciencelogic.biz. You do not have to add /v1/metrics in the URL.
---
receivers:
  hostmetrics:
    collection_interval: 1m
    scrapers:
      cpu: null
      load: null
      memory: null

processors:
  batch:
    send_batch_size: 16384
    timeout: 5000ms
  memory_limiter:
    check_interval: 1s
    limit_mib: 1000
  resourcedetection:
    detectors: ["system"]
     system:
       resource_attributes:
         host.ip:
           enabled: true
         host.id:
           enabled: true

exporters:
  otlphttp/skylar:
    endpoint: <skylar otel endpoint>
    headers:
      authorization: <skylar access token>

  pipelines:
    metrics:
      receivers:
        - hostmetrics
      processors:
        - memory_limiter
        - batch
        - resourcedetection
      exporters:
        - otlphttp/skylar
If you already have a configuration for your collection, add the following to that configuration file:
exporters:
  otlphttp/skylar:
    endpoint: <skylar_ai_otel_endpoint>
    headers:
      authorization: <skylar_ai_access_token>
And then add the Skylar AI exporter to your pipeline:
  pipelines:
    metrics:
...
      exporters:
        - otlphttp/skylar