
This
Initial Troubleshooting Steps
The first step taken when troubleshooting should be to ensure that there are no issues with the data platforms with which Skylar Automation is interacting. There might be additional configurations or actions enabled on Google Cloud or Skylar One that result in unexpected behavior. Perform the steps in the following sections to troubleshoot Skylar Automation and Google Cloud. For detailed information about how to perform the steps below, see Resources for Troubleshooting.
Skylar Automation
- Run docker service ls on the Skylar Automation server.
- Note the Docker container version, and verify that the Docker services are running.
- If a certain service is failing, make a note the service name and version.
- Run docker service ps <service_name> to see the historical state of the failing service and make a note of this information. For example: docker service ps iservices_contentapi
- Make a note of any logs impacting the service by running docker service logs <service_name>. For example: docker service logs iservices_couchbase
Google Cloud Platform
- Make a note of the SyncPack version, if applicable.
- Make a note of the Google Cloud application that is failing on Skylar Automation.
- Make a note of what step is failing in the application. Try running the application in debug mode, and capture any traceback or error messages that occur in the step log.
Resources for Troubleshooting
This section contains port information for Skylar Automation and troubleshooting commands for Docker, Couchbase, and the Skylar Automation API.
Useful Skylar Automation Ports
- https://<IP of Skylar Automation>:8091. Provides access to Couchbase, a NoSQL database for storage and data retrieval.
- https://<IP of Skylar Automation>:15672. Provides access to the RabbitMQ Dashboard, which you can use to monitor the service that distributes tasks to be executed by Skylar Automation workers.
- https://<IP of Skylar Automation>/flower/workers. Provides access to Flower, a tool for monitoring and administrating Celery clusters.
- https://<IP of Skylar Automation>:3141. Provides access to the pypiserver service. which you can use to see if SyncPacks have been correctly uploaded to Devpi container.
Port 5556 must be open for both Skylar Automation and the client.
skyautocontrol healthcheck and autoheal actions
Skylar Automation includes a command-line utility called skyautocontrol (skyautoctl) that performs multiple administrator-level actions in a clustered Skylar Automation environment. The skyautocontrol (skyautoctl) utility contains automatic cluster healthcheck and autoheal actions that you can use to prevent issues with your Skylar Automation environment.
For more information, see Using the skyautocontrol Command-line Utility.
Helpful Docker Commands
Skylar Automation is a set of services that are containerized using Docker. For more information about Docker, see the Docker tutorial.
Use the following Docker commands for troubleshooting and diagnosing issues with Skylar Automation:
Viewing Container Versions and Status
To view the Skylar Automation version, SSH to your instance and run the following command:
rpm -qa | grep powerflow
To view the individual services with their respective image versions, SSH to your Skylar Automation instance and run the following command:
docker service ls
In the results, you can see the container ID, name, mode, status (see the replicas column), and version (see the image column) for all the services that make up Skylar Automation:

Restarting a Service
Run the following command to restart a single service:
docker service update --force <service_name>
Stopping all Skylar Automation Services
Run the following command to stop all Skylar Automation services:
docker stack rm iservices
Restarting Docker
Run the following command to restart Docker:
systemctl restart docker
Restarting Docker does not clear the queue.
Viewing Logs for a Specific Service
You can use the Docker command line to view the logs of any current running service in the Skylar Automation cluster. To view the logs of any service, run the following command:
docker service logs -f iservices_<service_name>
Some common examples include the following:
docker service logs –f iservices_couchbase
docker service logs –f iservices_steprunner
docker service logs –f iservices_contentapi
Application logs are stored on the central database as well as on all of the Docker hosts in a clustered environment. These logs are stored at /var/log/iservices for both single-node or clustered environments. However, the logs on each Docker host only relate to the services running on that host. For this reason, using the Docker service logs is the best way to get logs from all hosts at once.
The application logs stored locally on individual node filesystems can now be collected using the skyautocontrol (skyautoctl) command-line utility collect_pf_logs action. For more information, see collect_pf_logs.
The logs in Skylar Automation use the following loglevel settings, from most verbose to least verbose:
- 10. Debug Mode.
- 20. Informational.
- 30. Warning. This is the default settings if you do not specify a loglevel.
- 40. Error.
If you run applications with "loglevel": 10, those applications will take longer to run because of increased I/O requirements. Enabling debug logging using the following process is the only recommended method. ScienceLogic does not recommend setting "loglevel": 10 for the whole stack with the docker-compose file.
To run an application in Debug Mode using the Skylar Automation user interface:
- Select the Skylar Automation application from the Applications page.
- Hover over from and select Debug Run from the pop-up menu. Skylar Automation executes the application in Debug Mode with a log level of 10.
To run an application in Debug Mode using the API:
-
POST the following to the API endpoint:
https://<Skylar Automation>/api/v1/applications/run
-
Include the following in the request body:
{
"name": "<application_name>",
"params": {
"loglevel": 10
}
}
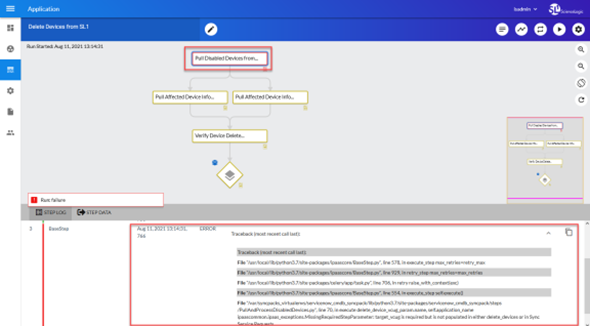
After running the application in Debug Mode, review the step logs in the Skylar Automation user interface to see detailed debug output for each step in the application. This information is especially helpful when trying to understand why an application or step failed:
s
You can also run an application in debug using curl via SSH:
-
SSH in to the Skylar Automation instance.
-
Run the following command:
curl -v -k -u isadmin:em7admin -X POST "https://<your_hostname>/api/v1/applications/run" -H 'Content-Type: application/json' -H 'cache-control: no-cache' -d '{"name": "interface_sync_sciencelogic_to_servicenow","params": {"loglevel": 10}}'