This chapter explains the key concepts that make up Skylar Automated RCA.
The following video explains how Skylar Automated RCA can automatically show you the root cause of any kind of software or infrastructure problem, without any manual training or rules: https://player.vimeo.com/video/990374134?h=df358c657f.
Skylar Automated RCA
Skylar Automated RCA (Root Cause Analysis) uses unsupervised machine learning on logs to automatically find the root cause of software problems. It does not require manual rules or training, and it typically achieves accuracy within 24 hours.
As Skylar Automated RCA ingests logs, the Skylar artificial-intelligence (AI) engine analyzes the logs, looking for abnormal log line clusters that resemble problems, such as abnormally correlated rare and error events from across all log streams.
When the Skylar AI detects an "abnormal" cluster of problematic events, it generates a suggestion, which appears on the Alerts page (the home page) of the Skylar Automated RCA user interface along with the existing alerts:
On the Alerts page, the summary report for a suggestion and an alert contains the following main elements:
- AI-generated title. Displaying at the top of the summary pane, this title is generated using GPT Services that use new Generative AI models. You can enable or disable GPT services for a specific deployment of Skylar Automated RCA by using the GPT Services column on the Deployments page (Settings (
 )> Deployments).
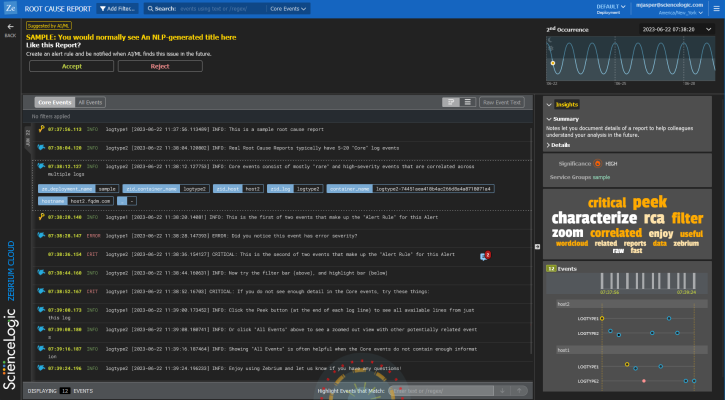
 - Word Cloud. A set of relevant words chosen by the Skylar AI from the log lines contained in the alert. On the RCA report page, you can click a word in the cloud to highlight that word in the list of logs.
- Significance icon. Since not all suggestions that the Skylar AI generates will relate to problems that actually impact users, the engine attempts to reason over the data and assess whether a problem actually requires attention. Hover over this icon at the top of the list of logs to view the confidence level of the Skylar AI for this suggestion:
- A red icon (
 ) means "High" confidence.
 - A yellow icon (
 ) means "Medium" confidence.
 - A blue icon (
 ) means "Low" confidence.
- A red icon (
- AI Assessment . Since not all suggestions that the Skylar AI generates will relate to problems that actually impact users, the Skylar AI attempts to reason over the data and assess whether a problem actually requires attention. Depending on the quality of the data, some suggestions might not include an AI Assessment. This value is shown in the Skylar Automated RCA user interface as an AI Assessment value of one of the following:
- "Your Attention Needed" for content that the Skylar AI believes should be looked into.
- "No Attention Needed" for content that the Skylar AI assesses as unlikely to require immediate attention.
- Root Cause (RCA) Report Summary. The report contains the actual cluster of anomalous log lines that was identified by the Skylar AI. Up to eight of these log lines are shown in the summary view. You can click anywhere in the summary to view the full Root Cause report.
- Alert Key. One or two log lines, denoted with a key icon (
 ), that are used to identify the suggestion if this type of suggestion occurs again. The alert keys make up an alert rule.
You can click anywhere in the summary report for a suggestion or an alert to view a more detailed Root Cause Report page for that suggestion or alert. For more information, see Root Cause Reports.
Suggestions are generated when the Skylar AI finds a cluster of correlated anomalies in your logs that resembles a problem. However, this does not mean that all suggestions relate to actual important problems. This is especially true during the first few days of using Skylar Automated RCA, as the Skylar AI learns the normal patterns in your logs.
When you start getting suggestions on the Alerts page, you can review the word clouds and event logs that display in the summary views for the Root Cause reports for the suggestions. As a best practice, identify a specific time frame when a possible problem occurred, and then start looking at the reports that have the most interesting or relevant information related to the possible root cause of the problem.
You can choose to "accept" or "reject" a suggestion. For more information, see Assessing Suggestions.
You can also decide on the action to take if the same kind of alert type occurs again, such as sending a notification to Slack, email, or another type of notification. For more information, see Notification Channels.
If you currently use SL1 from ScienceLogic, you can configure an integration that lets you view Skylar Automated RCA suggestions in SL1 dashboards as well as on the SL1 Events page. For more information, see ScienceLogic Integrations.
Root Cause Reports (RCA Reports)
A Root Cause Report or RCA Report is a report generated by the Skylar AI that consists of a group of log events that the Skylar AI identified as being part of a problem.
A full RCA Report page (below) appears after you click the summary view for that report on the Alerts page:
The RCA report contains the actual cluster of anomalous log lines that was identified by the Skylar AI. There are typically between ten and 100 log events in a report. Up to eight of these log lines are shown in the summary view. Clicking a summary on the Alerts page takes you to the full RCA report.
Each RCA report matches a particular "fingerprint" of log events. You can add notes, summaries, Jira links, and alert preferences to the alert rules for the RCA report so that future occurrences of the same type of problem will reflect these preferences and notes.
For more information, see Suggestions and Root Cause Reports.
Alert Rules and Alert Keys
An alert rule is made up of one or two log events that best represent a specific type of problem that caused the event, and these events often provide clues as to the nature of the problem. These notable log events are called alert keys, and the Skylar AI uses these keys to trigger an alert when new log data is ingested.
A key icon (![]() ) appears next to an alert key in the list of log events on the Alerts page and on the RCA Report page:
) appears next to an alert key in the list of log events on the Alerts page and on the RCA Report page:
The Skylar AI also uses the alert keys as a "signature" for a particular type of alert. There are typically two hallmark events:
- The first event in the sequence, which is usually a rare event or anomaly and often relates the root cause.
- A high severity event, either as determined by log severity, or other indicators, such as certain words or phrases indicating a problem, like "exception", "failed", "could not restart", and so on.
You can edit the alert keys of any Root Cause (RCA) report to select different log events if you believe those log events are more useful. Future matches of this type of RCA report will match against your user-defined alert keys, and carry forward your notes, summaries, Jira links, and alert preferences.
For more information, see Editing Alert Keys.
Log Collectors
When you are setting up your Skylar Automated RCA system, one of the first tasks you need to do is configure a method for gathering log data to send to Skylar Automated RCA so the Skylar AI can begin to analyze the log data.
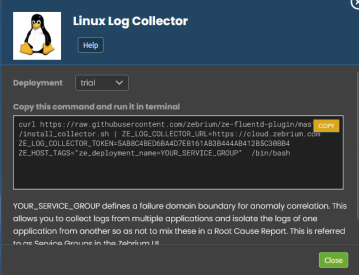
You would typically configure one or more log collectors to gather logs and send those logs to Skylar Automated RCA for automated incident detection. For example, the following dialog explains how to set up a Linux log collector:
You can also use a file upload method using ze, the Skylar Automated RCA command-line interface for uploading log events from files or streams.
For more information, see Log Collectors and File Uploads.
Service Groups
A Service Group is the collection of log types, pods, hosts, and other items that are all part of a "failure domain". In other words, logs from the micro-services and processes that could all interact with each other to contribute to an incident should be part of a service group. The Skylar AI will only attempt to correlate anomalies and errors across logs that fall within a service group. For more complex applications, you can have multiple service groups if there is more than one failure domain.
You can view a list of service groups by clicking the button on the Alerts page. The Selected Filter dialog contains a list of service groups in the Service Groups filter.
Using a service group allows you to collect logs from multiple applications or support cases and isolate the logs of one from another so as not to mix these in a RCA report.
If omitted, the service group is set to "default", which means that the service group represents shared services. For example, a database that is shared between two otherwise distinctly separate applications would be considered a shared service. In this example scenario, you would set the service group to "app01" for one application and "app02" for the other application. For the database logs, you would either omit the service group setting, or you could explicitly set it to "default".
With this configuration, RCA reports will consider correlated anomalies across the following:
"app01" log events and default (i.e. database logs) and
"app02" log events and default (i.e. database logs) but not across:
"app01" and "app02
For more information, see Suggestions and Root Cause Reports .
Notification Channels
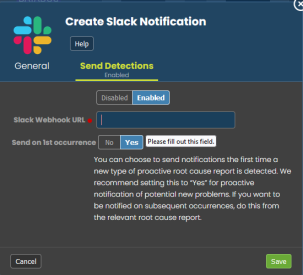
Notification Channels provide a mechanism to define the methods that Skylar Automated RCA will use to send notifications from RCA reports. The supported types of notification channels include email, as well as Microsoft Teams, Slack, and Webex Teams notifications.
After you have created one or more notification channels, you can link any number of these to any RCA report created by the Skylar AI. Linking a set of notification channels to a RCA report will send notifications of future RCA reports of the same type to those channels.
For more information, see Notification Channels.
ScienceLogic Integrations
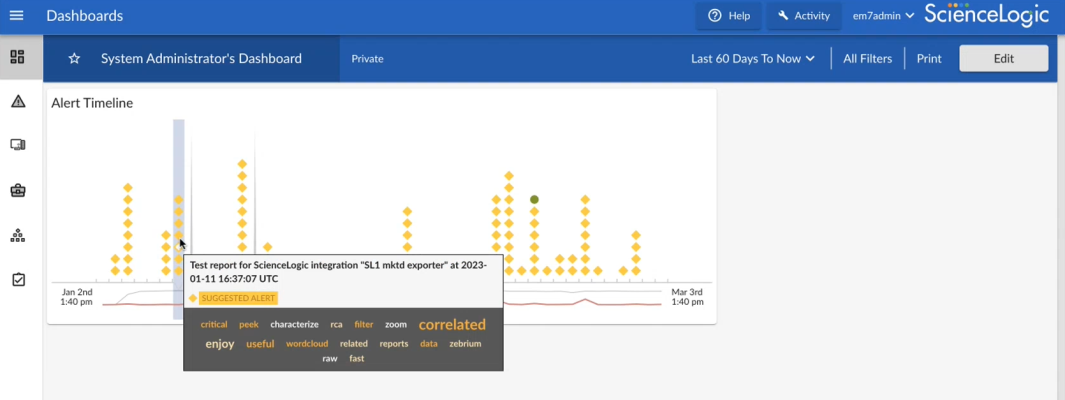
You can integrate the Root Cause service with the SL1 platform from ScienceLogic to send suggestions and alerts to the SL1 dashboards or to SL1 Events, Devices, and Services pages.
The following image shows the interactive Root Cause Timeline widget in an SL1 dashboard:
To enable a ScienceLogic integration, go to the Integrations & Collectors page (Settings (![]() ) > Integrations & Collectors), select an integration type, and follow the instructions for setting up that dashboard.
) > Integrations & Collectors), select an integration type, and follow the instructions for setting up that dashboard.
For more information, see ScienceLogic Integrations.
Incident Management Integrations
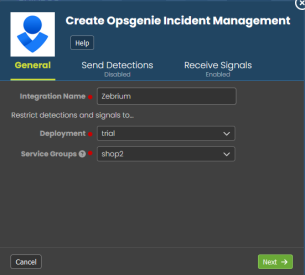
You can configure an integration between Skylar Automated RCA and your third-party Incident Management application to automatically add Root Cause (RCA) reports to your incidents in the third-party application. Each Skylar Automated RCA report includes a summary, word cloud, and a set of log events display symptoms and root cause, along with a link to the full report in the Skylar Automated RCA user interface.
After you complete the configuration, you can view details of root cause and direct the incident to the appropriate team. All of these features lead to faster Mean Time to Repair (MTTR) and less time manually hunting for root cause.
For more information, see Incident Management Integrations.
Integrations Using Webhooks
Skylar Automated RCA provides support for using webhooks so you can build your own custom integrations.
Skylar Automated RCA provides the following webhooks:
- Outgoing Root Cause Report Webhook
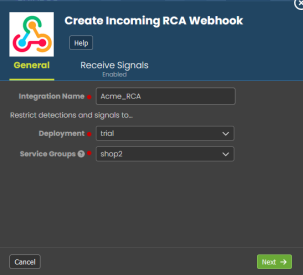
- Incoming Root Cause Report Incoming Webhook
For more information, see Using Webhooks to Create Integrations .
Skylar Automated RCA On Prem
In additional to the standard option of a cloud configuration for Skylar Automated RCA, you also have the option for a Skylar Automated RCA on-premises (On Prem) configuration that is not located in the cloud.
For more information, see Skylar Automated RCA On Prem.

